🐋 IWM $12.6M Bear Put Spread -- Institutional Whale Bets Small Caps Drop 5% in 11 Days!
📅 February 27, 2026 | 🔥 Unusual Activity Detected
🎯 The Quick Take
Someone just dropped $12.6 MILLION net on a massive IWM bear put spread -- buying 79,500 contracts of the March 10 $255 puts for $20M and simultaneously selling 79,500 contracts of the March 10 $246 puts for $7.4M. This is a defined-risk bearish bet that the Russell 2000 falls at least 2% to $255 (and ideally 5.5% to $246 or below) within just 11 calendar days. The maximum payout? $71.6 million. That is a 5.7-to-1 potential reward-to-risk ratio on a trade that expires before the March FOMC meeting. With 79,500 contracts, this is one of the largest single-day bearish ETF options trades of the year.
📊 ETF Overview
iShares Russell 2000 ETF (IWM) is the benchmark small-cap ETF:
- 📈 What it tracks: Russell 2000 Index -- ~2,000 US small-cap stocks
- 💰 AUM: $74.9B (managed by BlackRock/iShares)
- 🏢 Sector: Broad small-cap equity
- 📈 Exchange: NYSE Arca
- 📊 Current Price: ~$261
- 📊 52-Week Range: $174.70 - $271.60
- 📊 YTD Return: +8.0% (outperforming S&P 500 by ~4%)
- 📊 All-Time High: $269.79 (Jan 22, 2026)
- 📊 Expense Ratio: 0.19%
- 📊 Holdings: ~2,000 stocks across Healthcare (18.8%), Industrials (18.1%), Financials (17.2%), Tech (~13%)
- 🔥 Key Story: The "Great Rotation" of 2026 has pushed small caps to historic outperformance -- but this whale is betting the rotation takes a breather
💰 The Option Flow Breakdown
📊 The Tape -- Paired Bear Put Spread
| Time | Symbol | Side | Buy/Sell | Type | Expiration | Premium | Strike | Volume | OI | Size | Spot | Option Price | Option Symbol |
|---|---|---|---|---|---|---|---|---|---|---|---|---|---|
| 12:56:24 | IWM | ASK | BUY | PUT $255 | 2026-03-10 | $20M | $255 | 80K | 202 | 79,500 | $260.50 | $2.50 | IWM20260310P255 |
| 12:56:24 | IWM | MID | SELL | PUT $246 | 2026-03-10 | $7.4M | $246 | 80K | 52 | 79,500 | $260.50 | $0.93 | IWM20260310P246 |
Combined Strategy: Bear Put Spread
- 💸 Net Debit Paid: ~$12.6M ($20M bought - $7.4M collected)
- 📐 Spread Width: $9 ($255 - $246)
- 📊 Max Profit: $71.55M (if IWM at or below $246 at expiration)
- 📉 Breakeven: ~$253.43 ($255 strike - $1.57 net debit per share)
- ⏰ Time to Expiry: 11 calendar days (7 trading days)
- 📊 Reward-to-Risk: 5.7:1
🤓 What This Actually Means
Let me walk through what is happening here, because 79,500 contracts on a weekly expiration is genuinely extraordinary.
The Structure:
This is a textbook bear put spread -- a defined-risk bearish strategy. The trader:
- Bought 79,500 March 10 $255 puts at $2.50 each (paying $20M total)
- Sold 79,500 March 10 $246 puts at $0.93 each (collecting $7.4M)
- Net cost: $1.57 per share, or $12.6M total
Why this matters:
- 📊 79,500 contracts = exposure to 7.95 MILLION shares of IWM. At ~$261, that is roughly $2.08 BILLION in notional exposure. This is institutional scale -- hedge fund, pension fund, or asset manager territory.
- ⏰ 11 days to expiration is extremely aggressive. This is not a "wait and see" hedge -- this is a trade that needs IWM to move fast. Something specific is motivating this timing.
- 📈 The long $255 put is 2.1% OTM -- meaning IWM needs to drop about $5.50 just to reach the long strike. It needs to drop $7.07 (to $253.43) to break even.
- 📉 Maximum payout at $246 or below = a 5.5% decline from current levels. The $9 spread width x 79,500 contracts x 100 shares = $71.55M on a $12.6M outlay.
- 🤝 Simultaneous execution at the same timestamp confirms this is a single trade, not two separate legs placed at different times. The long put was bought on the ASK (aggressive buyer) while the short put was sold at MID (institutional negotiation on the hedge leg).
What kind of trader does this?
This profile screams macro hedge fund or portfolio overlay. The most likely interpretation: an institution with substantial long equity exposure (potentially billions in small-cap stocks or Russell 2000 futures) is buying short-term downside protection ahead of a specific risk event. The March 10 expiration sits right before the March 12 CPI release and well ahead of the March 17-18 FOMC meeting -- suggesting the trader sees near-term event risk concentrated in this window.
Alternative interpretation: This could be a speculative directional bet by a macro fund that sees the small-cap rally as overextended and vulnerable to a pullback. The 5.7:1 reward-to-risk ratio is attractive if you believe the move is coming.
📈 Technical Setup / Chart Check-Up
YTD Performance
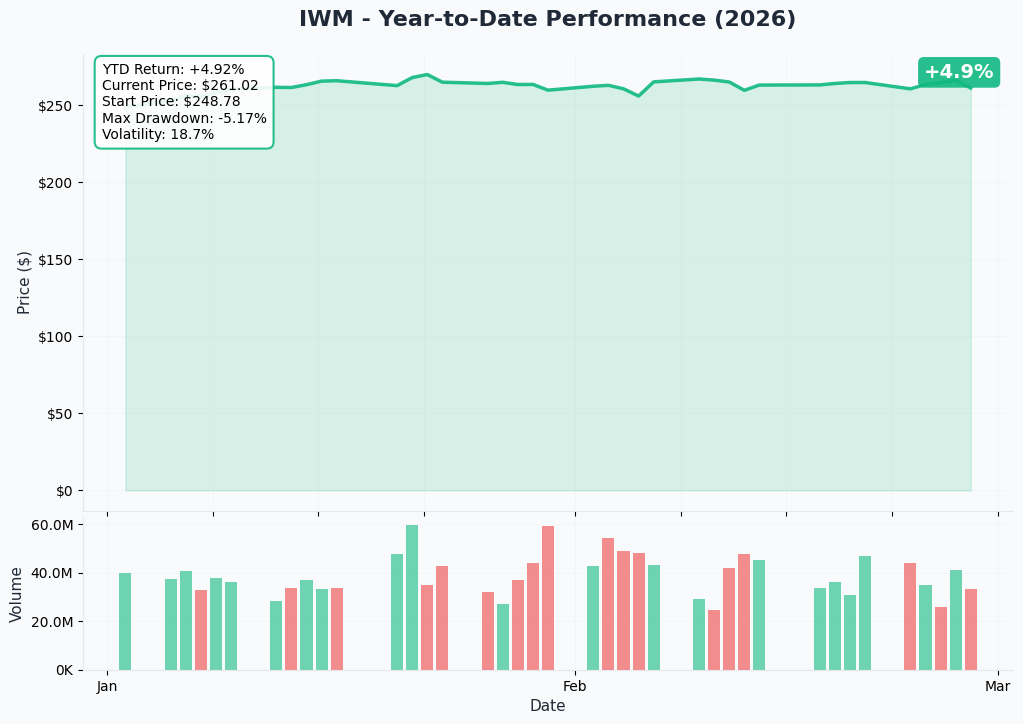
IWM is up +8.0% YTD, riding the "Great Rotation" theme as money rotates from mega-cap tech into small caps:
- 🚀 January surge: Russell 2000 surged +5.8% in the first two weeks of 2026 -- the strongest opening in over a decade
- 📈 All-time high: Hit $269.79 on January 22
- 📉 Recent pullback: Down about 3% from ATH, currently trading near $261
- ⚡ February volatility: Tariff turbulence on February 23 rattled markets -- small caps felt the pressure
- 📊 Outperforming: Russell 2000 has outperformed the S&P 500 by ~4% in 2026 -- the widest gap since the rotation began
Key takeaway: IWM has had a strong YTD but is now pulling back from its all-time high, sitting roughly 3% below the January peak. The whale is betting this pullback accelerates into a 5%+ correction over the next 11 days.
Gamma-Based Support & Resistance Analysis
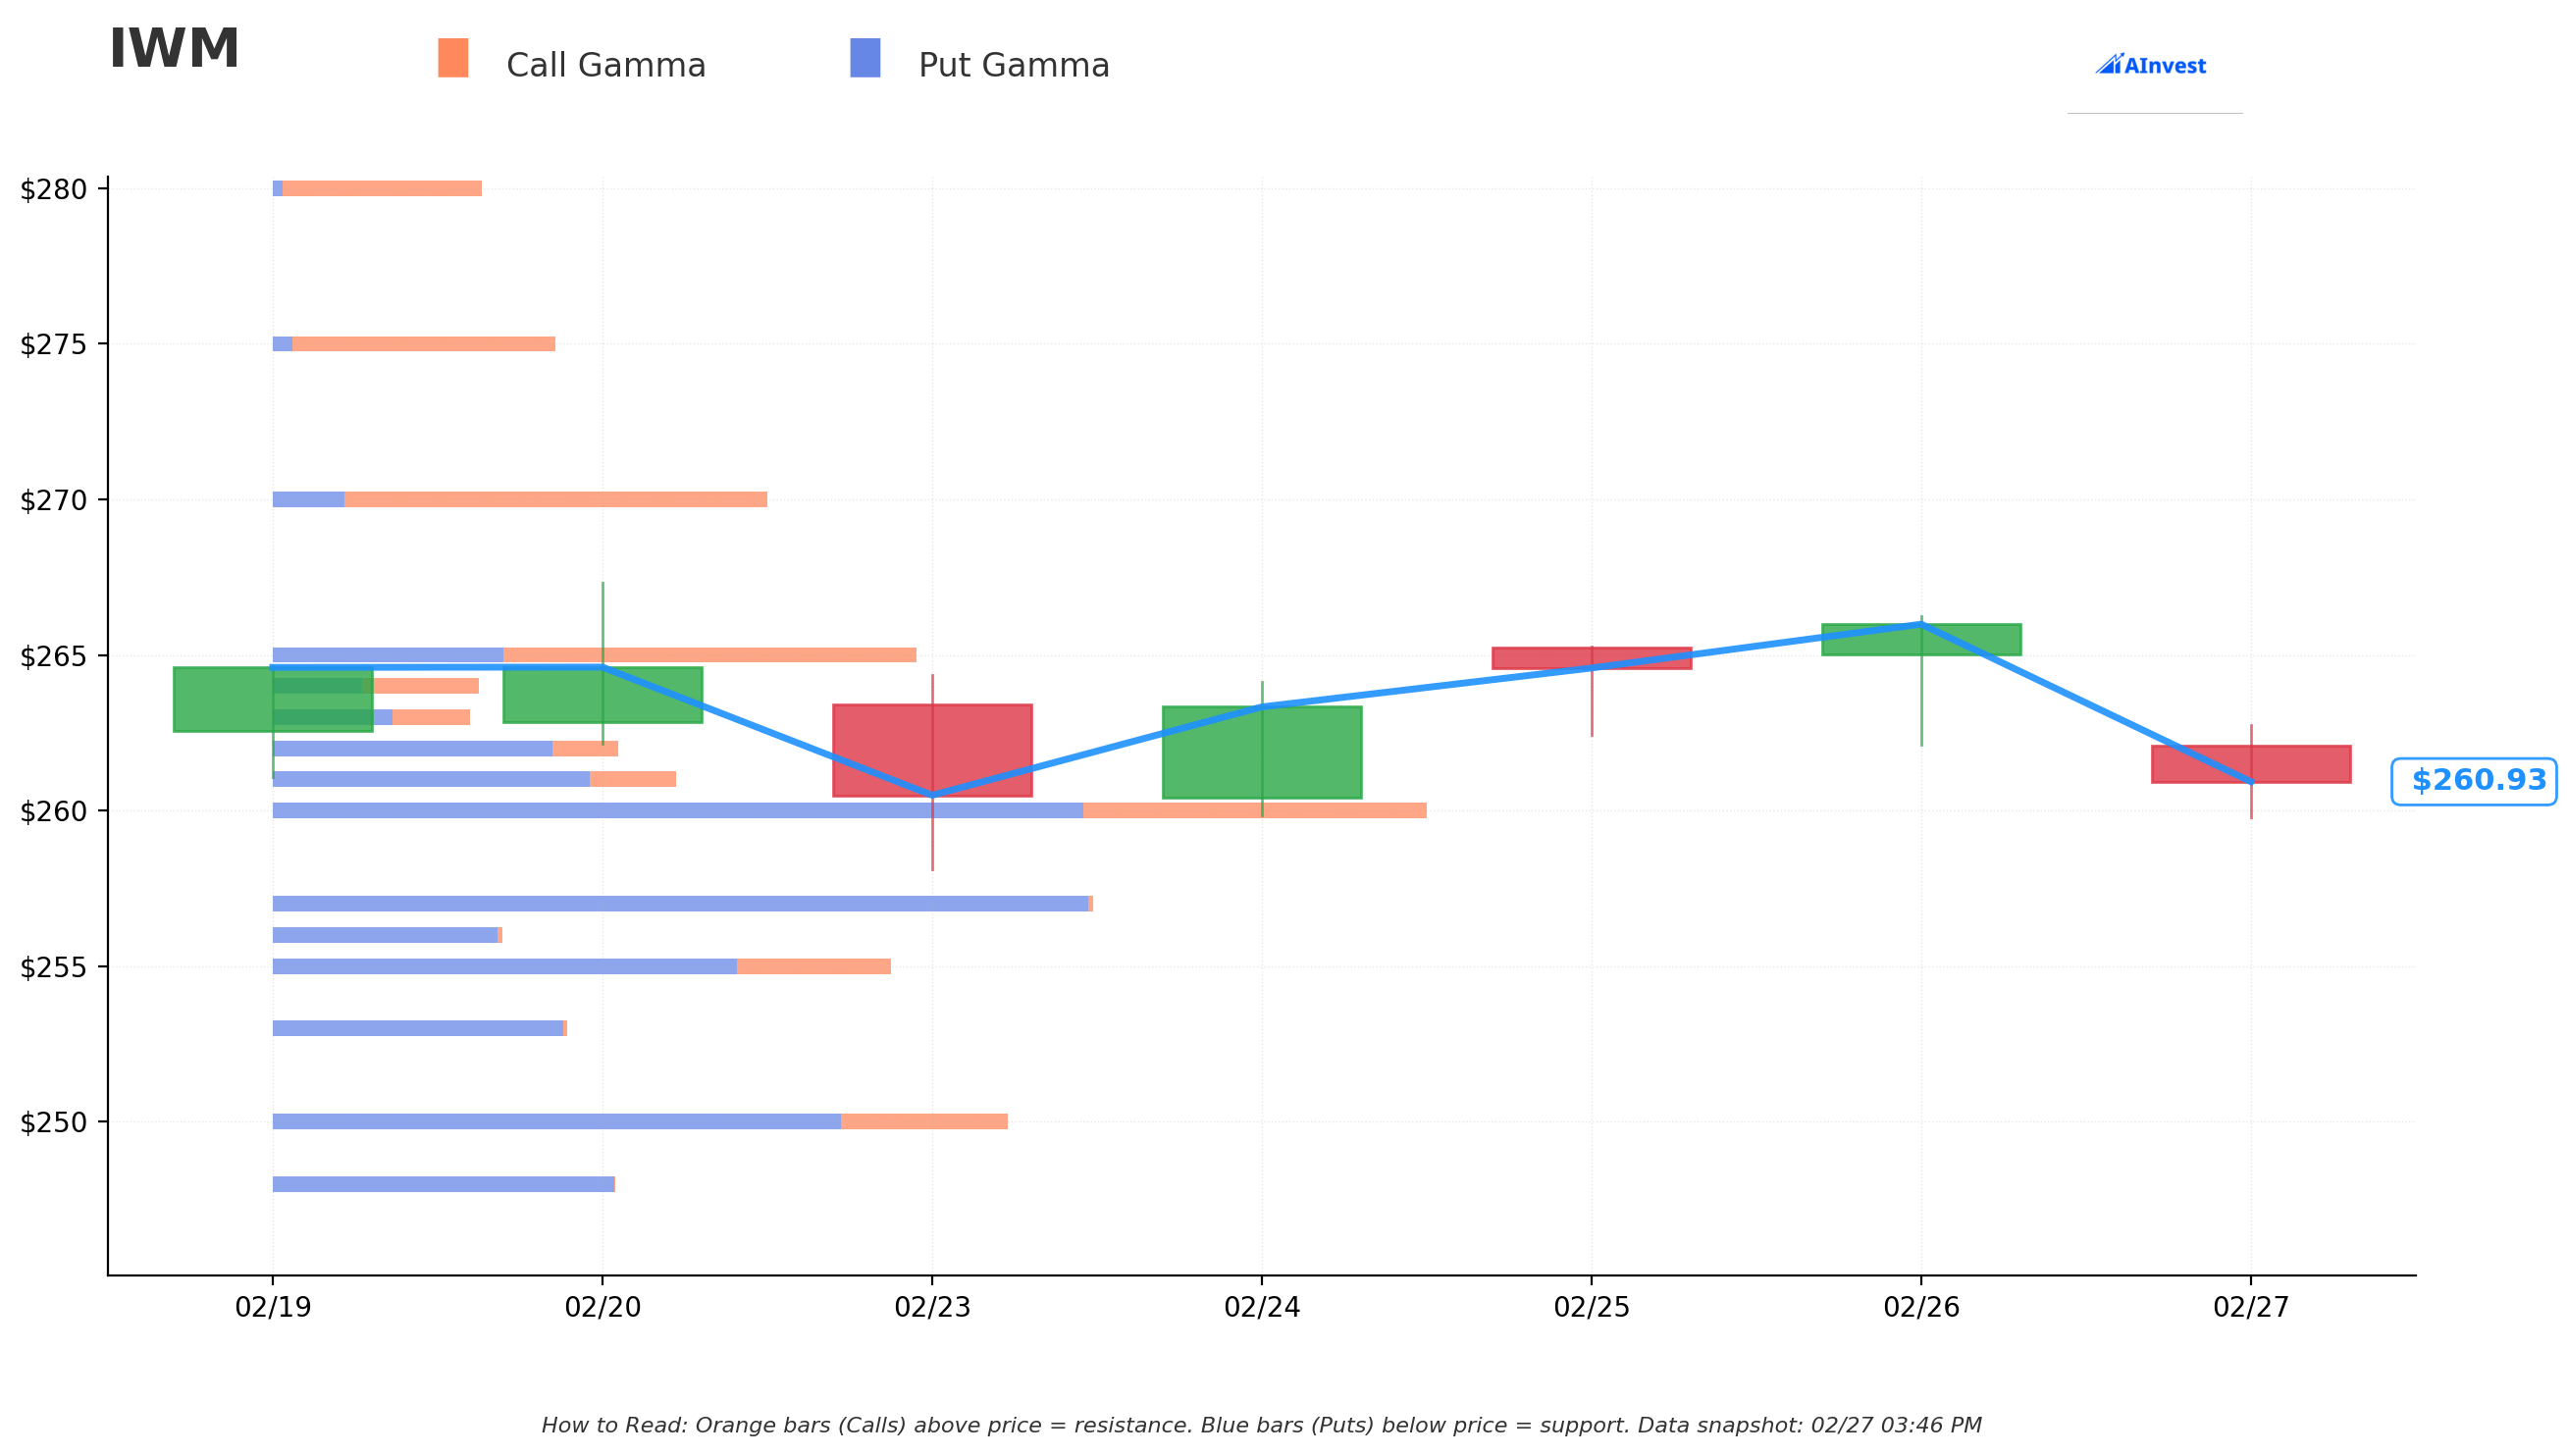
Current Price: $260.83
The gamma exposure map reveals the options market maker positioning around IWM, and it paints a decidedly bearish picture:
🔵 Support Levels (Put Gamma Below Price):
- $260 -- Strongest immediate support with 249.6B total gamma (just 0.3% below current price -- essentially right here). Net GEX is -108B (put-heavy), meaning dealers must sell shares as price approaches this level, AMPLIFYING any downside move.
- $257 -- Heavy support at 165.3B total gamma (1.5% below). Net GEX -163.3B -- the most negative net gamma on the board.
- $255 -- The LONG PUT strike at 123.6B total gamma (2.2% below). Net GEX -62.2B. If IWM breaks below $257, this whale's trade starts working fast.
- $250 -- Deep support at 147.3B total gamma (4.2% below). Net GEX -80.6B. Key psychological level.
- $248 -- Additional floor at 69.7B total gamma (4.9% below).
- $245 -- Extended support at 89.3B total gamma (6.1% below). Net GEX -53.5B.
- $240 -- Major floor at 91.3B total gamma (8.0% below). Net GEX -49.2B.
🟠 Resistance Levels (Call Gamma Above Price):
- $261 -- First resistance at 76.1B total gamma (barely above at 0.07%). Net GEX -42.5B -- even the nearest resistance is put-dominated.
- $265 -- Significant resistance at 136.5B total gamma (1.6% above). Net GEX +27.4B -- finally call-positive, creating a true ceiling.
- $270 -- Strong resistance at 98.4B total gamma (3.5% above). Net GEX +69.7B -- the nearest ATH zone.
What this means for traders:
The gamma landscape is overwhelmingly bearish. Net GEX Bias: Bearish -- total put gamma (1,610B) is more than double total call gamma (741B). This means market makers are positioned such that they must sell shares as IWM declines, creating a self-reinforcing downward pressure. Every support level below price has negative net gamma, meaning dealer hedging will ACCELERATE any selloff rather than cushion it.
The whale's bear put spread aligns perfectly with this structure. The $255 long put sits right at a gamma support level, and if IWM breaks through $257 (the most negative net gamma strike on the board), the path to $250 and $246 gets much easier as dealer selling compounds the move.
Implied Move Analysis
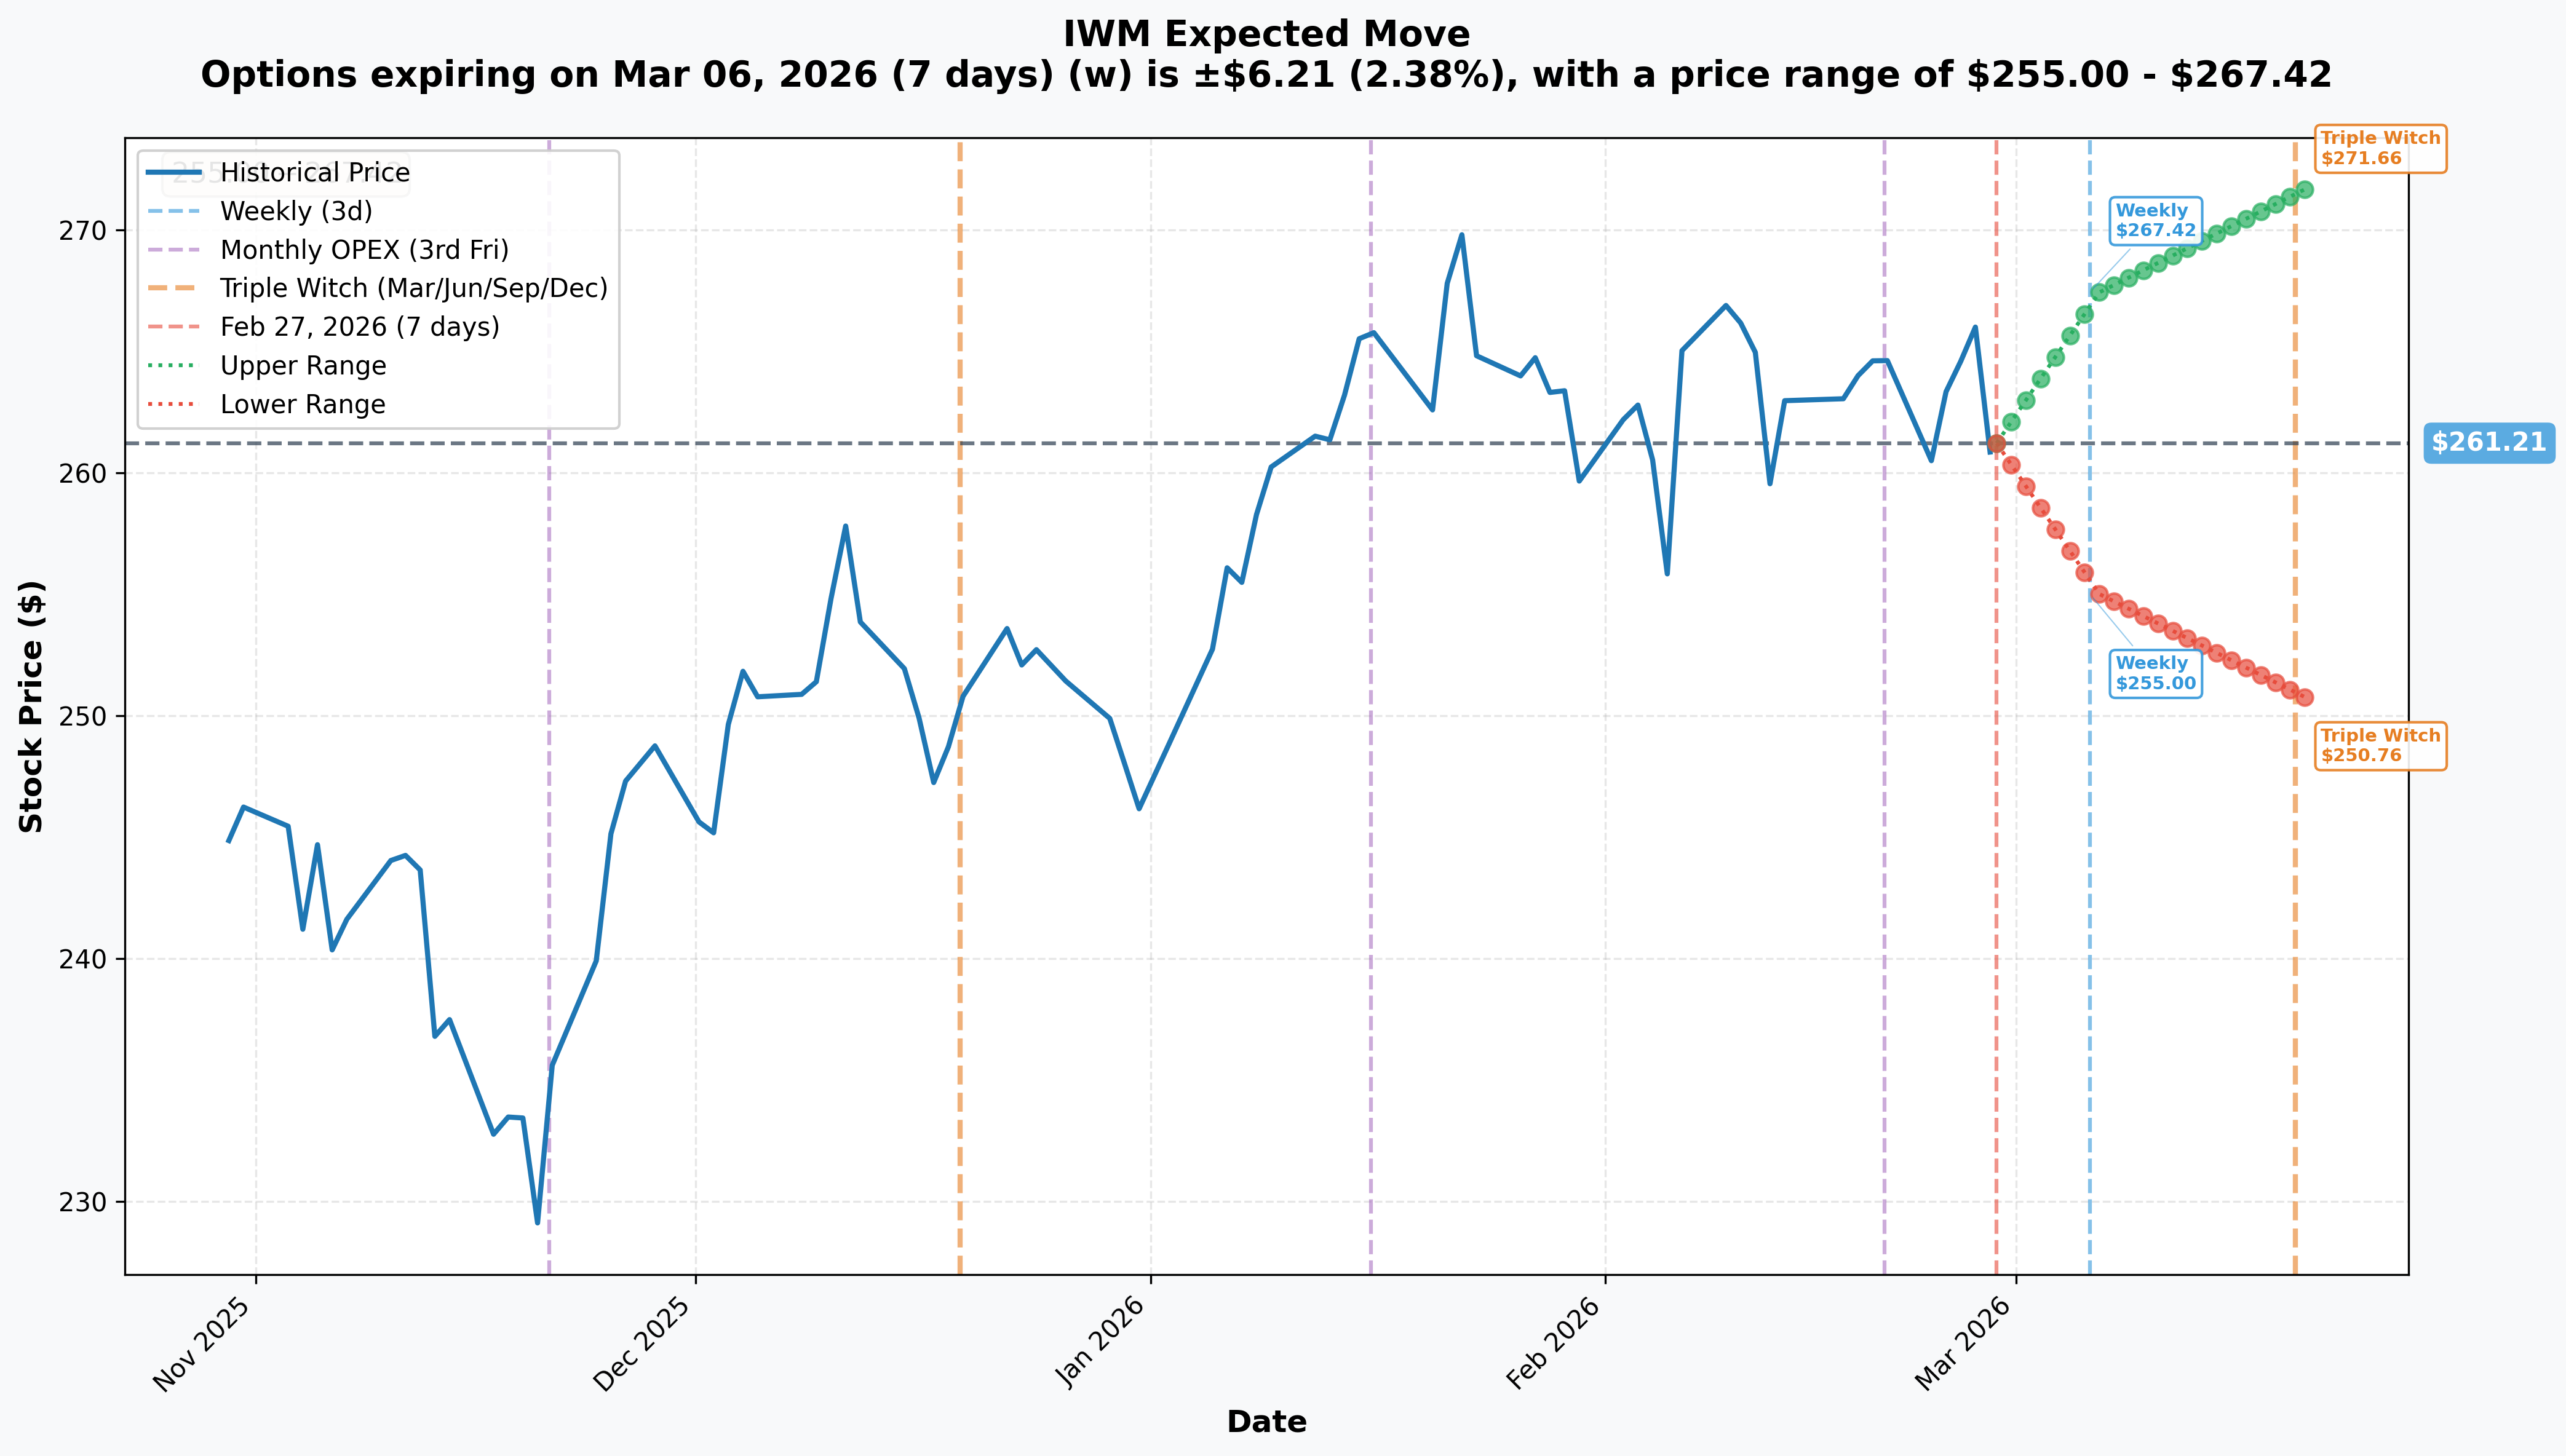
Options market pricing for upcoming expirations:
- 📅 Weekly (Mar 6 -- 7 days): ±$6.21 (±2.38%) --> Range: $255.00 - $267.42
- 📅 Monthly OPEX / Triple Witch (Mar 20 -- 21 days): ±$10.45 (±4.0%) --> Range: $250.76 - $271.66
How the whale's trade maps to implied moves:
- 📊 Long $255 put is right at the lower bound of the weekly implied move ($255.00). The market is pricing roughly a 16% probability of IWM reaching $255 by March 6. The whale has 4 extra days (March 10 expiry) to get there.
- 📊 Short $246 put is below even the monthly implied lower bound ($250.76). This is deep OTM -- the market sees less than a 10% chance of IWM hitting $246 by March 20, let alone by March 10.
- 📊 Breakeven at $253.43 is roughly 1.5% below the weekly implied lower bound -- the trade needs IWM to move to the tail of the expected distribution to profit.
Translation: This whale is betting on a tail event -- a move that the options market currently prices as unlikely. Either they have conviction about a specific catalyst that isn't fully priced, or they're hedging a much larger portfolio against a low-probability, high-impact scenario.
🎪 Catalysts
🔥 Upcoming Catalysts (Before and Around March 10 Expiry)
PCE Price Index -- January Data (February 28, 2026 -- TOMORROW) 📊
This is the Fed's preferred inflation gauge and the most immediate catalyst. With core CPI at 2.5% in January, the market expects core PCE around 1.9-2.2%. A hot print would immediately reprice rate cut expectations and hit small caps hardest -- given their floating-rate debt sensitivity.
ISM Manufacturing PMI -- February Data (March 3, 2026) 🏭
The January reading shocked to the upside at 52.6 -- the first expansion in 12 months. But there is a risk it was inflated by tariff front-loading (companies pre-buying ahead of price hikes). A reversion below 50 would collapse the "manufacturing renaissance" narrative that supports the Industrials sector (18.1% of Russell 2000).
February Jobs Report (March 6, 2026) 💼
January showed 130K payrolls against a 55K consensus, but the massive 2025 downward revision (584K to 181K) raised concerns about the true state of the labor market. A weak February report would directly hit small caps -- 77% of Russell 2000 revenue is domestic, making them acutely sensitive to US consumer spending.
Trade Expiration -- March 10, 2026 ⏰
The bear put spread expires. Either the whale collects up to $71.6M, or they lose their $12.6M premium. No extensions, no rolling -- this is a firm deadline.
CPI -- February Data (March 12, 2026) 📊
Just two days after this trade expires. The whale may be positioning for the lead-up volatility as markets price CPI risk, or may view this trade as pre-CPI protection that they intend to roll if needed.
FOMC Meeting with SEP/Dot Plot (March 17-18, 2026) 🏦
The first 2026 Summary of Economic Projections will recalibrate rate cut expectations. While this falls after the March 10 expiry, pre-FOMC positioning typically begins 5-7 trading days ahead -- meaning volatility from this event could bleed into the trade window.
✅ Recent Catalysts (Already Happened)
Tariff Turbulence -- February 23, 2026 ⚖️
Markets rattled by tariff uncertainty and AI anxiety. The shift from a 3% to an estimated 18% average effective tariff rate creates margin compression for import-dependent small caps in auto parts, retail, and construction.
Consumer Confidence Uptick -- February 24, 2026 📊
Conference Board index rose to 91.2 from 89.0, but consumers remain wary about high costs and inflation expectations -- a mixed signal for the small-cap domestic spending thesis.
Q4 2025 Small-Cap Earnings Beat -- Through February 📈
A 65% beat rate ended the 13-quarter streak of large-cap earnings dominance. But the whale may be betting this is already fully priced into the +8% YTD rally.
ISM Manufacturing Surge to 52.6 -- February 3, 2026 🏭
The first expansion in 12 months, but employment (48.1) and inventories (47.6) subindices remained in contraction. Some analysts believe the headline number was inflated by pre-tariff order frontloading.
Fed Hold at 3.50-3.75% -- January 28, 2026 🏦
The Fed held rates steady with a dovish lean. Two rate cuts are priced for 2026, with the first most likely at the June meeting. But if February data comes in hot, even the June cut gets repriced -- and small caps feel it first.
🎲 Price Targets & Probabilities
Using gamma levels, implied move data, the catalyst calendar, and the trade's expiration window (11 calendar days), here are the scenarios through March 10:
📈 Bull Case -- Whale Loses (40% probability)
IWM: $261-$270
How the whale gets burned:
- 📊 Tomorrow's PCE comes in at or below expectations, reinforcing rate cut hopes
- 🏭 March 3 ISM confirms manufacturing expansion is genuine, not tariff-driven
- 💼 March 6 jobs report shows resilient labor market without overheating
- 📈 The "Great Rotation" continues as capital rotates from tech into small caps
- 🎯 IWM holds above $260 gamma support and pushes toward $265 resistance
- 🏦 Goldman Sachs, BofA, and JP Morgan all remain constructive on small caps
P&L for whale: Both puts expire worthless. Loss = -$12.6M (-100%).
Why 40%: The underlying trend favors IWM. The Russell 2000 trades at an 18x forward P/E vs 25x for the S&P 500 -- the valuation gap supports continued rotation. Plus, the options market's own put/call ratio of 3.19 on volume suggests extreme hedging activity, which can be contrarian bullish -- when everyone is hedged, there is less forced selling when bad news hits.
🎯 Base Case -- Partial Move (35% probability)
IWM: $253-$260
The "close but not enough" scenario:
- 📊 PCE comes in slightly hot (core PCE at 2.3-2.5%), triggering modest selling
- 📉 IWM pulls back 1-3% to the $253-$257 range on data jitters
- 🏭 ISM Manufacturing dips back below 50, calling the recovery into question
- ⚖️ Tariff headline risk creates choppy price action but no sustained selloff
- 📊 IWM tests the $257 gamma level (most negative net GEX on the board) but finds buyers
P&L for whale at $255: Long $255 put is at-the-money (worth ~$0), short $246 put worthless. Near breakeven to small loss. P&L for whale at $253: Long $255 put worth $2, short $246 put worthless. Profit = $2 x 79,500 x 100 = $15.9M - $12.6M = +$3.3M gain.
Why 35%: A 2-3% pullback in 11 days is well within normal volatility for IWM (18.7% annualized vol). The data calendar creates enough event risk to push IWM lower, but the structural rotation bid may limit the downside.
📉 Bear Case -- Whale Wins Big (25% probability)
IWM: $246 or below
How the whale hits the jackpot:
- 🔥 Tomorrow's PCE surprises sharply to the upside (core PCE >2.5%), forcing the market to reprice rate cuts entirely
- 📉 February jobs report (March 6) shows labor market deterioration, reviving recession fears (Goldman at 20%, RSM at 30%)
- 🏭 ISM Manufacturing reverts below 50, confirming the January reading was a tariff-driven aberration
- ⚖️ Tariff escalation -- Trump raises the 10% universal tariff to 15% or announces sector-specific levies
- 💀 Small-cap balance sheet fears resurface -- ~40% unprofitable constituents and $368B in debt maturing in 2026 become headline risk
- 📊 IWM breaks through $257 negative gamma zone, triggering dealer selling that accelerates the decline through $255, $250, and toward $246
- 📉 Fund outflows intensify -- IWM has already seen $2.93B in net outflows over the trailing month despite the rally
P&L for whale at $246: Full max profit. $9 x 79,500 x 100 = $71.55M - $12.6M = +$58.95M gain (468% ROI). P&L for whale at $250: $5 x 79,500 x 100 = $39.75M - $12.6M = +$27.15M gain (215% ROI).
Why 25%: A 5.5% decline in 11 days is possible but requires multiple negative catalysts to stack. The negative gamma structure below price (dealer selling amplifying any downturn) increases the probability of a fast move once $257 breaks. The elevated put/call ratios (OI: 2.61, Volume: 3.19) and persistent fund outflows (-$8.61B/year) suggest institutional skepticism is already present beneath the surface of the +8% YTD rally.
💡 Trading Ideas
🛡️ Conservative: "Hedge Your Small-Cap Exposure" -- Protective Put Spread
Play: Buy IWM March 20 $257 puts, sell IWM March 20 $250 puts
Why this works:
- 🛡️ If you own IWM or small-cap stocks, this protects against a 1.5-5.7% decline through March OPEX
- 📊 The $257 strike is right at the most negative net gamma level on the board -- this is where dealer selling would accelerate a move lower
- 💰 $7 spread width, estimated cost ~$1.50-$2.00 per spread. Max profit = $5.00-$5.50 per spread if IWM hits $250
- ⏰ 21 days to March OPEX gives more time than the whale's 11-day window -- captures both the March data dumps AND pre-FOMC positioning
- 📈 Implied move lower bound for March OPEX is $250.76 -- the $250 short put aligns perfectly
- 🎯 Risk/reward roughly 3:1
Position sizing: For every $50,000 in small-cap exposure, consider 2-3 spreads (~$300-$600 in premium). Think of this as portfolio insurance.
Risk level: LOW (defined risk, protective) | Skill level: Beginner-Intermediate
⚖️ Balanced: "Follow the Whale at a Fraction of the Cost" -- Narrower Bear Put Spread
Play: Buy IWM March 20 $258 puts, sell IWM March 20 $253 puts
Why this works:
- 📊 Same directional thesis as the whale but with a higher probability of profit -- the long $258 put is only 1.1% OTM vs the whale's 2.1% OTM
- ⏰ March 20 expiry gives 10 extra days beyond the whale's March 10 deadline -- capturing CPI (March 12) and pre-FOMC (March 17-18) risk
- 💰 $5 spread width at roughly $1.00-$1.50 net debit. Max profit = $3.50-$4.00 per spread
- 📊 Breakeven at roughly $257 -- right where the whale's gamma data shows the most negative net GEX
- 🎯 Risk/reward roughly 2.5-3:1
- 📈 The monthly implied move range ($250.76 - $271.66) suggests the $253-$258 zone is well within the expected distribution
Position sizing: 10-20 spreads at ~$125 each = $1,250-$2,500 at risk for $3,750-$8,000 max profit. Appropriate for directional conviction at moderate scale.
Risk level: MODERATE (defined risk, directional) | Skill level: Intermediate
🚀 Aggressive: "Full Conviction Bear" -- Near-Term OTM Put
Play: Buy IWM March 10 $257 puts outright (same expiration as the whale)
Why this works (and why it is risky):
- 💥 Pure directional bet on a near-term pullback -- maximum leverage, maximum time decay exposure
- 📊 $257 is closer to the money than the whale's $255, giving higher delta and greater responsiveness to any move lower
- ⏰ Only 11 days to expiration -- if you are right, time compression works in your favor (gamma increases as expiry approaches, amplifying any favorable move)
- 💰 Estimated cost ~$1.50-$2.00 per contract. If IWM drops to $253, these could be worth ~$4.00+ (100%+ return)
- 📈 Tomorrow's PCE release is a near-immediate catalyst that could move IWM $3-5
Why it could blow up:
- ⏰ 11 days means time decay is savage -- you lose roughly $0.15-$0.20 per day just sitting there
- 📉 IWM needs to drop 1.5%+ just to reach the strike, and 3%+ to meaningfully profit
- 📈 The "Great Rotation" trend favors small caps -- you are fighting the prevailing narrative
- 🎢 A positive PCE surprise tomorrow could kill this trade in a single session
Position sizing: Risk ONLY what you can afford to lose completely. 10 contracts at ~$175 each = ~$1,750 at risk. This is a speculative position, not a core holding.
Risk level: HIGH (can lose 100% rapidly) | Skill level: Advanced
⚠️ Risk Factors
Considerations before following this whale into a bearish IWM bet:
-
📈 You are betting against the prevailing trend. The "Great Rotation" has seen the Russell 2000 outperform the S&P 500 by ~4% in 2026, with a historic 15-session winning streak against large caps. Multiple major banks (Goldman, BofA, JPM) remain constructive. Fighting momentum is always risky.
-
⏰ 11 days is an extremely tight window. A move of 5.5% in under two weeks requires a meaningful catalyst. While the data calendar is heavy (PCE, ISM, jobs), there is no guarantee any single release triggers the kind of selloff this trade needs. Time decay erodes the position every day.
-
📊 This could simply be a portfolio hedge, not a directional bet. An institution with billions in long equity exposure often buys downside protection as insurance -- they EXPECT to lose the premium and consider it a cost of doing business. Reading too much directional conviction into a hedge trade is a classic retail mistake.
-
💰 Small-cap valuations support the bull case. Russell 2000 trades at just 18x forward P/E vs 25x for the S&P 500 -- a 25-31% discount. Projected 18-22% earnings growth exceeds large caps. The fundamental story has not broken down.
-
🏦 Rate cut expectations still favor small caps. With two cuts priced for 2026 and the first most likely at the June meeting, the interest rate backdrop remains supportive. Each cut reduces the floating-rate debt burden for the ~40% of Russell 2000 constituents that are currently unprofitable.
-
💀 BUT: structural risks are real. Approximately 40% of Russell 2000 companies are unprofitable, 25% are zombie companies (operating income cannot cover interest), and $368B in debt matures in 2026. A macro shock could expose these vulnerabilities quickly.
-
📉 Fund flows diverge from price. Despite the +8% rally, IWM has seen $2.93B in outflows over the past month and $8.61B over the past year. The elevated put/call ratios (OI: 2.61, Volume: 3.19) show institutional hedging activity remains intense. This divergence can resolve in either direction -- it could mean the market is overly hedged (contrarian bullish) or that smart money is quietly positioning for a downturn.
-
🏭 ISM manufacturing expansion may be hollow. The January 52.6 reading may have been inflated by tariff-driven frontloading. Employment (48.1) and inventories (47.6) subindices remained in contraction. The February reading on March 3 is a key test -- a reversion below 50 would undermine the Industrials sector narrative (18.1% of the index).
🎯 The Bottom Line
Here is the situation: An institutional player just committed $12.6 million to a bet that IWM drops at least 5.5% in 11 calendar days. With 79,500 contracts representing $2.08 billion in notional exposure, this is one of the largest bearish small-cap options trades of the year. The max payout of $71.6 million on a $12.6M outlay represents a 5.7:1 reward-to-risk -- the kind of asymmetric payoff that sophisticated macro funds look for when hedging tail risk.
What this trade tells us:
- 🎯 Someone with serious capital sees near-term downside risk in small caps that the +8% YTD rally is not adequately reflecting
- ⏰ The March 10 expiration is surgical -- it captures tomorrow's PCE, next week's ISM and jobs data, but expires before the March FOMC can provide a dovish lifeline
- 📊 The $255-$246 strike range targets a 2-5.5% pullback -- not a crash, but a meaningful correction from near-ATH levels
- 📉 The negative gamma structure below price means dealer hedging would amplify any move lower, creating the kind of cascade this trade needs
- ⚠️ This could equally be a portfolio hedge by a fund with billions in long exposure -- the premium represents just 0.6% of the notional exposure, making it cheap insurance
If you are bearish on small caps near-term:
- ✅ The data calendar supports a volatility pick-up: PCE tomorrow, ISM Monday, jobs Friday next week
- 📊 Watch $257 as the trigger level -- the most negative net gamma strike. A close below $257 activates the dealer selling cascade
- 🛡️ Use defined-risk spreads rather than outright puts to manage the aggressive time decay
- 💰 The March 20 expiration gives you more room than the whale's March 10 deadline
If you are long IWM or small caps:
- 🛡️ Consider protective puts or collars -- the elevated put/call ratios mean downside protection is available, though not cheap
- 📊 The $260 gamma support level is your line in the sand. As long as IWM holds above $260, the gamma structure provides a floor
- 📈 The fundamental case (valuation discount, earnings growth, rate cuts) has not changed -- but market positioning suggests caution is warranted near-term
- 💼 The March 6 jobs report is your key data point for the small-cap domestic revenue thesis
If you are on the sidelines:
- 👀 A pullback to $250-$255 would offer a significantly better entry point for the rotation trade
- 📊 Let the data play out -- tomorrow's PCE and next week's ISM/jobs will clarify whether the bull narrative holds
- ⏰ The March 17-18 FOMC with dot plot is the single most important event for small caps in March -- wait for clarity
Key dates to mark:
- 📅 February 28 (TOMORROW) -- PCE Price Index (January) -- Fed's preferred inflation gauge, the first catalyst for this trade
- 📅 March 3 -- ISM Manufacturing PMI (February) -- confirms or denies manufacturing expansion
- 📅 March 6 -- February Jobs Report -- labor market health check
- 📅 March 10 -- THIS TRADE EXPIRES -- moment of truth for the $12.6M bet
- 📅 March 12 -- February CPI -- two days after expiry; the whale may roll if they want continued coverage
- 📅 March 17-18 -- FOMC Meeting + SEP/Dot Plot -- the biggest single event for small caps this quarter
Final thought: A $12.6M bet against the best-performing segment of the US equity market deserves respect but also skepticism. The whale may know something -- perhaps they see the PCE running hot tomorrow, or they have conviction that ISM reverts below 50. Or they may simply be buying insurance on a massive long portfolio and fully expect to lose the $12.6M as a cost of doing business. Either way, the negative gamma structure below IWM's current price means that IF a selloff starts, it will likely accelerate. The question is whether the catalyst arrives within 11 days.
$12.6 million risked for a chance at $71.6 million. That is either a well-informed conviction trade or an expensive insurance policy. Watch the data -- starting with tomorrow's PCE -- to find out which one. 💪
Disclaimer: Options trading involves substantial risk of loss and is not suitable for all investors. This analysis is for educational purposes only and not financial advice. Past performance does not guarantee future results. Bear put spreads are directional strategies that can lose 100% of the premium paid if the underlying does not decline below the breakeven price. The 79,500-contract institutional trade described is not replicable by retail traders at that scale. IWM can experience significant daily moves -- the Russell 2000 is historically more volatile than large-cap indices. Always do your own research and consider consulting a licensed financial advisor before trading.
About iShares Russell 2000 ETF (IWM): The benchmark ETF for US small-cap equities, tracking the Russell 2000 Index with $74.9B in AUM. Managed by BlackRock. IWM provides diversified exposure to approximately 2,000 small-cap US companies across Healthcare (18.8%), Industrials (18.1%), Financials (17.2%), and Technology (~13%), with 77% domestic revenue exposure.