🐋 IWM: Someone Just Closed a $25M Bear Put Spread — Are They Done Being Scared?
📅 March 5, 2026 | 🔥 Unusual Activity Detected
🎯 The Quick Take
Someone just unwound a $25M bear put spread on IWM — selling 48,000 of the $249 puts and buying back 48,000 of the $247 puts, all at once, at the mid-price. That is institutional money removing downside protection on the Russell 2000 just 15 days before Triple Witching, right after tariffs went live and crashed small caps 5%+. Either they think the worst is over, or they are locking in profits from a hedge that already paid off. Either way, $25M in bearish positioning just evaporated from the options market.
📊 About IWM
The iShares Russell 2000 ETF (IWM) tracks the Russell 2000 Index — the benchmark for U.S. small-cap stocks. It holds 1,929 companies across healthcare (17.9%), industrials (16.7%), financials (16.6%), and tech (15.2%). Listed on NYSE Arca, IWM is the most liquid small-cap ETF in the world and a go-to instrument for institutional hedging and macro bets on the U.S. domestic economy. Small caps are extra sensitive to interest rates (45% floating-rate debt), tariffs (import-dependent consumer names), and economic growth expectations.
💰 The Option Flow Breakdown
📊 What Just Happened
Here is the exact tape from our flow scanner:
| Time | Symbol | Side | Buy/Sell | C/P | Strike | Volume | OI | Size | Premium | Spot | Opt Price |
|---|---|---|---|---|---|---|---|---|---|---|---|
| 09:43:34 | IWM | MID | SELL | Put | $249 | 52K | 71K | 48,000 | $13M | $258.83 | $2.80 |
| 09:43:34 | IWM | MID | BUY | Put | $247 | 48K | 37K | 48,000 | $12M | $258.83 | $2.40 |
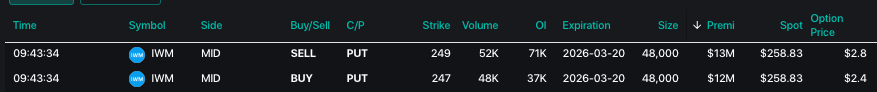
Key details of this trade:
🐋 Size: 48,000 contracts per leg — that is 4.8 million shares of exposure on each side. Definitely not your neighbor Bob's Robinhood account.
💰 Total Premium Moved: $25M combined ($13M + $12M)
💵 Net Credit Received: $0.40/contract x 48,000 = ~$1.9M net credit collected on the unwind
⏰ Execution: Both legs hit simultaneously at the mid-price at 09:43:34 — this is a clean institutional spread closure, not two separate trades
📋 Open Interest Context: The $249 put had 71K OI and the $247 put had 37K OI. A 48K-contract close is eating up 67% of the $249 strike's open interest and 100%+ of the $247 strike's — this is a massive position being removed
🤓 What This Actually Means
Let me break this down in plain English.
This trader previously had a bear put spread: They were long the $249 put and short the $247 put — a bearish bet that IWM would fall below $249 by March 20. The max profit on that spread was $2/contract (the $2 width between strikes), and they held 48,000 of them.
Now they are closing both legs. They sold their $249 puts for $2.80 and bought back their $247 puts for $2.40. The net $0.40 credit means the spread was still worth $0.40 — but both puts are out of the money with IWM at $258.83, so the spread was decaying fast.
Why close now? Three possibilities:
✅ Profit-taking: If they opened this spread when IWM was lower (say around $255-$260 before the tariff selloff), the spread would have expanded in value during the crash. They may have already booked gains and are now closing the residual.
✅ Hedge removal: If this was a portfolio hedge for a long small-cap book, they may believe the tariff shock is priced in and are removing the protection to free up capital.
✅ Thesis change: They no longer expect IWM to drop to $249 before March 20 Triple Witching — essentially, they are saying "the downside move we were worried about either already happened or is not coming."
The signal: An institution removing $25M in bearish positioning is a meaningful shift. This does not mean they are bullish — it means they are less bearish than before. That is a subtle but important difference.
📈 Technical Setup / Chart Check-Up
YTD Price Action
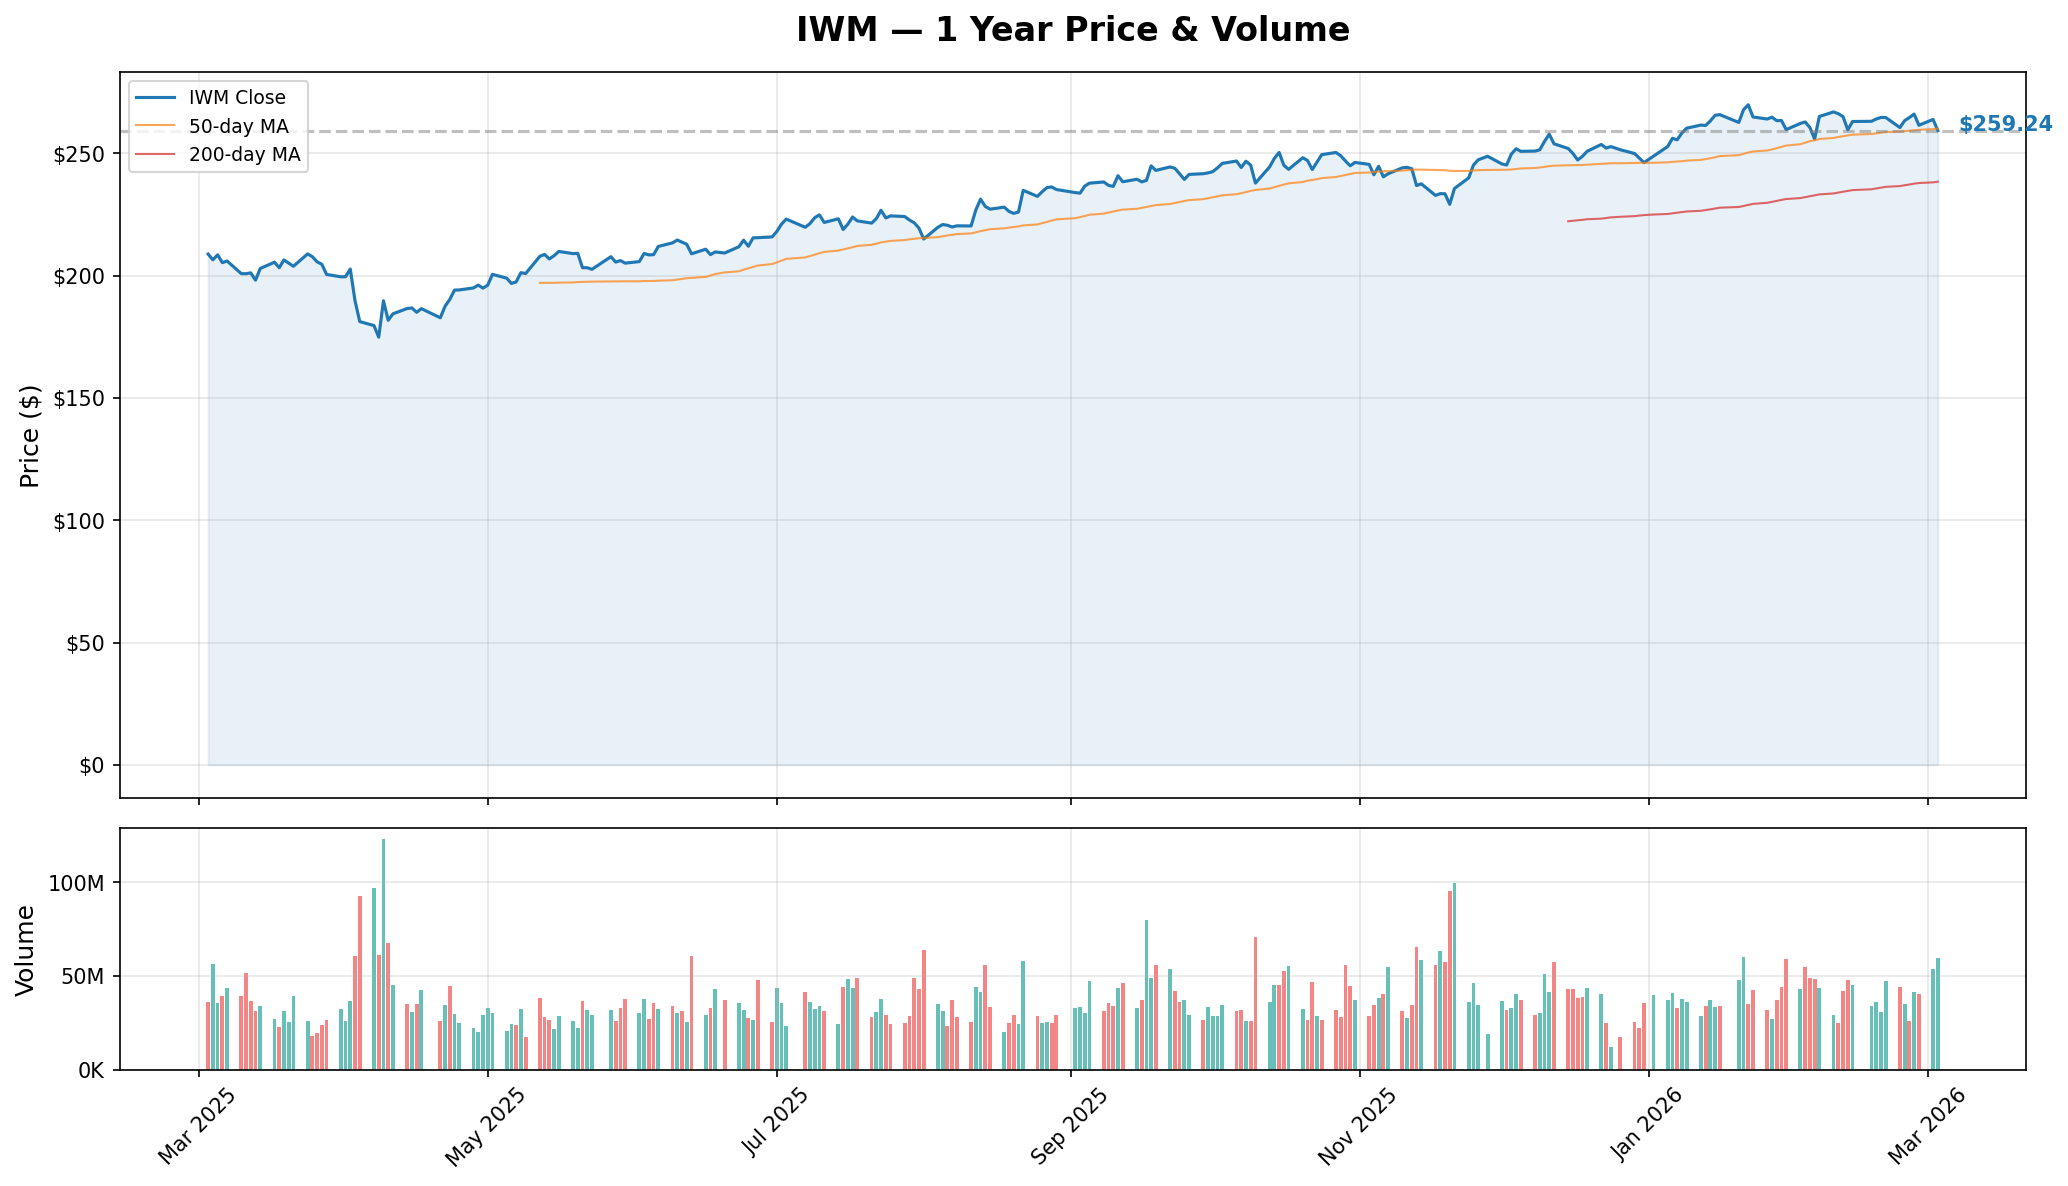
IWM has had a wild ride over the past year. After rallying from the $180s in April 2025 to a 52-week high of $271.60 in late January 2026, the ETF has pulled back sharply. The recent tariff activation on March 4 sent IWM plunging over 5% in a single session.
What the chart tells us:
📉 IWM at $259.24 has broken below both the 20-day SMA ($262.93) and the 50-day SMA ($259.76) — both now acting as overhead resistance
📈 The 200-day SMA (~$243-$248) remains well below, providing a solid floor
🔊 Volume has spiked significantly during the March selloff — institutions are actively repositioning
📊 The dip from the January highs to current levels represents a ~4.6% drawdown from the peak — a normal correction, not a bear market
🔵🟠 Gamma-Based Support & Resistance
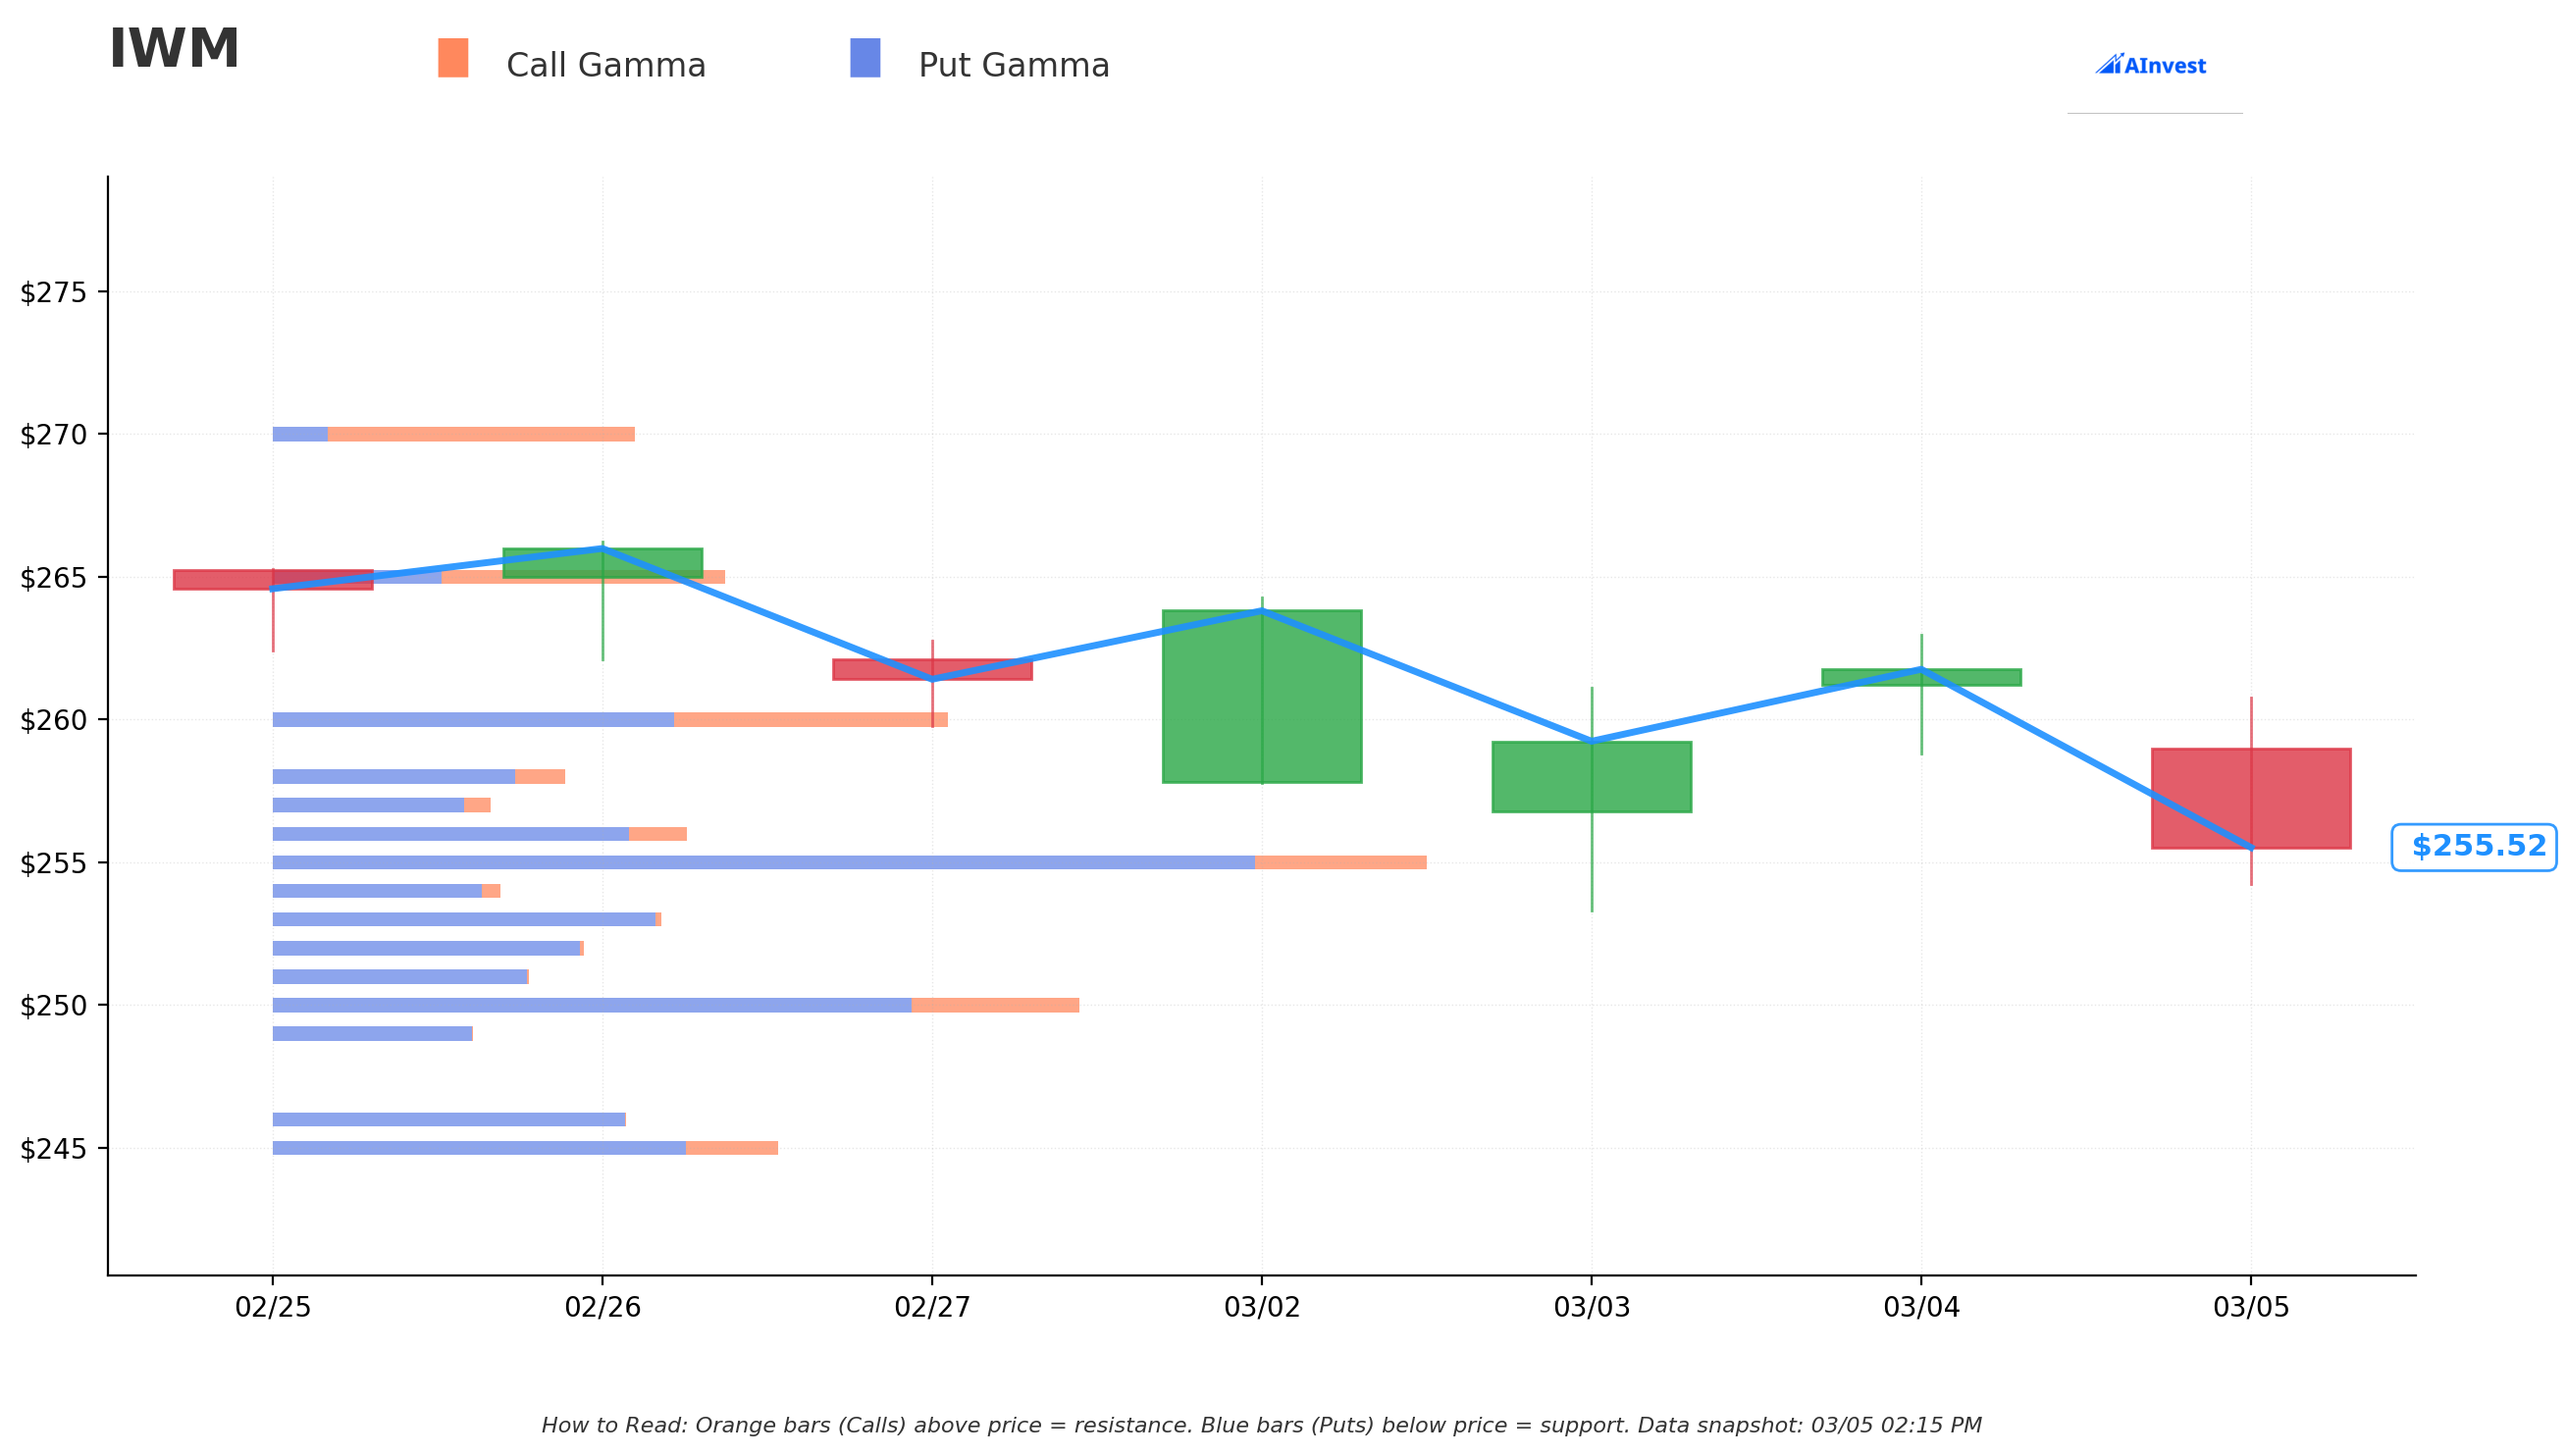
How to read this chart: Orange bars (Call Gamma) above the price represent resistance levels where options dealers would need to sell shares as the price rises. Blue bars (Put Gamma) below the price represent support levels where dealers would need to buy shares as the price falls. Bigger bars mean stronger levels.
Key gamma levels:
🟠 $265 — Major Resistance (Max Gamma Strike). This is where the heaviest options activity is concentrated. The $265 strike is a wall that IWM will struggle to break through without a strong catalyst. This aligns with the 20-day SMA area and represents "full recovery" from the tariff selloff.
🟠 $270 — Secondary Resistance. Call gamma visible at $270 marks the upper boundary. Getting back here would require a tariff de-escalation or a dovish FOMC surprise.
🔵 $255 — Near-Term Support. Heavy put gamma sits right at $255, which lines up with today's intraday lows. This is the first line of defense for the bulls.
🔵 $250 — Critical Support. Strong put gamma at $250 coincides with the heavy institutional put hedging ($19.7M in put buying at $250-$251 strikes, per previous flow analysis). This is a "line in the sand" level.
🔵 $245 — Bear Case Floor. The last major put gamma level, aligning with the 200-day SMA cluster. If IWM reaches here, small caps are in full correction territory.
📐 Implied Move Analysis
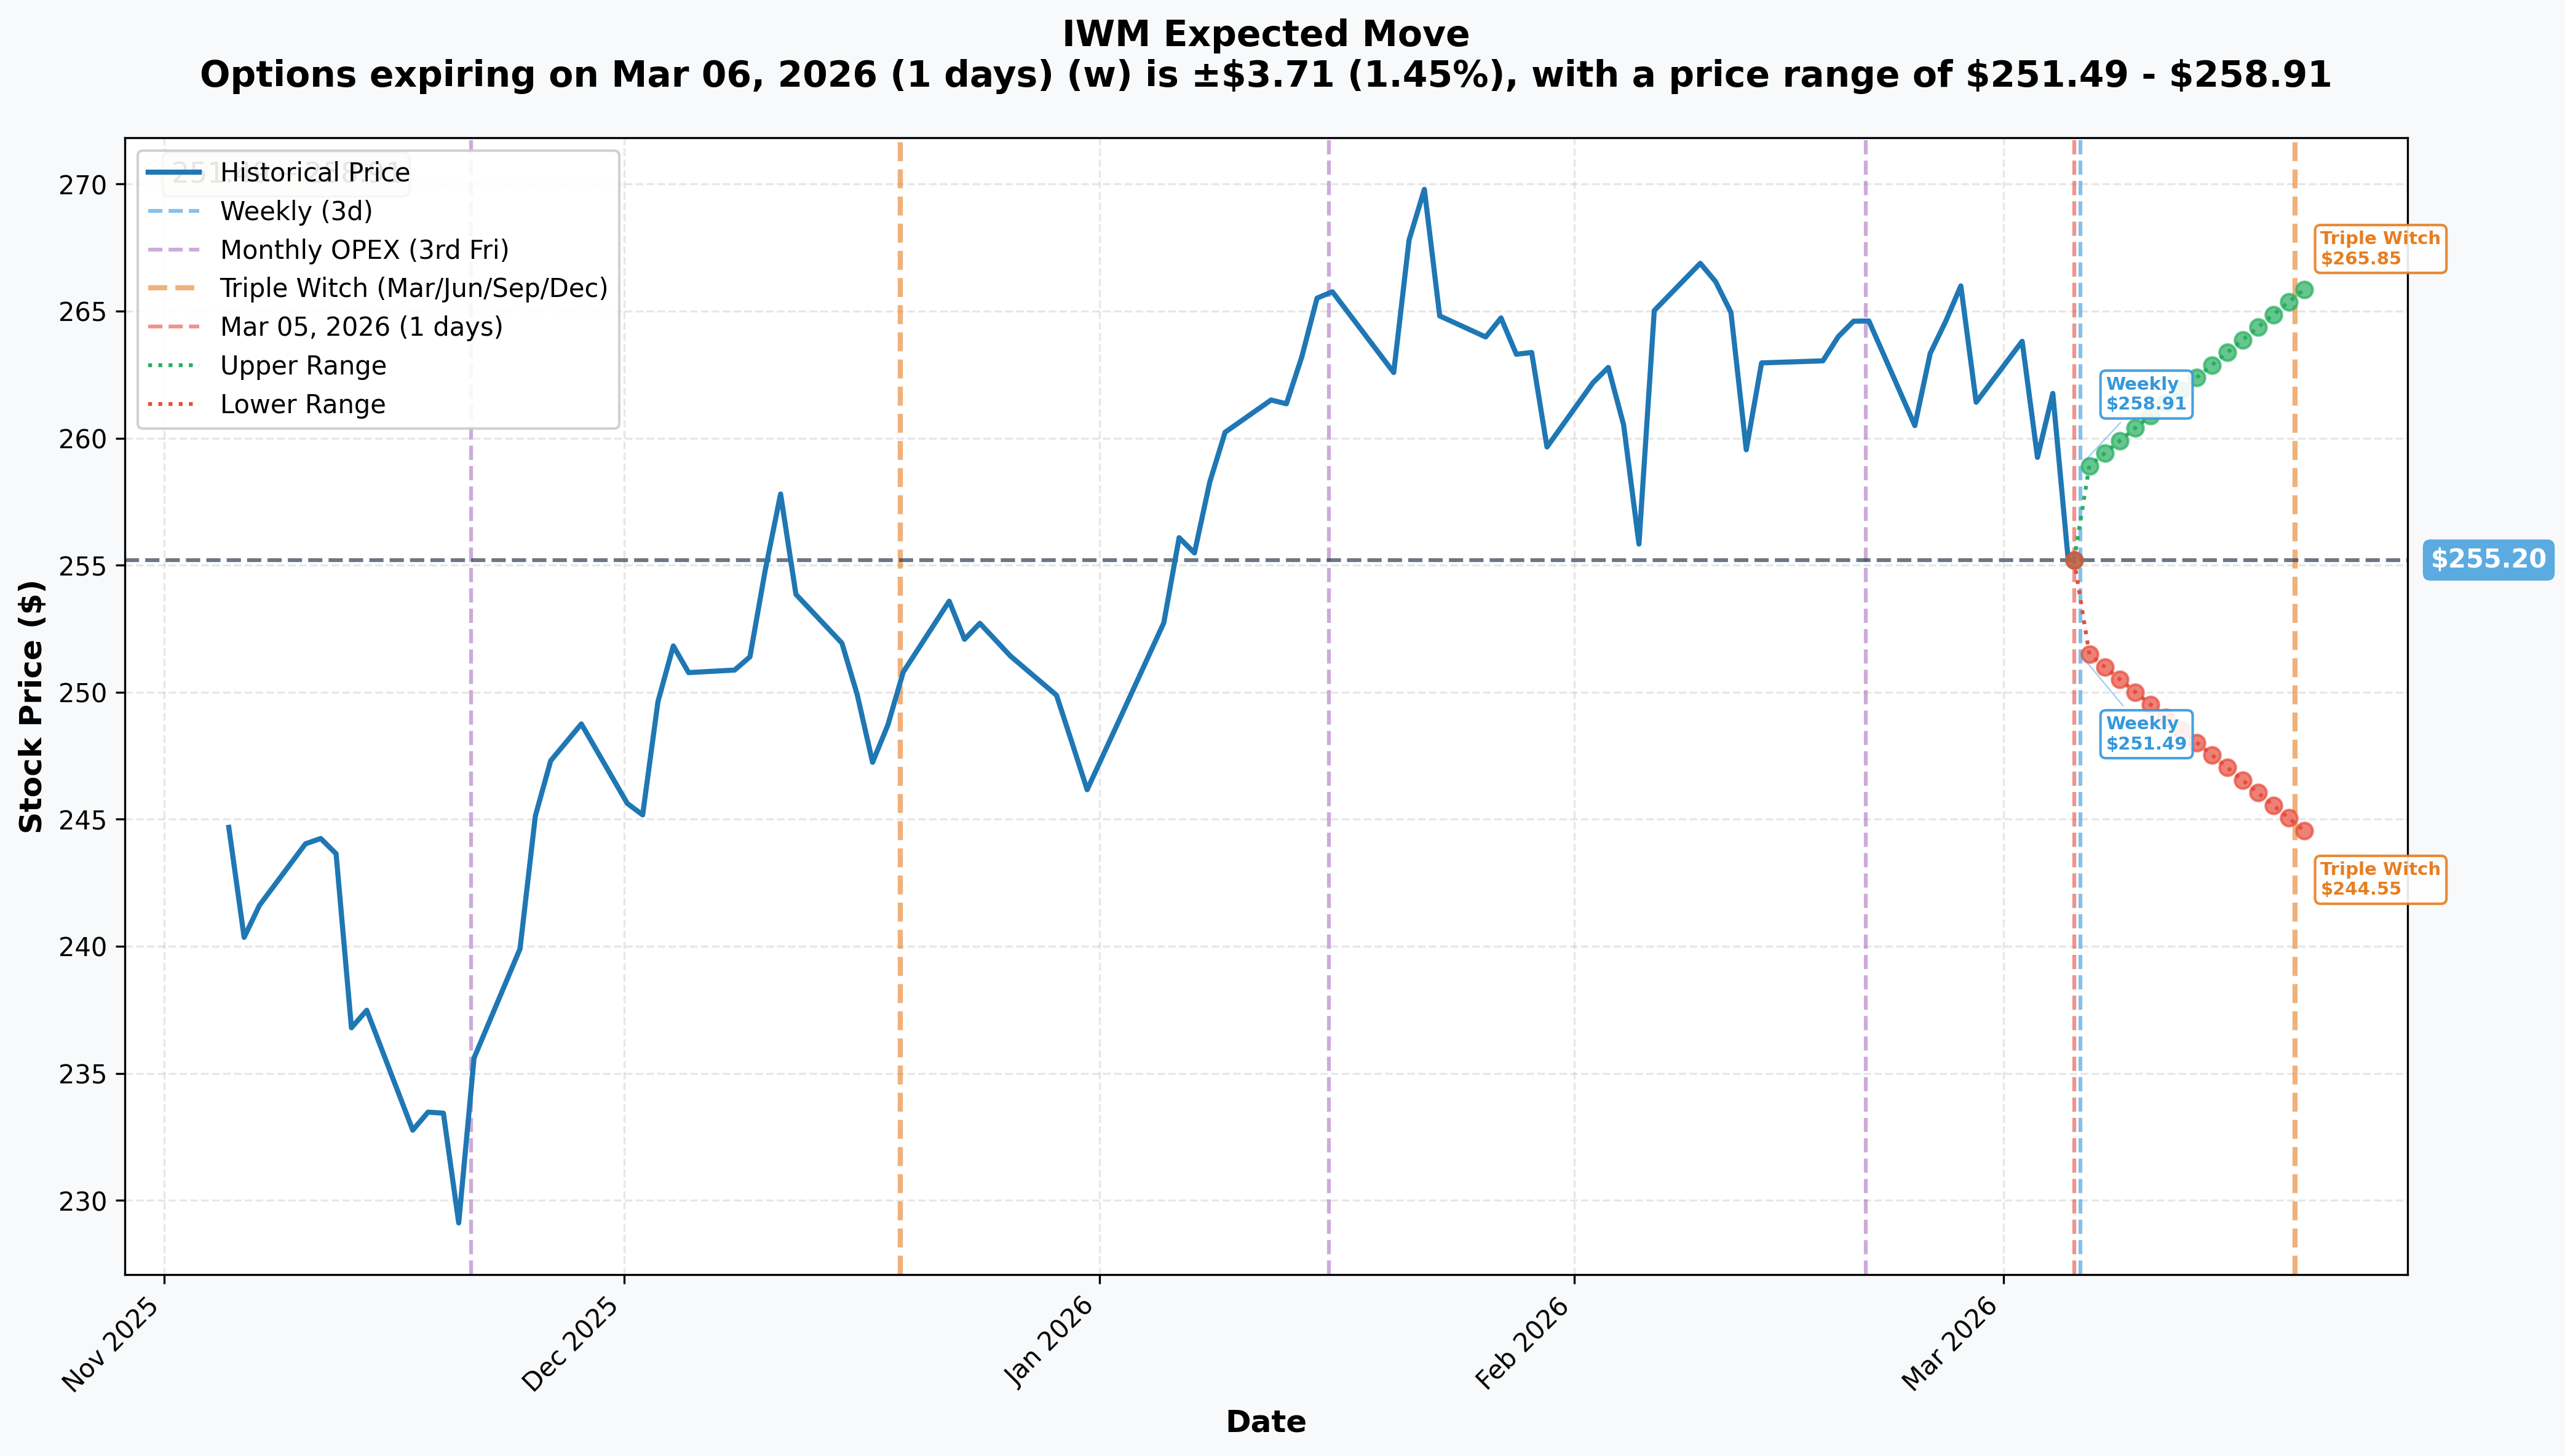
The options market is pricing in significant movement ahead of key catalysts:
📅 Weekly Expiry (March 6 — tomorrow!):
- ⬆️ Upper bound: $258.91 (+1.45%)
- ⬇️ Lower bound: $251.49 (-1.45%)
- Expected range: +/- $3.71 from $255.20
📅 Triple Witch / Monthly OPEX (March 20):
- ⬆️ Upper bound: $265.85 (+4.17%)
- ⬇️ Lower bound: $244.55 (-4.17%)
- Expected range: +/- $10.65 from $255.20
That is a $21.30 expected range for the next 15 days — the market is bracing for a bumpy ride through NFP, CPI, and FOMC. Note that the $249 put strike from today's big trade is well within the implied move range to the downside, meaning the market still sees $249 as a realistic possibility — the trader just does not think it is worth hedging against anymore.
🎪 Catalysts
✅ Already Happened (Priced In)
📋 March 4 — Tariffs Activated: 25% on Canada/Mexico, 20% on China. IWM dropped 5%+. Canada retaliated with tariffs on US$20.6B of American goods, expanding to US$106B in 3 weeks.
📋 March 5 (Today) — ADP Jobs Report: +63K private jobs in February (above 50K forecast). Hiring is "concentrated in only a few sectors" — not exactly a broad recovery.
📋 February 20 — Supreme Court Tariff Ruling: SCOTUS struck down the legal foundation for broad IEEPA tariffs. Over 1,000 companies are suing for refunds of ~$175B. Existing tariffs remain in effect pending lower court rulings.
📋 February 13 — Cooling CPI: Inflation data came in soft, sparking a small-cap rally on rate cut hopes.
🔮 Upcoming (Not Yet Priced)
| Date | Event | IWM Impact | Vol Impact |
|---|---|---|---|
| March 6 | February Nonfarm Payrolls | Weak = bullish (rate cuts). Strong = bearish (higher-for-longer) | HIGH |
| March 11 | February CPI Report | Hot CPI = IWM down. Cool CPI = IWM rally | HIGH |
| March 17-18 | FOMC + Powell Presser | Hold expected at 3.50-3.75%. Dot plot is the real catalyst | VERY HIGH |
| March 20 | Triple Witching OPEX | Quarterly expiration of options + futures. Extreme volume | VERY HIGH |
| ~March 25 | Canada Tariff Expansion | Retaliatory tariffs expand to CA$155B. Any deal = IWM rocket | HIGH |
| Late April | Q1 Earnings Season | Russell 2000 EPS growth estimate ~20% YoY | HIGH |
The catalyst density from now through March 20 is extremely high. We have a major macro data release almost every other day, culminating in the FOMC decision just 2 days before the largest quarterly options expiration of the year.
🎲 Price Targets & Probabilities
Using gamma levels, implied move boundaries, and the catalyst calendar, here are the three scenarios for IWM into March 20 Triple Witching:
🟢 Bull Case: $265 (probability: ~25%)
Target: $265.85 (implied move upper bound / max gamma strike)
What gets us there: Cool CPI on March 11 + dovish FOMC dot plot on March 18 + any tariff de-escalation headlines. The OBBBA tax incentives and reshoring narrative give small caps a fundamental tailwind if macro fears recede. The gamma wall at $265 would act as a magnet once momentum shifts.
Why 25%: Needs multiple catalysts to break right simultaneously. Tariff uncertainty is a heavy anchor.
🟡 Base Case: $255-$260 (probability: ~50%)
Target: Choppy range between put gamma support ($255) and the 50-day SMA ($259.76)
What keeps us here: Mixed economic data, FOMC holds with no dovish surprise, tariff situation stays status quo. Today's big put spread closure supports this — the institution thinks we stay above $249 but is not piling into bullish bets either. The Put/Call OI ratio of 2.61 reflects heavy hedging, which can actually support prices as dealers delta-hedge.
Why 50%: Most likely path given current uncertainty. The market has priced in the tariff shock but has not fully digested the macro calendar ahead.
🔴 Bear Case: $245-$249 (probability: ~25%)
Target: $244.55 (implied move lower bound) to $249 (the put strike being closed today)
What gets us there: Hot CPI on March 11 + hawkish FOMC on March 18 + tariff escalation with Mexico joining Canada. Small caps with 45% floating-rate debt would get crushed by a "higher-for-longer" narrative. The 200-day SMA cluster ($243-$248) would be the next major support.
Why 25%: Requires multiple catalysts to break wrong. The March 2 intraday reversal (3.5% swing) showed strong dip-buying interest.
💡 Trading Ideas
🛡️ Conservative: "The Sleep Well" — Short Put at $245
Strategy: Sell IWM March 20 $245 Put
Why this works: The $245 strike sits at the 200-day SMA and the very bottom of the implied move range. You are betting that IWM does not fall another 5%+ in just 15 days — through a level that held even during the March 4 tariff crash. Today's big trade tells us institutional money is removing puts, not adding them. IV at the 76th percentile means you are getting paid well to sell premium.
Details:
- 📅 Expiration: 2026-03-20 (Triple Witch)
- 💰 Estimated credit: ~$0.80-$1.00/contract
- 🎯 Max profit: Full credit if IWM stays above $245
- ⚠️ Max risk: Assignment at $245 minus credit (you would own IWM at ~$244)
- 📊 Breakeven: ~$244
- 🔑 Margin required: Varies by broker, likely ~$2,400/contract
Best for: Traders who believe the tariff selloff was overdone and IWM holds above its 200-day MA. If assigned, you are buying IWM at a 5.5% discount — not the worst entry.
⚖️ Balanced: "Follow the Whale" — Bull Put Spread $250/$245
Strategy: Sell IWM March 20 $250 Put / Buy IWM March 20 $245 Put
Why this works: You are following the institutional playbook. Today's whale removed their $249/$247 bear put spread — they no longer believe $249 is at risk. This trade puts your short strike at $250 (major put gamma support) and limits risk with the $245 long put at the 200-day SMA. You collect premium from elevated IV while defining your maximum loss.
Details:
- 📅 Expiration: 2026-03-20
- 💰 Estimated net credit: ~$0.50-$0.70/spread
- 🎯 Max profit: Full credit if IWM closes above $250
- ⚠️ Max risk: $5.00 - credit = ~$4.30-$4.50/spread
- 📊 Breakeven: ~$249.30-$249.50
- 🔑 Capital at risk: ~$430-$450 per spread
Best for: Traders who want defined risk and want to align with the institutional signal. The $250 level has $19.7M in put hedging and strong gamma support — if you believe this holds, this is a clean risk/reward.
🚀 Aggressive: "Tariff Bounce" — Call Spread $260/$270
Strategy: Buy IWM March 20 $260 Call / Sell IWM March 20 $270 Call
Why this works: If the big money removing downside protection is right and the tariff shock is priced in, IWM has room to snap back toward its pre-selloff levels. A cool CPI on March 11 or a dovish FOMC on March 18 could send small caps ripping. The $260 call is near the money, and the $270 short call captures the gamma resistance zone. You are paying for a $10-wide bull call spread with 15 days of catalyst density.
Details:
- 📅 Expiration: 2026-03-20
- 💰 Estimated net debit: ~$2.50-$3.00/spread
- 🎯 Max profit: $10.00 - debit = ~$7.00-$7.50/spread (2.5:1 reward-to-risk)
- ⚠️ Max risk: Premium paid (~$250-$300 per spread)
- 📊 Breakeven: ~$262.50-$263.00
- 🔑 Needs: IWM to reclaim the 20-day SMA ($262.93)
Best for: Traders who believe the tariff selloff created a buying opportunity and want leveraged upside exposure. The 2.5:1 reward-to-risk makes this attractive if you think the catalysts break bullish. But this is a directional bet — if IWM stays below $260 into expiry, you lose the full debit.
⚠️ Risk Factors
🔴 Tariff Escalation: Canada's retaliatory tariffs expand to CA$155B (~US$106B) around March 25. If Mexico joins the retaliation or new tariffs are announced, small caps could take another leg down. Consumer cyclical names (9% of IWM) are most exposed.
🔴 Hot CPI on March 11: If February CPI comes in above +0.3% MoM or above 2.5% YoY, the "higher-for-longer" narrative would crush rate-sensitive small caps. With 45% floating-rate debt, even a delayed rate cut is a headwind.
🔴 Hawkish FOMC: The market expects a hold at 3.50-3.75%, but if the dot plot signals no cuts in 2026, IWM could retest the $250 level fast.
🔴 Triple Witching Volatility: March 20 is the quarterly OPEX with simultaneous expiration of stock options, index futures, and index options. Historically this produces extreme volume and wild swings in the final trading hours. Short-dated trades can get whipsawed.
🔴 Supreme Court Tariff Uncertainty: The SCOTUS ruling struck down the legal basis for broad tariffs, but existing tariffs remain in effect during appeals. Lower court timelines are unknown — headline risk could swing IWM in either direction without warning.
🔴 Refinancing Wall: The 2026 small-cap refinancing wall means pandemic-era debt must be rolled over at higher rates. If credit conditions tighten, the weakest Russell 2000 names could face real solvency pressure.
🎯 The Bottom Line
Here is the deal: a major institution just pulled $25M in bearish bets off the table on IWM. That is a meaningful signal — but it is not a screaming "buy" either. They are not loading up on calls; they are just done being scared of a drop below $249.
If you are bullish on small caps: The tariff shock may be priced in, and the OBBBA fiscal tailwinds are real. Consider the balanced bull put spread at $250/$245 or the aggressive call spread at $260/$270. Wait for NFP (tomorrow) to confirm direction before sizing up.
If you are on the fence: Sell premium. IV at the 76th percentile with 15 days to Triple Witch means options are expensive. The $245 short put is a way to get paid to wait while defining your entry point on a pullback.
If you are bearish: Respect the signal. Institutional money is not adding downside protection — they are removing it. The $250 put gamma wall and $245 200-day SMA are strong support. You would need hot CPI + hawkish FOMC + tariff escalation all at once to break those levels.
📅 Mark your calendar: NFP tomorrow (March 6), CPI on March 11, FOMC on March 18, Triple Witching on March 20. This is a four-event gauntlet over the next two weeks — position accordingly and do not oversize any single trade.
The biggest takeaway from today's flow? Fear is being taken off the table, not greed being added. That is an important distinction. Stay nimble.
Disclaimer: This analysis is for educational and informational purposes only. Options trading involves significant risk and is not suitable for all investors. You can lose more than your initial investment. Past performance does not guarantee future results. Always do your own research and consider your financial situation before making any trades. This is not financial advice.
Data sourced from Ainvest options flow scanner, Yahoo Finance, MarketBeat, iShares, and Fintel.