🐻 IWM: $32M Put Spread Lands on Russell 2000 as Small-Caps Reel From Jobs Shock!
📅 March 6, 2026 | 🔥 Unusual Activity Detected
🎯 The Quick Take
Someone just executed a $32M bull put spread on IWM -- selling 45,727 of the $255 puts and buying the same number of $251 puts, all expiring in just 4 days on 2026-03-10. The net credit collected is roughly $8M, and this trade lands the morning after the Russell 2000 dropped 1.9% on a brutal NFP miss of -92,000 jobs. Whether this is a fresh income play or a position close, it tells us one thing: institutional money is betting small-caps hold the $251 floor through next Tuesday.
🏢 ETF Snapshot
iShares Russell 2000 ETF (IWM) -- The most popular way to trade small-cap America. IWM holds roughly 2,000 smaller U.S. companies with market caps typically between $250M and $2B. Think of it as the heartbeat of Main Street businesses -- regional banks, biotech startups, local manufacturers -- the companies most sensitive to interest rates, domestic economic health, and credit conditions.
- 💰 Shares Outstanding: ~283M
- 📊 Exchange: NYSE Arca
- 📈 YTD Return: +4.3%
- 📉 52-Week Range: $174.70 - $269.82
- 🎯 Current Price: ~$252.44 (at time of trade)
💰 The Option Flow Breakdown
📊 The Tape
| Field | Leg 1 (Short Put) | Leg 2 (Long Put) |
|---|---|---|
| 🕐 Time | 10:46:32 AM ET | 10:46:32 AM ET |
| 📌 Ticker | IWM | IWM |
| 📞 Type | PUT $255 (Sell) | PUT $251 (Buy) |
| 🎯 Strike | $255 | $251 |
| 📅 Expiration | 2026-03-10 (4 days!) | 2026-03-10 (4 days!) |
| 📦 Size | 45,727 contracts | 45,727 contracts |
| 💵 Premium | $20M | $12M |
| 🏷️ Execution | BELOW BID (aggressive sell) | ASK (aggressive buy) |
| 📊 Volume / OI | 56,000 / 76,000 | 57,000 / 1,400 |
| 💲 Option Price | $4.40 | $2.60 |
| 🔢 Z-Score | 1.49 (Above Average) | 129.79 (Extremely Unusual) |
| 🧩 Classification | STC -- Closing Put | BTO -- Long Put |
🤓 What This Actually Means
Let me break this down in plain English.
At 10:46 AM, someone walked into the options market and put on a massive two-legged trade -- selling the $255 puts at $4.40 and simultaneously buying the $251 puts at $2.60. Both legs expire next Tuesday, March 10.
Here is what makes this stand out:
✅ The sheer size -- 45,727 contracts on each leg. That is $32M in total premium moving across the tape. The $251 put leg has a z-score of 129.79, meaning its size is roughly 130 standard deviations above average. You see a trade this large only a handful of times per year in IWM options.
✅ Bull put spread mechanics -- By selling the higher-strike $255 put and buying the lower-strike $251 put, the trader collects a net credit of roughly $1.80 per spread ($4.40 - $2.60). Across 45,727 contracts, that is approximately $8.2M in net credit collected upfront. They keep every penny if IWM closes above $255 next Tuesday.
✅ The classification signals a close -- The $255 put leg shows as a "Sell to Close" with existing OI of 76,000 contracts, suggesting this trader may be unwinding an existing short put position. The $251 put leg, however, is "Buy to Open" with a Vol/OI ratio of 40.7x -- basically no prior open interest at that strike. This looks like a partial roll or restructuring of a put position, tightening the range from a wider spread down to the $251-$255 corridor.
✅ Execution urgency -- The short put was filled BELOW the bid (aggressive selling) and the long put was lifted at the ASK (aggressive buying). Simultaneous aggressive fills on both legs tells you this trader wanted this spread now, not later. That is institutional execution, not retail.
✅ 4-day expiration -- With just 4 trading days left, theta decay is working aggressively in the seller's favor. This is a short-term income play -- collect premium, bet on the floor holding, and move on.
What is the real thesis?
This trader is betting that IWM stays above $251 through next Tuesday. If they are right, they pocket the $8M+ net credit. If IWM crashes below $251, they face a maximum loss of roughly $10M ($4 spread width x 45,727 contracts minus the $8M credit = ~$10M net risk). The breakeven is around $253.20 -- just slightly below where IWM is trading right now.
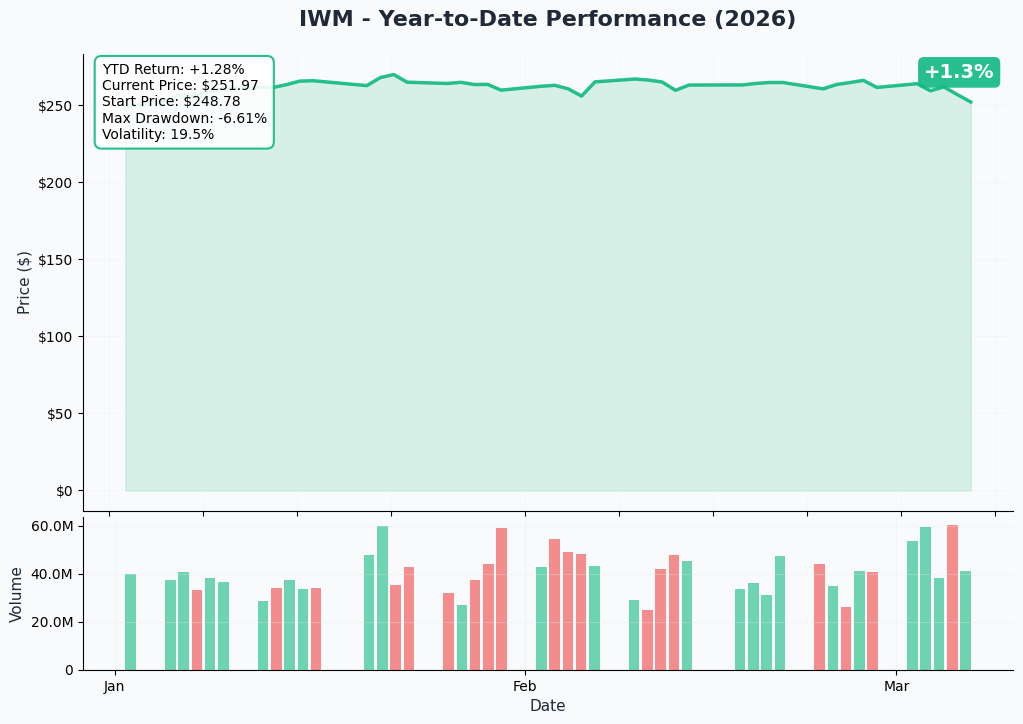
📈 Technical Setup / Chart Check-Up
YTD Chart
IWM has had a choppy 2026 so far. After rallying to $269.82 at its 52-week high, the ETF has pulled back roughly 6.5% to the $252 area, pressured by the February NFP miss (-92,000 jobs), escalating US-Iran tensions driving oil prices higher, and uncertainty around whether the Fed will follow through on additional rate cuts. The recent 1.9% drop on March 5 was the sharpest single-day decline of the year.
Key technical levels to watch:
📈 YTD Return: +4.3% -- Still positive on the year, but fading fast from the early-year highs.
📉 March 5 Selloff: -1.9% -- The biggest one-day drop of 2026, triggered by the jobs report and geopolitical fear. This kind of velocity decline often leads to follow-through selling or a sharp relief bounce -- rarely does the market just sit still afterward.
📊 $254-$256 Zone -- This was acting as a demand zone / technical support heading into this week. The fact that IWM sliced through it on March 5 is concerning. It now flips to overhead resistance.
📈 $246-$250 Zone -- The next major support area if the current level fails. This aligns with the implied move downside (see below).
🔵🟠 Gamma-Based Support & Resistance

How to read this chart: The blue bars (put gamma) below the current price act as support floors -- heavy options activity that tends to slow down declines as dealers hedge. The orange bars (call gamma) above act as resistance ceilings -- strikes where hedging flows can cap rallies. Bigger bars mean stronger levels.
Current Price: ~$251.88
🔵 Support Levels (Put Gamma Below Price):
- $251 -- Strongest immediate support with 143B total gamma exposure. This is the long put strike from today's trade, and heavy put open interest here means dealers are buying shares on dips to stay hedged. This creates a natural floor.
- $250 -- Major structural support with 245B total gamma. The $250 round number is a psychological magnet with massive options positioning. Breaking below here would be a significant technical failure.
- $246 -- Secondary support with 108B gamma. Aligns with the weekly implied move lower bound ($243).
- $245 -- Extended support at 122B gamma. This is the "worst case" zone within the weekly expected move.
- $240 -- Deep floor at 120B gamma. A move here would represent a -5% decline from current levels and would likely trigger broader panic.
🟠 Resistance Levels (Call Gamma Above Price):
- $252 -- Immediate resistance right overhead with 107B gamma. IWM needs to clear this to stabilize.
- $253 -- Strong resistance at 134B gamma. A close above $253 would be the first bullish signal.
- $255 -- Major resistance at 256B gamma -- the single largest gamma concentration on the board. This is the short put strike from today's trade, and it is where the bulls need to reclaim control. Dealer hedging flows make this a tough ceiling in the short term.
- $260 -- Extended resistance at 134B gamma. This is a realistic bull target if small-caps catch a bid from positive macro data.
- $265 -- The only strike with positive net GEX (call gamma > put gamma). Getting here would require a significant risk-on shift.
Net GEX Bias: Bearish -- Total put gamma (2,045B) dwarfs call gamma (619B) by more than 3:1. This means dealer hedging flows are predominantly in the selling direction on rallies and buying on dips, creating a downward-biased environment. Translation: the options market is positioned for more chop and potential downside.
Note: Gamma levels are dynamic and shift as new trades open and close. These levels represent the current snapshot.
📐 Implied Move Analysis

The options market is pricing in the following expected ranges based on implied volatility:
| Timeframe | Expiration | Expected Range | Move % |
|---|---|---|---|
| 📅 Weekly | 2026-03-13 | $243.15 - $259.21 | +/- 3.2% |
| 📅 Monthly / Triple Witch OPEX | 2026-03-20 | $240.45 - $261.91 | +/- 4.3% |
For the March 10 expiration (this trade):
The trade expires before the weekly OPEX date, so the relevant implied range is tighter. But using the weekly +/- 3.2% as a guide:
📉 Implied downside: ~$243 -- The market is pricing in the possibility of a drop to the mid-$240s. The $251 long put on this spread sits well above that level, giving the trader a comfortable buffer. They are NOT trying to survive a worst-case scenario -- they are betting the selloff is overdone.
📈 Implied upside: ~$259 -- A snap-back rally to $259 would be a +2.7% move from current levels. This is where the $255 short put becomes deeply out-of-the-money and the spread expires at max profit.
Key insight: The implied move tells us the market expects IWM could swing roughly $8 in either direction over the next week. The bull put spread's $4 width ($255-$251) sits squarely inside that range, meaning this is a probability trade -- the trader is betting the expected move doesn't fully materialize to the downside.
🎪 Catalysts
✅ Already Happened (Recent)
📉 NFP Miss: -92,000 Jobs (March 5) -- The February non-farm payrolls came in horrifically below expectations, marking the worst jobs report since the pandemic era. Recession fears surged immediately, hammering small-caps the hardest since they are most sensitive to domestic economic health.
📉 Russell 2000 Dropped 1.9% on March 5 -- The sharpest single-day decline of 2026. Small-caps led the broad market lower as rate-sensitive sectors sold off on the combination of weak jobs data and rising energy costs.
🌍 US-Iran Tensions Escalating -- Geopolitical conflict has driven oil prices higher, squeezing margins for the small-cap companies that make up the Russell 2000. Energy cost inflation is especially painful for smaller businesses with less pricing power.
✂️ Three Rate Cuts in Late 2025 -- The Fed cut rates to 3.50-3.75%, fueling the "Great Rotation" trade from mega-cap tech into small-caps. But now the question is whether further cuts are on hold due to inflation pressures.
📈 YTD Performance Still Positive (+4.3%) -- Despite the recent pullback, IWM is still green on the year, supported by the broader rotation thesis and 15% projected earnings growth for Russell 2000 companies in 2026.
📅 Upcoming
| Date | Event | Why It Matters |
|---|---|---|
| March 10 | This spread expires | 4-day countdown -- will IWM hold above $251? |
| TBD (March) | February CPI Data Release | Key inflation reading. Hot CPI = rate cuts delayed = small-cap pain. Cool CPI = rate cuts back on = small-cap relief rally |
| March 17-18 | FOMC Meeting | Fed expected to hold at 3.50-3.75%. The statement and dot plot will signal whether more cuts are coming or if the pause extends |
| March 20 | Triple Witch OPEX | Quarterly options/futures expiration. Massive gamma unwind could trigger outsized moves in either direction |
| Ongoing | US-Iran Conflict | Escalation drives oil higher, squeezing small-cap margins. De-escalation would be a massive relief catalyst |
| Ongoing | Tariff Policy | Further escalation disproportionately hurts small-caps with domestic supply chains affected by input cost inflation |
🎲 Price Targets & Probabilities
Based on gamma levels, implied move data, technical analysis, and the catalyst calendar:
🐻 Bear Case: $243-$246 (-3.5% to -2.5%)
📉 If the March 5 selloff was just the beginning -- CPI comes in hot, the Fed signals a prolonged pause, and US-Iran tensions escalate further -- IWM could slide to the weekly implied move lower bound at $243. The gamma support at $246 and $245 would provide speed bumps on the way down, but a break below $250 (the massive 245B gamma level) would likely accelerate the decline.
For the spread trade: This is the disaster scenario. IWM below $251 means the trader faces partial to full losses on the spread. Below $251, the max loss is roughly $10M.
Probability: ~25% -- Requires compounding negative catalysts (hot CPI + Fed hawkishness + geopolitical escalation all at once). The strong $250-$251 gamma support makes a crash below $243 unlikely without a major shock.
⚖️ Base Case: $250-$255 (roughly flat)
📊 IWM chops around the $250-$255 range through next Tuesday as the market digests the NFP miss and waits for CPI and FOMC for clearer direction. The massive gamma concentration at $250 and $255 creates a "pinning" effect where dealer hedging keeps the stock range-bound. The 1.9% drop on March 5 was a sentiment shock, and these tend to mean-revert within 3-5 days as volatility sellers step in.
For the spread trade: This is the most likely outcome and it is favorable. If IWM stays above $253.20 (the breakeven), the trader profits. Above $255 and they keep the full $8M+ credit.
Probability: ~50% -- The most likely scenario. Range-bound action with gamma walls on both sides.
🚀 Bull Case: $258-$262 (+2% to +4%)
📈 A cool CPI print reignites rate cut expectations, or a de-escalation in US-Iran tensions sparks a risk-on rally. Small-caps snap back aggressively, clearing the $255 gamma resistance and pushing toward $260. The "Great Rotation" thesis -- money flowing from mega-cap tech into small-caps -- reasserts itself.
For the spread trade: This is the dream scenario. The spread expires deep out-of-the-money and the trader keeps the entire $8M+ credit.
Probability: ~25% -- Requires a positive catalyst (cool CPI, dovish Fed leak, or geopolitical de-escalation) to break the current negative momentum.
💡 Trading Ideas
🛡️ Conservative: "The Theta Collector" -- Bull Put Spread
Structure: Sell IWM $248 put / Buy IWM $244 put, 2026-03-20 expiration (Triple Witch)
Why this works: You collect premium by betting IWM does NOT fall below $248 by Triple Witch OPEX -- a level that sits below the $250 mega-gamma support and the weekly implied move lower bound of $243. The massive put gamma wall at $250 gives you a natural cushion. Triple Witch expiration means elevated premium to sell.
📊 Estimated credit: ~$0.80-$1.20 per spread 📊 Max risk: ~$2.80-$3.20 per spread 📊 Max profit: Credit collected (if IWM stays above $248) 📊 Win probability: ~70-75% 📊 Best for: Traders who think the selloff is overdone and want to collect premium with a comfortable margin of safety below the gamma support.
⚖️ Balanced: "The Bounce Play" -- Call Debit Spread
Structure: Buy IWM $253 call / Sell IWM $260 call, 2026-03-20 expiration
Why this works: If you think the NFP-driven selloff creates a mean-reversion opportunity, this spread profits from a snap-back rally toward the $255-$260 gamma resistance zone. The $253 strike sits just above current price, and the $260 short call caps your upside at a realistic target. You benefit from the post-selloff IV crush as well.
📊 Estimated cost: ~$2.00-$2.80 per spread 📊 Max profit: $7 per spread minus debit (roughly $4.20-$5.00) 📊 Breakeven: ~$255-$256 📊 Risk/reward: ~1:2 📊 Best for: Traders who see the $251 gamma support holding and want to ride a recovery into Triple Witch OPEX.
🚀 Aggressive: "Fade the Fear" -- Short Put
Structure: Sell IWM $250 put, 2026-03-13 weekly expiration
Why this works (and why it is risky): The $250 strike sits right on top of the strongest gamma support level (245B total gamma). You collect premium from elevated post-selloff IV and bet that the massive options positioning at $250 acts as a floor. Weekly expiration means rapid time decay in your favor -- every day that IWM stays above $250, your put loses value fast.
📊 Estimated credit: ~$2.50-$3.50 per contract 📊 Max profit: Credit collected (if IWM stays above $250) 📊 Margin requirement: ~$5,000 per contract (broker-dependent) 📊 Break even: ~$246.50-$247.50
Why it could blow up:
- 💸 Selling naked puts has unlimited downside risk to zero (though IWM going to zero is... unlikely)
- 📉 If CPI comes in hot or another geopolitical shock hits, $250 could break
- 🎢 A break below $250 would likely cascade to $245-$246 quickly as gamma support unwinds
📊 Best for: Experienced traders with sufficient margin who are confident in the $250 floor. Not for beginners. Size conservatively -- one contract controls $25,000 of IWM exposure.
⚠️ Risk Factors
❗ Recession Signals Flashing -- The -92,000 NFP print is not a one-off data point. If follow-up economic indicators (jobless claims, ISM, consumer confidence) confirm a deteriorating labor market, small-caps will bear the brunt. Russell 2000 companies have over 2x the leverage of large-caps, with 32% floating-rate debt vs just 6% for the S&P 500. A recession hits them first and hardest.
❗ CPI Timing Risk -- February CPI data is imminent. If inflation is running hotter than expected -- particularly due to energy price spikes from the US-Iran conflict -- the Fed's rate cut path gets derailed. Small-caps are the most rate-sensitive part of the equity market. Hot CPI = rate cuts delayed = IWM under pressure.
❗ Geopolitical Wildcard -- The US-Iran conflict is driving oil prices higher, which directly squeezes margins for smaller companies with less pricing power. An escalation could send energy costs surging further, while a de-escalation would be an instant relief catalyst. This is binary and unpredictable.
❗ Floating-Rate Debt Exposure -- With 32% of Russell 2000 debt tied to floating rates, every basis point matters. Even with rates at 3.50-3.75% (down from the 2023-2024 peaks), small-cap interest expense remains elevated. A pause in rate cuts keeps this headwind in place.
❗ Triple Witch Approaching (March 20) -- Quarterly options and futures expiration is just two weeks away. The gamma unwind around Triple Witch can trigger outsized, unpredictable moves in either direction. For this specific spread expiring March 10, the Triple Witch dynamics should not matter directly -- but the positioning ahead of it could create unusual volatility.
❗ Tariff Escalation Risk -- Further tariff developments disproportionately hurt small-caps. While they have more domestic exposure than multinationals, input cost inflation from tariffs still filters through to smaller businesses with thinner margins.
❗ This Spread Expires in 4 Days -- Time compression means gamma risk is extreme. Small moves in the underlying translate to large swings in P&L. A 2% move in IWM by Tuesday could be the difference between full profit and full loss on this spread.
🎯 The Bottom Line
Here's the deal: A major player just put on a $32M put spread on IWM with only 4 days to expiration. They are collecting roughly $8M in net credit and betting the Russell 2000 does not collapse below $251 by next Tuesday. This is a short-term, high-conviction bet that the March 5 selloff was overdone -- or at least that the $250-$251 gamma wall will hold as a floor.
The context is important. Small-caps just had their worst day of 2026. NFP missed by a mile. Oil is rising. The Fed's rate cut path is uncertain. There are plenty of reasons to be nervous. But the options market itself is telling us that $250-$251 is a line in the sand -- the combined gamma exposure at those strikes is enormous, and dealer hedging creates natural buying pressure on any dip to that level.
If you are cautiously bullish on small-caps: The bull put spread below $248 or the call debit spread targeting $260 are the cleanest ways to play a mean-reversion bounce. Wait for CPI data for confirmation, and use the $250 gamma level as your line in the sand. A close above $255 would be the first real bullish signal.
If you are on the sidelines: This is a wait-and-see moment. The February CPI print and the March 17-18 FOMC meeting will determine whether the "Great Rotation" into small-caps is still alive or whether recession fears take over. Mark your calendar for those dates. If IWM holds $250 through this volatility, the risk/reward for a bounce improves dramatically heading into Triple Witch.
If you are bearish: A clean break below the $250 gamma support is your signal. If IWM closes below $250, the next stop is $245-$246 -- and if that fails, $240 is on the table (the weekly implied move lower bound). Put spreads below $248 offer defined-risk bearish exposure.
The next 4 days will tell us a lot about whether the March 5 selloff was a one-day fear event or the start of something bigger. The $32M spread trade suggests someone with real money thinks it is the former. Size your positions accordingly -- small-caps are swinging hard right now, and the gamma environment amplifies every move. 👀
Disclaimer: This analysis is for informational purposes only and does not constitute financial advice. Options trading involves significant risk of loss. Always do your own research and consider your risk tolerance before entering any trade. Past unusual options activity is not a reliable predictor of future stock price movement.
About iShares Russell 2000 ETF: IWM tracks the Russell 2000 Index, providing broad exposure to approximately 2,000 small-cap U.S. equities. It is the benchmark ETF for small-cap investing, with ~283M shares outstanding, listed on NYSE Arca since 2006.