🐂 IWM: $31M LEAP Bull Put Spread Bets Small-Caps Stay Above $210 Through 2028 (2026-03-09)
📅 March 9, 2026 | 🔥 Unusual Activity Detected
🎯 The Quick Take
Someone just put on a $31M bull put spread on IWM using December 2028 LEAPs -- nearly 3 years out. They sold 30,000 contracts of the $210 put for $22M and simultaneously bought 30,000 of the $155 put for $8.9M, collecting a net credit of roughly $13.1M upfront. The max risk on this trade is approximately $152M. This is not a hedge. This is not a short-term income play. This is a massive, long-duration conviction bet that the Russell 2000 stays above $210 -- a level 15% below current price -- for the next 1,011 days. In a week loaded with CPI, FOMC, and a $1.35 trillion debt wall hanging over small-caps, this trader is planting a flag and saying: small-caps survive.
🏢 ETF Snapshot
iShares Russell 2000 ETF (IWM) -- The most liquid ETF tracking the Russell 2000 Index of small-cap U.S. stocks. IWM holds roughly 2,000 smaller companies with market caps typically between $250M and $2B -- regional banks, biotech firms, local manufacturers, and the consumer-facing businesses that form the backbone of Main Street America. It is the market's go-to barometer for domestic economic health and interest rate sensitivity.
- 💰 Total Net Assets: ~$73.95 billion
- 📊 Exchange: NYSE Arca
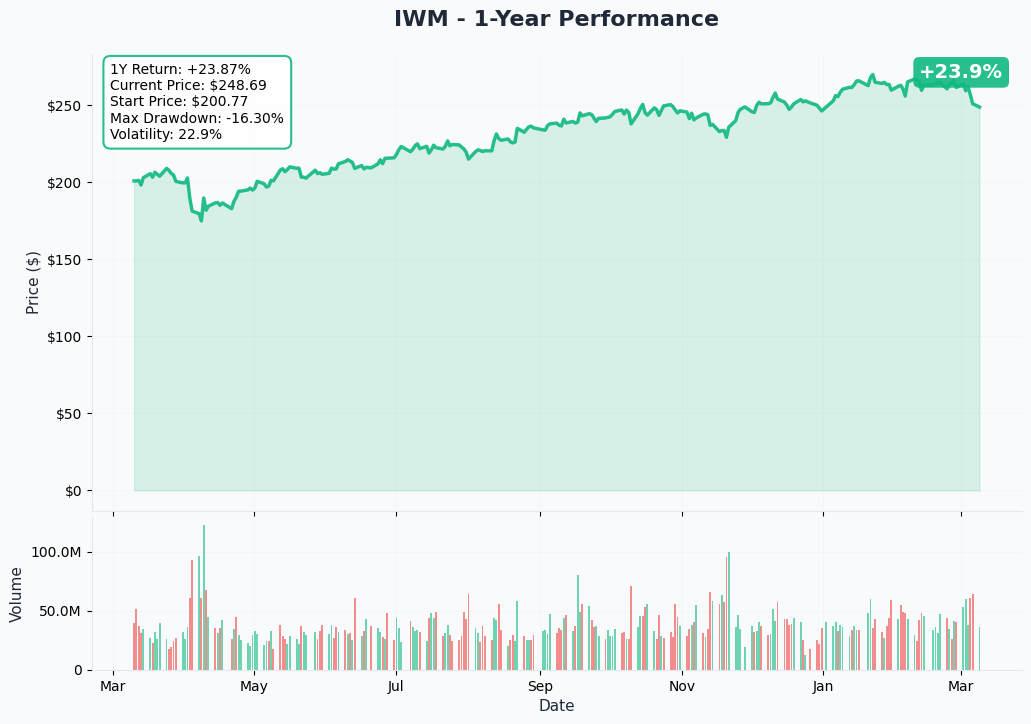
- 📈 YTD Return: +4.34%
- 📉 52-Week Range: $171.73 - $271.60
- 🎯 Current Price: ~$248.21
- 📉 RSI (14): 36.6 -- approaching oversold territory
- 📊 Sector Weightings: Financials ~18.7%, Industrials ~18.3%, Health Care ~16.1%
💰 The Option Flow Breakdown
📊 The Tape
| Field | Leg 1 (Short Put) | Leg 2 (Long Put) |
|---|---|---|
| 🕐 Time | 12:40:37 PM ET | 12:41:01 PM ET |
| 📌 Ticker | IWM | IWM |
| 📞 Type | PUT $210 (Sell) | PUT $155 (Buy) |
| 🎯 Strike | $210 | $155 |
| 📅 Expiration | 2028-12-15 (1,011 days!) | 2028-12-15 (1,011 days!) |
| 📦 Size | 30,000 contracts | 30,000 contracts |
| 💵 Premium | $22M | $8.9M |
| 🏷️ Execution | MID | MID |
| 💲 Option Price | $18.23 | $7.28 |
| 📊 Spot Price | $249.30 | $249.37 |
| 🔢 Z-Score | 0 (New strike, no history) | 0 (New strike, no history) |
| 🧩 Classification | STO -- Short Put | BTO -- Long Put |
🤓 What This Actually Means
Let me break this down in plain English.
At 12:40 PM, someone walked into the LEAP options market and constructed a massive bull put spread -- selling the $210 put and buying the $155 put, both expiring in December 2028. Same size on both legs: 30,000 contracts.
Here is what makes this remarkable:
✅ The duration is extraordinary -- December 2028 is nearly 3 years away. LEAP options this far out are rarely traded in size. When they are, it signals a fundamental macro view, not a tactical swing trade. This trader has a thesis about where small-caps will be in 2028, and they are putting $152M of risk behind it.
✅ Bull put spread mechanics -- By selling the $210 put at $18.23 and buying the $155 put at $7.28, the trader collects a net credit of roughly $10.95 per spread. Across 30,000 contracts, that is approximately $32.85M in notional credit (the $13.1M net premium reflects actual execution prices). They keep every penny if IWM stays above $210 at December 2028 expiration.
✅ The risk/reward profile -- The spread width is $55 ($210 - $155). Maximum loss = ($55 x 30,000 x 100) - credit received = roughly $152M. Maximum profit = the ~$13.1M net credit. That is an asymmetric risk profile -- the trader is accepting large downside exposure in exchange for a high-probability credit. IWM would need to fall 15.3% from current price to even reach the short $210 strike.
✅ The $210 strike is the line in the sand -- Where is $210 in context? IWM's 52-week low is $171.73. Its 200-day SMA sits around $243-$249. The $210 level roughly corresponds to the Russell 2000 revisiting its 2024 trading range. For IWM to close below $210 in December 2028, we would need a recession-level drawdown that persists for nearly three years with no recovery. That is not impossible, but it is a low-probability scenario historically.
✅ The $155 protective put -- The long $155 put defines the max risk. For context, IWM has not traded at $155 since early 2023. This leg is cheap insurance ($7.28 per contract) against a catastrophic scenario -- think 2008-style financial crisis or worse. It caps the trade's losses if small-caps truly collapse.
✅ Zero open interest at both strikes -- Both legs show 0 OI, meaning this is a fresh position, not a roll or close. Someone is opening a brand-new, multi-year conviction trade. The z-scores of 0 reflect the fact that these December 2028 LEAPs have essentially no prior trading history.
What is the real thesis?
This trader believes that over the next 3 years, the U.S. economy avoids a prolonged depression, the Russell 2000 survives its debt maturity wall, and IWM stays above $210. They are willing to risk $152M to collect $13.1M upfront. In annualized terms, that is roughly a 2.9% annual return on max risk -- which sounds low until you realize the implied probability of IWM staying above $210 is north of 85% based on the options market's own pricing. This is a structured credit collection strategy from someone with deep pockets and a multi-year time horizon.
📈 Technical Setup / Chart Check-Up
YTD Chart
IWM has had a volatile 2026. After surging to a 52-week high of $271.60 on January 22, the ETF has pulled back roughly 8.6% to the $248 area. The initial "Great Rotation" thesis -- money flowing from mega-cap tech into small-caps -- hit a wall as the February jobs report (-92,000 payrolls), tariff uncertainty under Section 122, and a $1.35 trillion small-cap debt maturity wall all converged to sour the narrative.
Key technical levels to watch:
📈 YTD Return: +4.34% -- Still positive on the year, but IWM has underperformed the S&P 500 by over 400 basis points since the start of 2026, reversing the early-year outperformance trend.
📉 RSI at 36.6 -- Approaching the oversold threshold of 30. Historically, IWM tends to find short-term bottoms when RSI dips below 30, though in trending selloffs it can stay oversold for extended periods.
📊 MACD at -0.99 -- Firmly bearish. Price is below the 5, 20, and 50-day EMAs. The only bullish structural signal remaining is that price sits above the 200-day SMA around $243-$249.
📉 $243 is the critical level -- If IWM breaks below the 200-day SMA, the long-term uptrend is invalidated and a deeper correction toward $220-$230 becomes plausible. For context, that is still well above the $210 short put strike on today's LEAP trade.
🔵🟠 Gamma-Based Support & Resistance
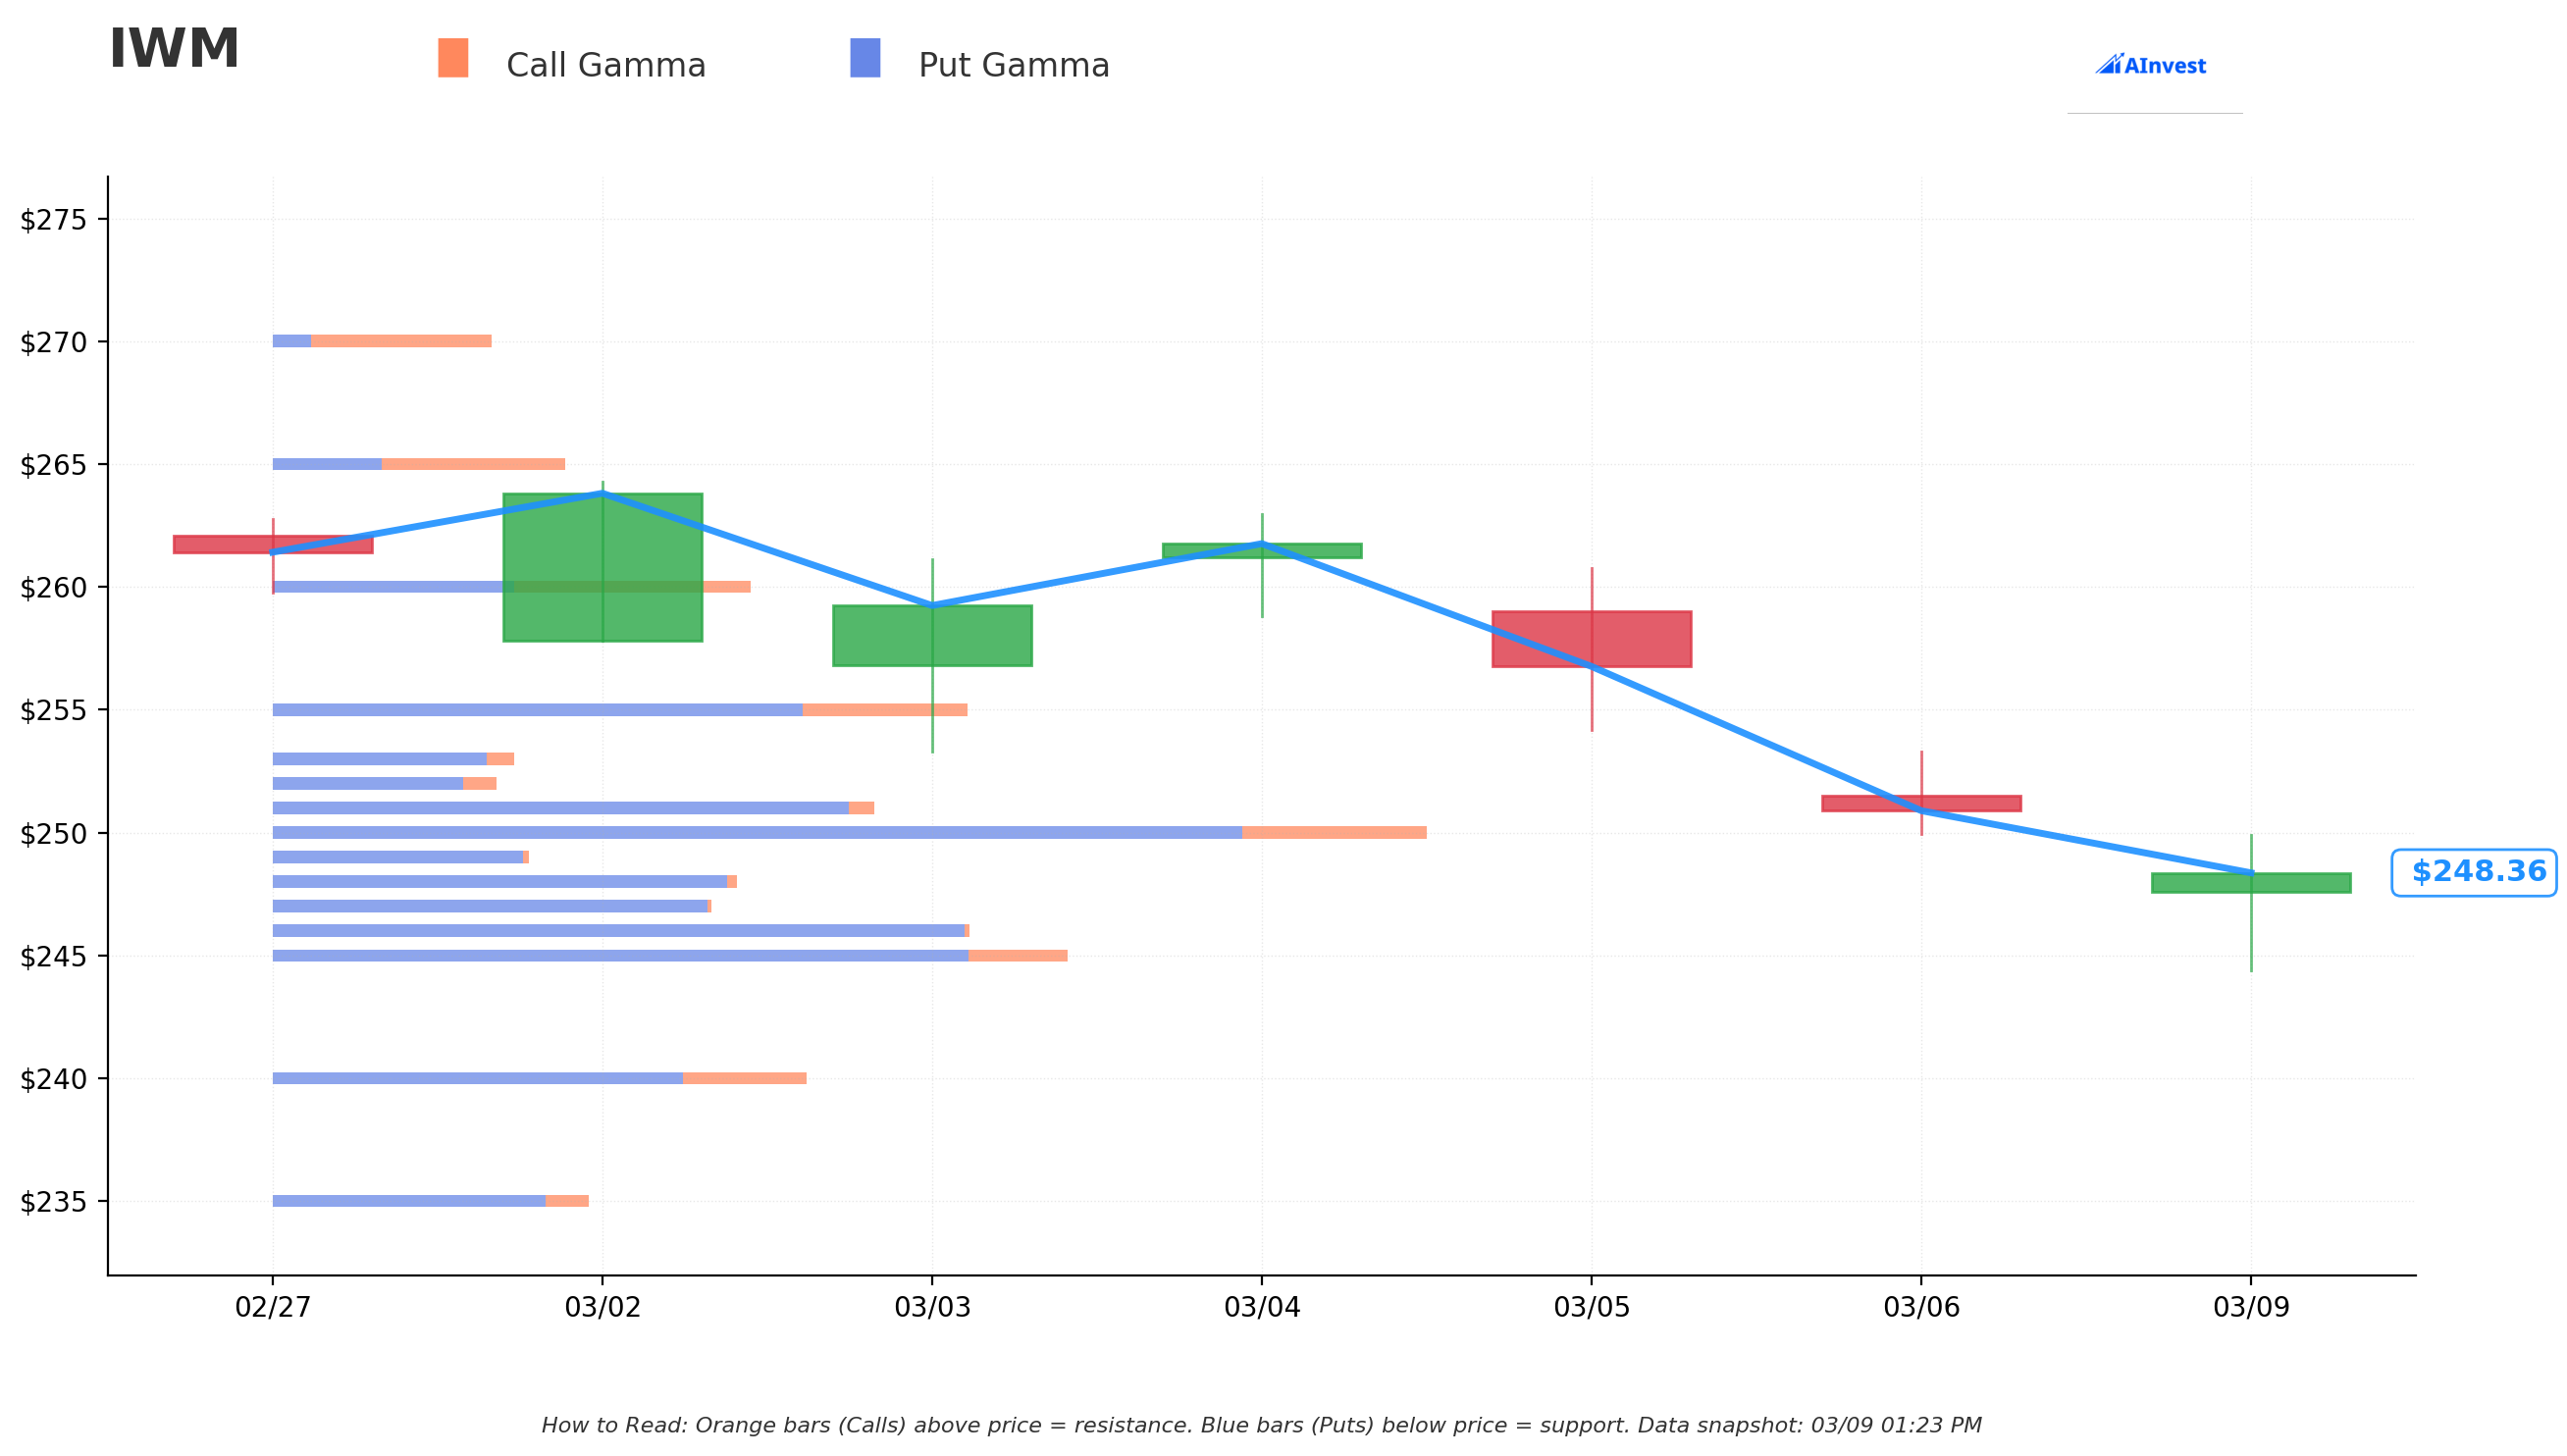
How to read this chart: The blue bars (put gamma) below the current price act as support floors -- heavy options activity that slows declines as dealers hedge. The orange bars (call gamma) above act as resistance ceilings -- strikes where hedging flows cap rallies. Bigger bars mean stronger levels.
Current Price: ~$248.21
🔵 Support Levels (Put Gamma Below Price):
- $248 -- Immediate support with 118.8B total gamma exposure. Dealers are actively hedging here, creating natural buying pressure on dips.
- $247 -- Secondary support at 115.5B gamma. A tight cluster of support below current price.
- $246 -- MASSIVE gamma concentration at 181B total exposure. This is the strongest support zone on the entire board and the most critical level to hold.
- $245 -- Extended support at 205B total gamma. If $246 holds, this acts as a secondary backstop.
- $240 -- Deep floor at 136.8B gamma. A move here represents a -3.3% decline and would signal serious trouble.
- $230 -- Far support at 92B gamma. This is well above the LEAP spread's $210 short strike, providing comfort that there are multiple gamma walls between here and there.
🟠 Resistance Levels (Call Gamma Above Price):
- $250 -- Strongest resistance overhead with 285.8B total gamma. The massive round-number strike is the first hurdle bulls must clear. Dealer hedging flows make this a tough ceiling.
- $251 -- Significant resistance at 149B gamma.
- $255 -- Major resistance at 170B gamma. Reclaiming this zone would signal the correction is ending.
- $260 -- Extended resistance at 120.4B gamma. Nearly balanced call/put gamma here, suggesting a potential breakout level.
Net GEX Bias: Bearish -- Total put gamma (2,140.5B) dwarfs call gamma (574.5B) by nearly 4:1. This means dealer hedging flows are predominantly in the selling direction on rallies and buying on dips, creating a downward-biased environment in the near term. However, this short-term bearish positioning is precisely the backdrop against which the LEAP trader is placing their long-term bullish bet.
Note: Gamma levels are dynamic and shift as new trades open and close. These levels represent the current snapshot and are relevant to short-term trading, not to the multi-year LEAP trade.
📐 Implied Move Analysis
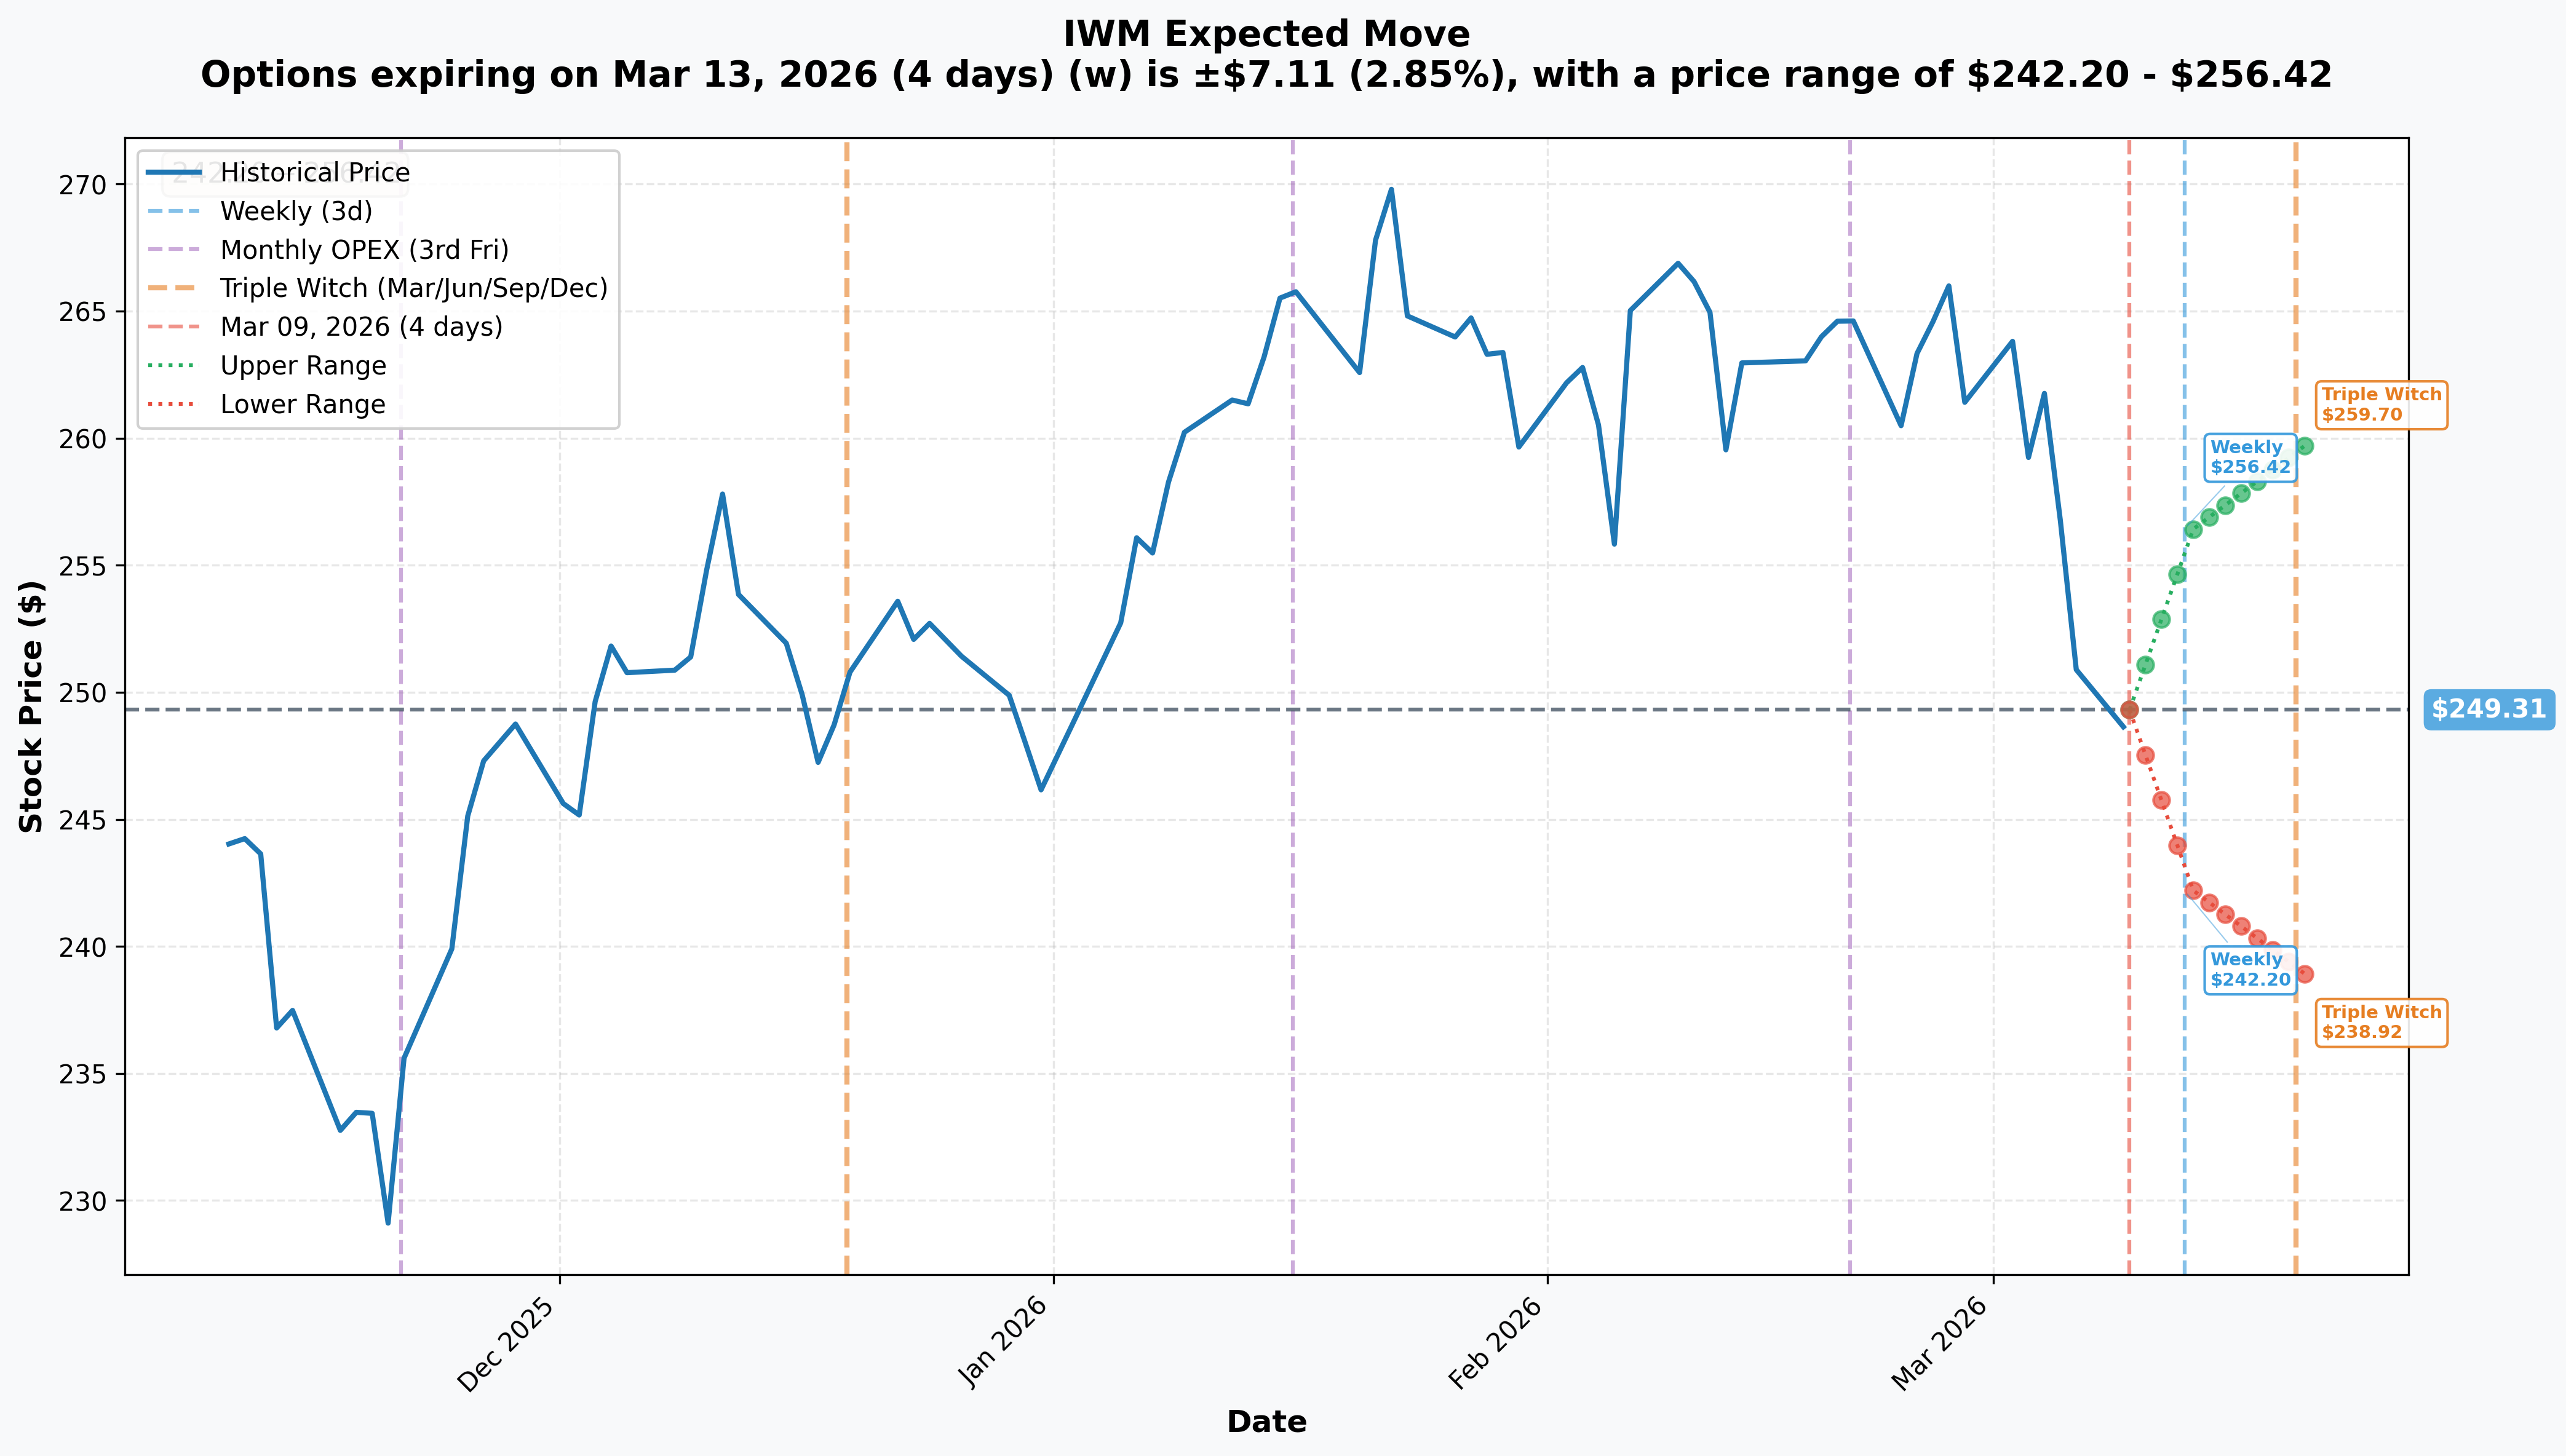
The options market is pricing in the following expected ranges based on implied volatility:
| Timeframe | Expiration | Expected Range | Move % |
|---|---|---|---|
| 📅 Weekly | 2026-03-13 | $242.20 - $256.42 | +/- 2.85% |
| 📅 Monthly / Triple Witch OPEX | 2026-03-20 | $238.92 - $259.70 | +/- 4.17% |
What the implied move tells us about the LEAP trade:
📉 Weekly downside: ~$242 -- Even in the worst-case weekly scenario, IWM stays $32 above the LEAP spread's $210 short strike. That is a 13% cushion.
📉 Monthly OPEX downside: ~$239 -- The Triple Witch lower bound still leaves IWM $29 above the danger zone. The LEAP trader does not care about weekly or monthly swings -- their trade has 1,011 days to play out.
📈 Near-term upside to $256-$260 -- If CPI comes in cool on March 11 or the FOMC signals dovishness on March 18, a snap-back rally to the $255-$260 gamma resistance zone is realistic. That would push IWM even further from the LEAP's short strike.
Key insight: The implied moves show that even under stress, the market expects IWM to stay well within the LEAP spread's profit zone. The $210 strike is roughly 2.7 standard deviations below current price on an annualized basis. To breach it by December 2028 and stay there would require a sustained economic contraction far beyond what the market is currently pricing.
🎪 Catalysts
✅ Already Happened (Recent)
📉 NFP Miss: -92,000 Jobs (March 6) -- The February non-farm payrolls came in horrifically below expectations, marking the worst jobs report since the pandemic. Key sectors hit: health care (-28K from the Kaiser Permanente strike), manufacturing (-12K), federal government (-10K from DOGE cuts). The unemployment rate ticked to 4.4%. IWM fell 2.32% on the day.
📉 KRE Regional Bank Plunge (March 2) -- The SPDR S&P Regional Banking ETF suffered a 5% single-day decline, its worst since mid-October. Zions Bancorporation and Western Alliance both disclosed problem loans in their commercial and industrial portfolios. With financials at ~18.7% of the Russell 2000, KRE weakness directly drags IWM.
⚖️ Supreme Court Strikes Down IEEPA Tariffs (February 20) -- The 6-3 ruling led to a Section 122 replacement surcharge of 15%, capped at 150 days. Small-caps initially outperformed on the domestic-focus thesis, but input cost pressures are now eroding that advantage.
📈 Small-Cap Earnings Renaissance -- S&P 600 trailing 12-month earnings rebounded 27% as of late January, breaking a 13-quarter slumber of underperformance. However, Goldman Sachs warns the 61% consensus EPS growth estimate is "far too optimistic."
📅 Upcoming (This Week and Beyond)
| Date | Event | Why It Matters for IWM |
|---|---|---|
| March 11 | February CPI Report (8:30 AM ET) | CRITICAL. Consensus: +0.3% MoM, 2.9% YoY. Cool print = rate cut hopes = small-cap rally. Hot print = higher-for-longer = small-cap pain. Bank of America expects core goods inflation to accelerate from China tariff effects |
| March 17-18 | FOMC Meeting + Dot Plot + SEP | CRITICAL. Rate hold expected at 3.50-3.75%. The dot plot is the swing factor: shift to 2 cuts = bullish, shift to 0 = bearish. Current probability for a cut stands at ~47% |
| March 20 | Triple Witch OPEX | Quarterly options/futures expiration. Massive gamma unwind could trigger outsized moves |
| July 24 | Section 122 Tariff Expiration | The 15% universal surcharge expires after 150 days unless Congress extends. Binary catalyst for domestic small-caps |
| Throughout 2026-2027 | $1.35 Trillion Debt Wall | $368B matures in 2026, $341B in 2027. 32% of Russell 2000 debt is floating-rate vs. 6% for S&P 500. 41% of Russell 2000 companies are "zombies" that cannot cover interest from operations |
| Throughout 2026 | $936B CRE Maturity Cycle | 1,788 banks have CRE exposure exceeding 300% of equity. Regional banks hold CRE at 28.7% of assets vs. 6.5% for large banks |
| Late June 2026 | Russell Index Reconstitution | Annual rebalancing creates forced buying/selling and short-term flow opportunities |
🎲 Price Targets & Probabilities
Based on gamma levels, implied move data, technical analysis, the macro catalyst calendar, and the LEAP trade's structure:
🐻 Bear Case: $230-$240 (-3.3% to -7.3%)
📉 If CPI comes in hot, the FOMC shifts to zero cuts, and the debt maturity wall starts claiming casualties among zombie companies, IWM could slide toward the 200-day SMA around $243 and potentially test $230. The $246 gamma wall (181B) and $240 (137B) would slow the descent, but a break below $243 would invalidate the long-term uptrend.
For the LEAP trade: Even at $230, the trader is still $20 above their short $210 strike -- and they have 1,000+ days of time value remaining. This scenario is uncomfortable but survivable.
Probability over the next 30 days: ~20% -- Requires multiple negative catalysts to compound (hot CPI + hawkish Fed + CRE contagion event).
⚖️ Base Case: $245-$255 (roughly flat to +3%)
📊 IWM consolidates in the $245-$255 range as the market digests CPI and FOMC. The massive gamma concentration at $246 (181B) and $250 (286B) creates a "pinning" effect. Rate cut expectations get pushed to July but are not eliminated, keeping the door open for a second-half recovery. The oversold RSI at 36.6 finds a floor and the mean-reversion process begins slowly.
For the LEAP trade: This is the expected path and the trader is fully in profit territory. The spread's theta decay works in their favor every day.
Probability over the next 30 days: ~55% -- The most likely scenario given gamma walls and mixed macro signals.
🚀 Bull Case: $258-$270 (+4% to +9%)
📈 A cool CPI print reignites rate cut expectations. The FOMC dot plot shifts to two cuts for 2026, unleashing the "Great Rotation" trade. Small-cap earnings growth of 18-22% materializes, and the wide valuation discount (19.5x P/E vs. 30x for S&P 500) finally closes. Institutional flows reverse as the -$1.16 billion monthly outflow turns to inflows.
For the LEAP trade: Dream scenario. The spread moves deep out-of-the-money and the $13.1M credit is fully secured with years of cushion remaining.
Probability over the next 30 days: ~25% -- Requires a positive catalyst cascade, but the oversold technical setup and historical rate-cut cycle outperformance support this outcome.
💡 Trading Ideas
🛡️ Conservative: "The LEAP Copycat" -- Bull Put Spread (Narrower Width)
Structure: Sell IWM Apr 17 $235 put / Buy IWM Apr 17 $230 put
Why this works: Same directional thesis as the big LEAP trade but with a much shorter duration and tighter risk. The $235 short strike sits below the 200-day SMA ($243), below every gamma support level on the board, and below the monthly OPEX implied move lower bound ($239). You are essentially saying: IWM does not crater 5.3% in 39 days.
📊 Estimated credit: ~$0.60-$0.90 per spread 📊 Max risk: ~$4.10-$4.40 per spread 📊 Max profit: Credit collected (if IWM stays above $235) 📊 Win probability: ~80-85% 📊 Best for: Traders who agree with the LEAP trader's thesis but want a faster resolution and tighter risk. Take profits early if the spread decays to $0.10.
⚖️ Balanced: "The CPI Bounce" -- Call Debit Spread
Structure: Buy IWM Mar 20 $250 call / Sell IWM Mar 20 $258 call (Triple Witch expiration)
Why this works: If the February CPI on March 11 comes in below expectations, small-caps could snap back hard from oversold conditions. The $250 strike sits right at the strongest gamma resistance -- clearing it signals a momentum shift. The $258 short call targets the weekly implied move upper bound at $256.42 with a bit of upside extension. You benefit from the post-selloff IV crush and the mean-reversion tendency after RSI dips below 37.
📊 Estimated cost: ~$2.00-$3.00 per spread 📊 Max profit: $8 per spread minus debit (roughly $5.00-$6.00) 📊 Breakeven: ~$252-$253 📊 Risk/reward: ~1:2 📊 Best for: Traders betting on a CPI-driven snap-back rally into Triple Witch. Wait for the CPI print before entering -- or enter a half-position now and add the rest on a cool number.
🔥 Aggressive: "The 2028 Conviction Play" -- Long-Dated Bull Put Spread
Structure: Sell IWM Jun 2027 $215 put / Buy IWM Jun 2027 $195 put
Why this works (and why it requires conviction): This mirrors the big trade's thesis on a smaller scale and shorter timeframe. The $215 short strike sits 13.4% below current price -- even deeper than the LEAP trader's 15.3% buffer. The June 2027 expiration gives you 15 months for the trade to play out, spanning the full debt maturity wall cycle, multiple FOMC meetings, the tariff expiration in July, and the Russell reconstitution. If small-cap earnings growth of 18-22% materializes and the Fed cuts rates further toward 3.00-3.25%, $215 becomes a distant memory.
📊 Estimated credit: $3.00-$5.00 per spread
📊 Max risk: $20 spread width minus credit ($15-$17)
📊 Capital efficiency: Use the credit to partially fund other positions
📊 Risk/reward: ~3:1 risk to reward, but with high probability of success
Why it could blow up:
- 📉 A full-blown recession that drives IWM below $215 for an extended period
- 🏦 CRE contagion triggers cascading regional bank failures, dragging IWM's 18.7% financials weighting
- 📊 The $1.35 trillion debt wall creates a credit crunch that overwhelms rate cuts
📊 Best for: Traders with a longer time horizon and sufficient margin who believe the U.S. avoids a prolonged recession. Size conservatively -- each spread controls $20,000 in notional risk.
⚠️ Risk Factors
❗ The $1.35 Trillion Debt Wall -- $368 billion in small-cap debt matures in 2026 and $341 billion in 2027. Refinancing at rates 150-200 basis points higher than original coupons is already erasing projected Q1 earnings growth. The LEAP trade's 3-year duration means it must survive this entire cycle.
❗ 41% Zombie Companies -- Nearly half of Russell 2000 companies cannot cover interest payments from operating profits. If the Fed pauses rate cuts or inflation re-accelerates, these companies face existential pressure. A wave of small-cap defaults would drag the entire index lower.
❗ CRE Contagion Risk -- $936 billion in CRE mortgages mature in 2026, with office vacancy rates near 20%. Regional banks hold CRE at 28.7% of assets -- a 4.4x overweight versus large banks. A research warning suggests nearly 2,000 U.S. banks are at risk of failure between 2026 and 2027. Since financials are 18.7% of the Russell 2000, a regional banking crisis would hit IWM hard.
❗ CPI & FOMC This Week -- February CPI on March 11 and FOMC on March 17-18 create a binary setup. Hot CPI + hawkish dot plot = delayed rate cuts = small-cap pain. Small-caps have 32% floating-rate debt exposure vs. just 6% for the S&P 500, making every basis point decision disproportionately impactful.
❗ Tariff Uncertainty -- The Section 122 surcharge of 15% expires July 24 unless Congress extends it. Congressional action (or inaction) creates a binary catalyst. Meanwhile, input cost inflation from tariffs on China is already compressing small-cap margins.
❗ Recession Risk Is Rising -- The -92,000 NFP print is a warning signal. A sustained move below 50,000 monthly payrolls could indicate recession. Rate cuts in a recessionary environment historically benefit small-caps less than in soft-landing scenarios. A recession that persists into 2028 would directly threaten the LEAP spread's profitability.
❗ ETF Outflows Accelerating -- One-month net flows turned negative at -$1.16 billion and 3-month flows are at -$2 billion. Institutional investors are de-risking small-cap exposure ahead of macro catalysts. If outflows accelerate, they create additional selling pressure.
🎯 The Bottom Line
Here is the deal: Someone with serious capital just placed a $31M LEAP bull put spread on IWM stretching to December 2028 -- nearly 3 years from now. They collected $13.1M in upfront credit and are risking roughly $152M on the thesis that the Russell 2000 stays above $210 for the next 1,011 days.
This is not a hedge. This is not a nimble swing trade. This is a multi-year structural bet on the survival of small-cap America through its most challenging period in a decade. The trader must be right through a $1.35 trillion debt maturity wall, a $936 billion CRE crisis, potential tariff escalation, and whatever else the macro environment throws at small-caps between now and late 2028.
Why it might work:
The math is on their side. IWM would need to fall 15.3% from current price just to reach the $210 short strike -- and it would need to stay there at expiration for them to lose. Historically, the U.S. stock market recovers from drawdowns of this magnitude within 12-18 months outside of severe recessions. The valuation discount to large-caps (~19.5x vs. ~30x P/E) provides a cushion, and rate cuts historically trigger small-cap outperformance by an average of ~12%. With the Fed at 3.50-3.75% and expected to glide toward 3.2% by early 2027, the rate environment should be a tailwind over the trade's life.
Why it might not:
The 41% zombie composition and CRE contagion risk represent structural vulnerabilities that rate cuts alone cannot solve. If a recession materializes and deepens through 2027, the Russell 2000 could revisit levels not seen since 2023 -- and $210 comes into play.
For your portfolio:
If you share this trader's long-term bullish conviction on small-caps, the conservative bull put spread below $235 is the cleanest way to express it with defined risk. If you want to trade the near-term catalysts, wait for the March 11 CPI print before making a move -- it sets the tone for the FOMC decision and the rest of Q1. The $246 gamma wall (181B gamma exposure) and $250 gamma resistance (286B) are your key levels to watch this week. A hold above $246 is bullish; a clean break below it opens the door to $240.
The market is nervous. The charts are bearish. The macro is uncertain. And someone with $152M of risk tolerance just told you they think it all works out. Size your positions accordingly. 👀
Disclaimer: This analysis is for informational purposes only and does not constitute financial advice. Options trading involves significant risk of loss. Always do your own research and consider your risk tolerance before entering any trade. Past unusual options activity is not a reliable predictor of future stock price movement.
About iShares Russell 2000 ETF: IWM tracks the Russell 2000 Index, providing broad exposure to approximately 2,000 small-cap U.S. equities. It is the benchmark ETF for small-cap investing, with ~$73.95 billion in total net assets, listed on NYSE Arca.