🏦 JPM Massive $20M Call Sweep - Smart Money Betting Big on Q4 Earnings! 🚀
📅 December 12, 2025 | 🔥 Unusual Activity Detected
🎯 The Quick Take
Someone just dropped $20 MILLION on JPMorgan Chase call options this morning - buying a combined 10,100 contracts across two strikes ($300) with expirations in December and January! With JPM trading at $317.17 and Q4 earnings dropping January 13th, this is smart money making a MASSIVE bullish bet just 32 days before the biggest bank in America reports. Translation: Institutional investors are loading up ahead of what could be a monster earnings print!
📊 Company Overview
JPMorgan Chase (JPM) is the undisputed king of American banking and one of the world's most powerful financial institutions:
- Market Cap: $864.0 Billion (largest bank globally by market cap)
- Industry: National Commercial Banks - Financial Services
- Current Price: $317.17 (near 52-week high of $322.25)
- Primary Business: Consumer banking, investment banking, trading, wealth management, and asset management across $4+ trillion in assets
JPMorgan operates four major divisions generating diversified revenue: Consumer & Community Banking, Corporate & Investment Bank, Commercial Banking, and Asset & Wealth Management. This fortress balance sheet with $57B in excess capital positions JPM to capitalize on multiple catalysts heading into 2026.
💰 The Option Flow Breakdown
The Tape (December 12, 2025 @ 11:22:26):
| Time | Symbol | Side | Buy/Sell | Type | Expiration | Premium | Strike | Volume | OI | Size | Spot | Option Price |
|---|---|---|---|---|---|---|---|---|---|---|---|---|
| 11:22:26 | JPM | ASK | BUY | CALL $300 | 2026-01-16 | $11M | $300 | 5.1K | 8.2K | 5,000 | $317.17 | $21.18 |
| 11:22:26 | JPM | ASK | BUY | CALL $300 | 2025-12-19 | $8.9M | $300 | 5.0K | 7.4K | 5,000 | $317.17 | $17.77 |
🤓 What This Actually Means
This is a calendar spread strategy executed by sophisticated institutional money! Here's what went down:
- 💸 Combined premium: $19.9M total ($11M + $8.9M)
- 🎯 Strike selection: $300 strike sits 5.4% below current price - slightly in-the-money positioning
- ⏰ Strategic timing: Two expirations capture different events:
- Dec 19 (7 days): 5,000 calls worth $8.9M - betting on pre-earnings rally
- Jan 16 (35 days): 5,000 calls worth $11M - positioned through Q4 earnings (Jan 13)
- 📊 Size matters: 10,100 contracts represents 1,010,000 shares worth ~$320M
- 🏦 Institutional confidence: This is a BULLISH directional bet, not a hedge
What's really happening here: This trader likely executed a diagonal call spread or is building a position ahead of JPM's Q4 earnings on January 13, 2026. By buying calls at the $300 strike with JPM at $317, they're betting the stock holds above $300 and potentially rallies higher. The December calls capture any near-term strength heading into earnings, while the January calls position through the actual earnings event. Think of it like buying premium seats to both the dress rehearsal AND the main show.
Unusual Score: 🔥 EXTREMELY UNUSUAL (17.76x and 14.82x average size) - These are the 1st and 2nd largest JPM option trades in recent history! The Z-scores above 14 mean this is literally once-a-quarter type activity. Smart money is making a BIG statement.
📈 Technical Setup / Chart Check-Up
YTD Performance Chart
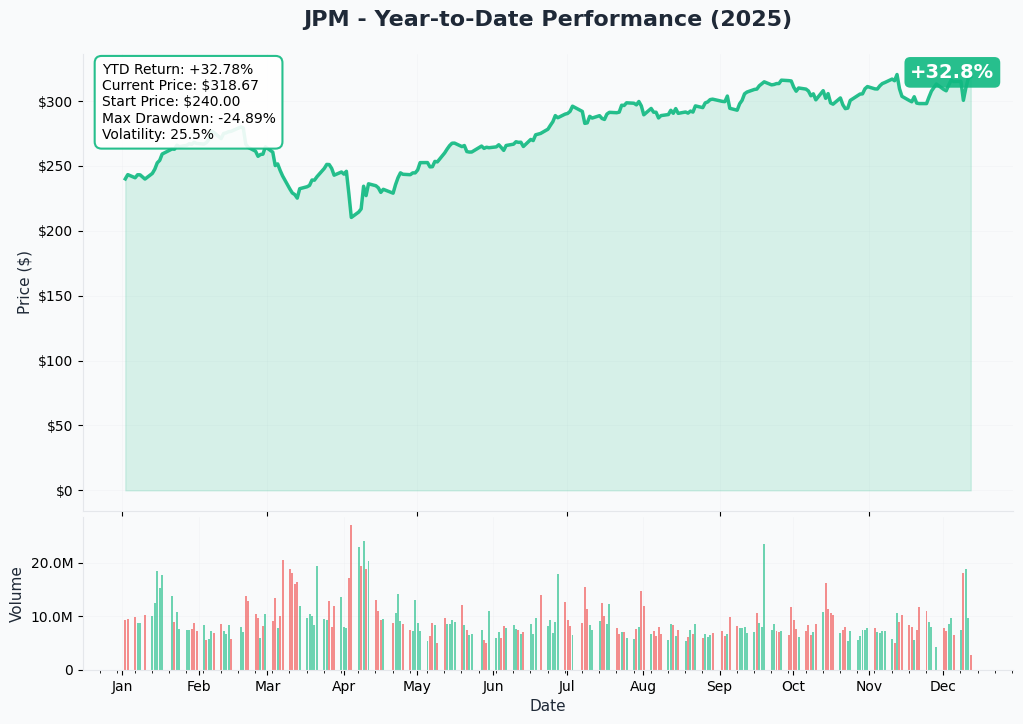
JPM is having an exceptional year - up +27-29% YTD with current price around $317 (started 2025 near $246). The chart shows a powerful rally driven by strong earnings, record trading revenue, and the $50B buyback program announced July 1st.
Key observations:
- 🚀 Steady climb: Consistent uptrend from April lows of $202 to November highs of $322
- 📈 Breakout confirmed: Smashed through $290 resistance in September, consolidated, then pushed to new highs
- 📊 Recent pause: Down 4.5% from November 12th high of $322.25 after December 9th expense guidance shock
- 💡 Strategic entry? Smart money buying this 4-5% dip before Q4 earnings catalyst
- ⚠️ Volatility: Trading in a $309-$322 range over past month - digesting gains before next leg
Gamma-Based Support & Resistance Analysis
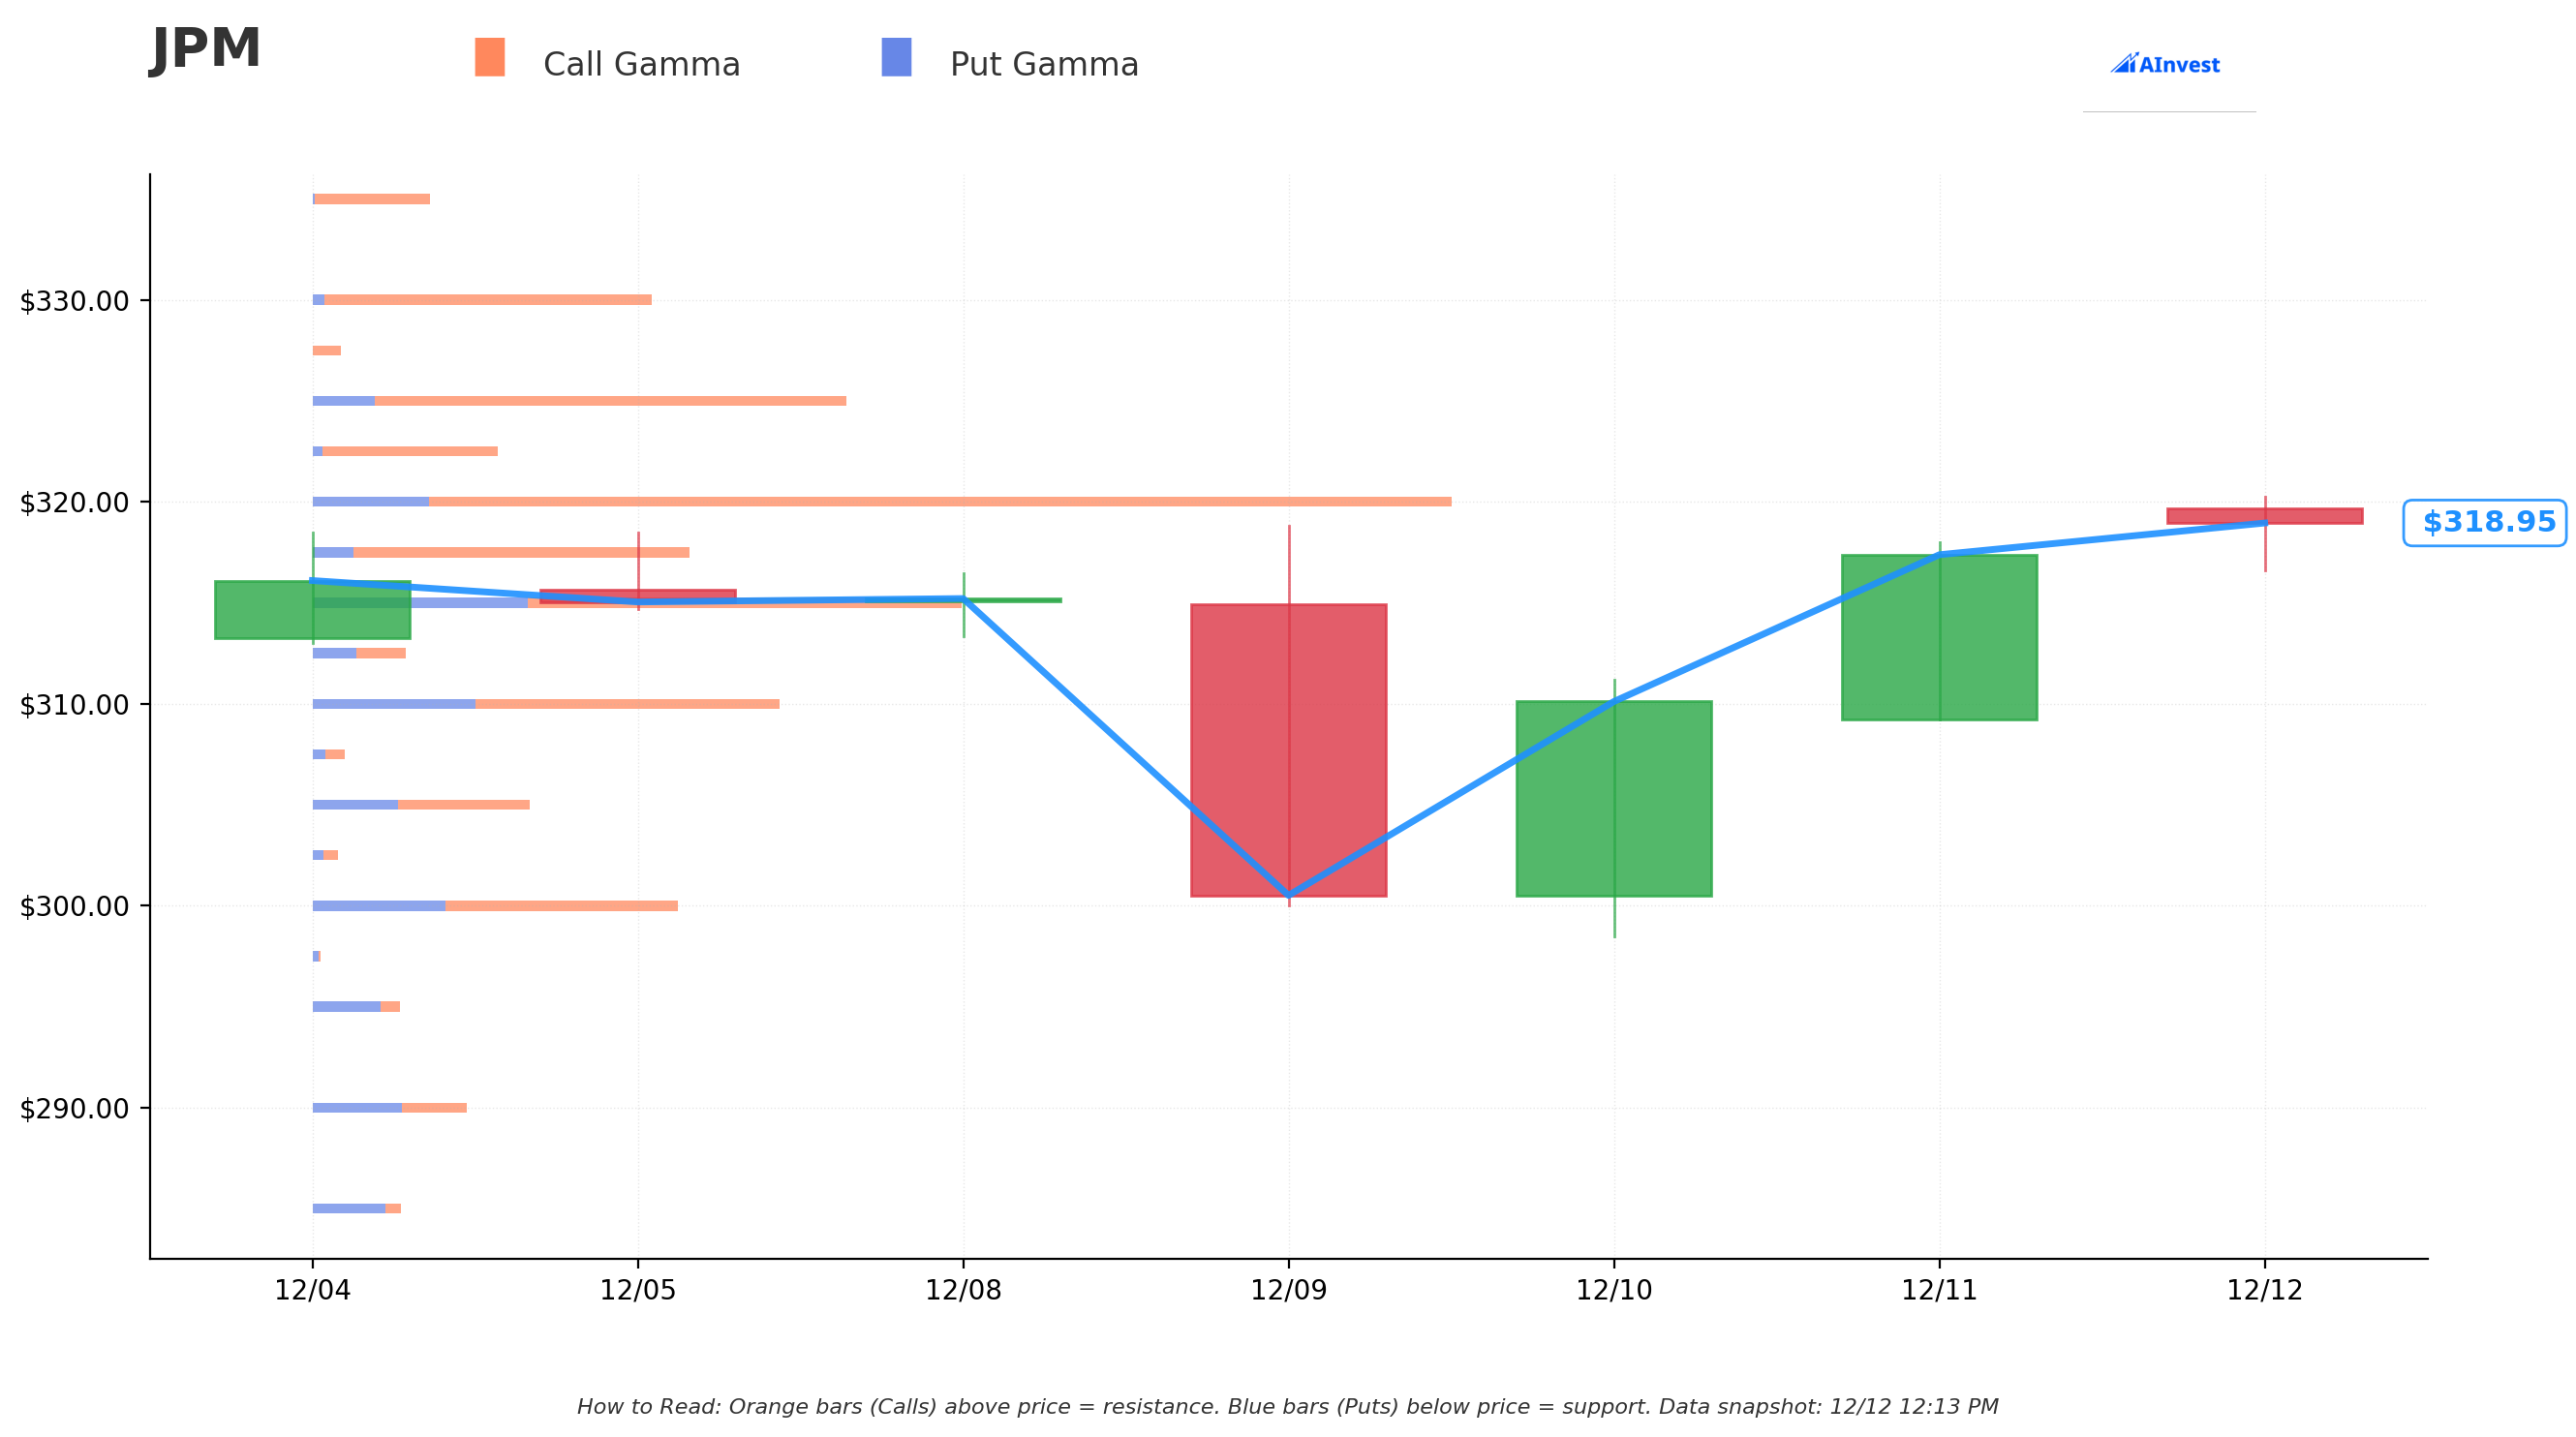
Current Price: $319.04
The gamma exposure map reveals critical price levels where options activity will influence stock movement:
🔵 Support Levels (Put Gamma Below Price):
- $317.50 - Immediate support with 11.4B total gamma (strongest nearby floor!)
- $315 - Secondary support at 15.3B gamma (dealers will defend this level)
- $310 - Major structural floor with 13.6B gamma (critical support zone)
- $305 - Deep support at 6.2B gamma (would require significant breakdown)
- $300 - Extended support with 10.4B gamma (exactly where these calls are struck! Not coincidental)
🟠 Resistance Levels (Call Gamma Above Price):
- $320 - Immediate ceiling with 34.8B gamma (STRONGEST RESISTANCE - massive barrier!)
- $322.50 - Secondary resistance at 5.7B gamma (previous all-time high)
- $325 - Major ceiling zone with 15.8B gamma (2% above current)
- $330 - Extended upside target at 10.0B gamma (4% rally required)
- $340 - Stretch goal at 5.8B gamma (7% above current)
What this means for traders: JPM is trading RIGHT at the edge of massive resistance at $320 where there's 34.8B in call gamma - the single largest level on the entire chain. This creates natural selling pressure as market makers hedge their exposure. However, if JPM can punch through $320, there's a clear path to $325-$330 before the next major resistance wall.
Notice anything? The call buyer struck EXACTLY at $300 where there's 10.4B gamma support. They're betting JPM stays well above this level, allowing them to profit from time decay and any upside movement. With strong support at $315-$317.50 below, the risk/reward looks attractive.
Net GEX Bias: Bullish (128.0B call gamma vs 45.1B put gamma) - Overall positioning remains VERY bullish with nearly 3:1 call/put gamma ratio, suggesting dealers are short calls and will need to buy stock on rallies.
Implied Move Analysis
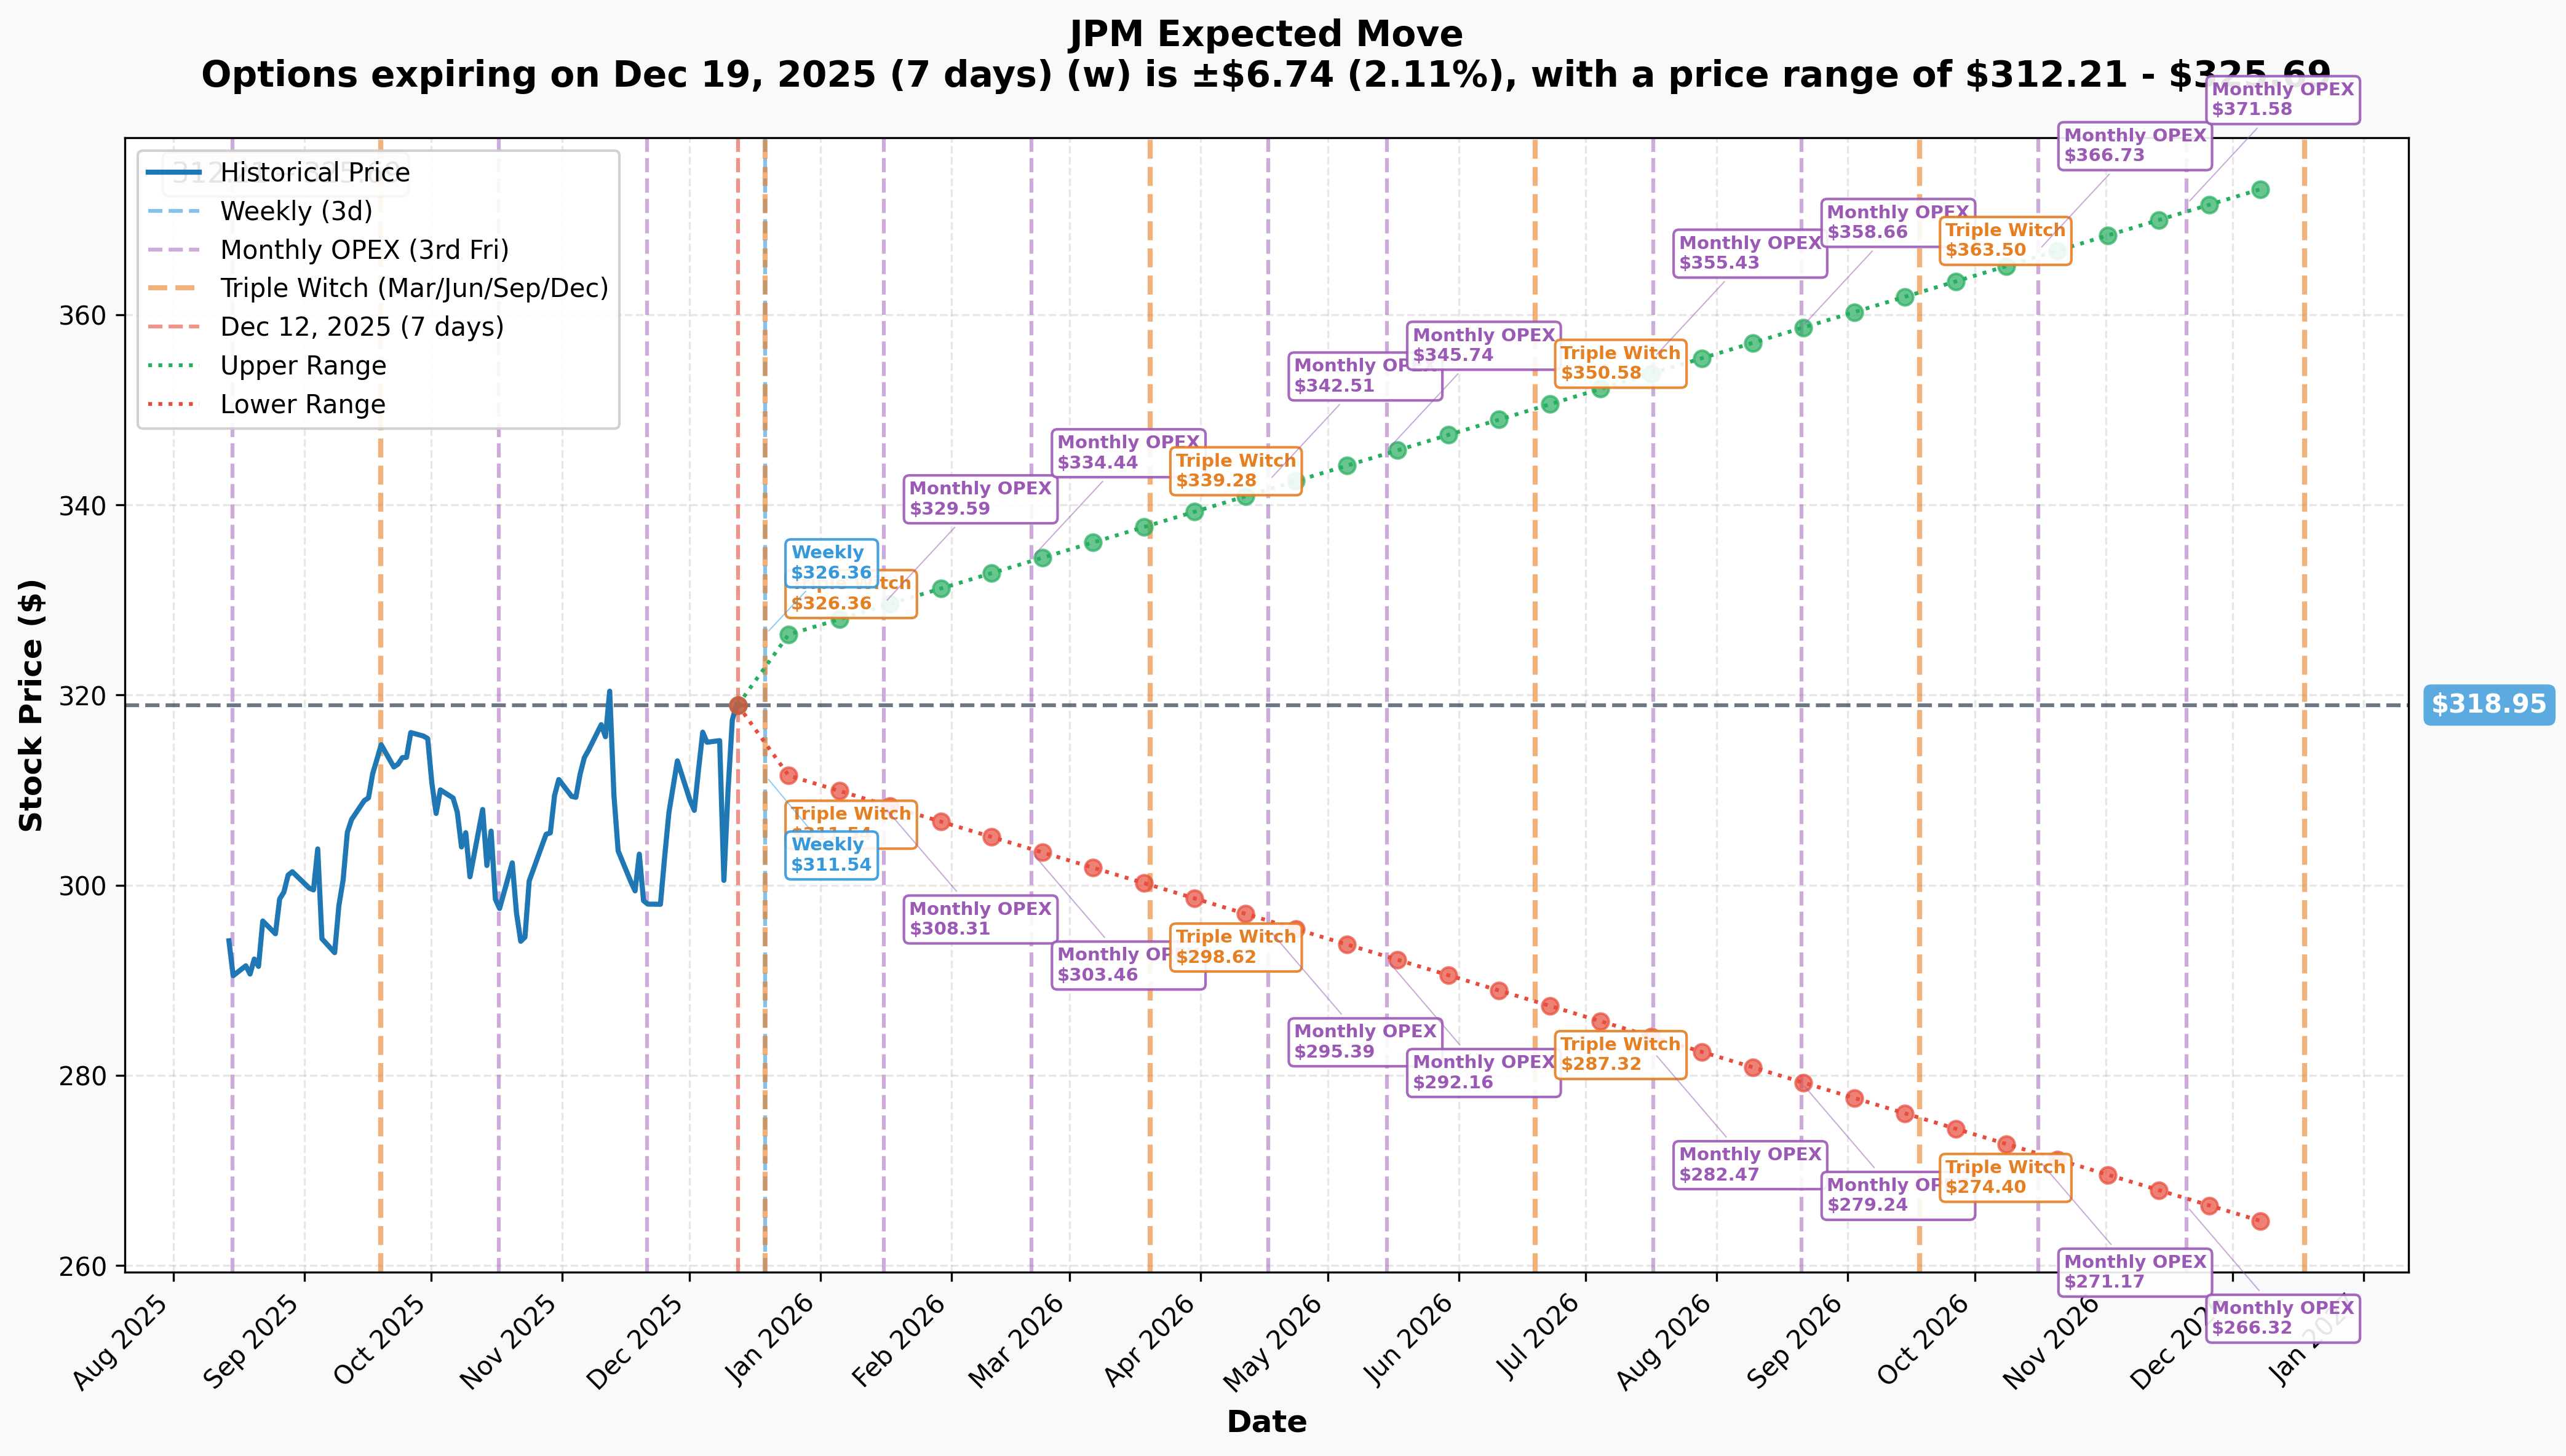
Options market pricing for upcoming expirations:
- 📅 Weekly (Dec 19 - 7 days): ±$6.74 (±2.11%) → Range: $312.21 - $325.69
- 📅 Monthly OPEX (Jan 16 - 35 days): ±$10.64 (±3.34%) → Range: $308.31 - $329.59
- 📅 Quarterly Triple Witch (Mar 20 - 98 days): ±$19.70 (±6.17%) → Range: $298.62 - $339.28
Translation for regular folks: Options traders are pricing in a 2.1% move ($6.74) by December 19th - that's relatively modest for a mega-cap bank stock. But notice the January 16th expiration (when the larger $11M call position expires) shows a 3.3% implied move, suggesting bigger volatility expected through earnings on January 13th.
The market is expecting JPM to trade in a $308-$330 range by January OPEX, which perfectly aligns with the gamma resistance at $330. This means the $300 strike calls have a very high probability of staying in-the-money through expiration, allowing the buyer to profit from both intrinsic value retention and potential stock appreciation.
Key insight: The relatively LOW implied volatility (2.11% weekly) despite upcoming earnings suggests options are reasonably priced - not overinflated. This makes the call buying particularly interesting as the trader isn't overpaying for volatility.
🎪 Catalysts
🔥 Immediate Catalysts (Next 7-35 Days)
December 19th - Monthly OPEX (Triple Witch) 📊
This Friday marks a major options expiration where the $8.9M December calls expire. With JPM at $317 and the calls struck at $300, they're currently worth $17+ of intrinsic value. Key factors for this week:
- 🎯 Call gamma wall at $320: Breaking above this level could trigger short covering and gamma squeeze toward $322-325
- 📈 Year-end positioning: Institutional funds rebalancing portfolios before year-end could drive volume
- 💰 Buyback support: JPM's $50B buyback program provides steady bid under the stock
- 📊 Low volatility environment: Calm markets favor gradual grind higher rather than sharp moves
Q4 2025 Earnings - January 13, 2026 (32 DAYS AWAY!) 📊
JPM reports fiscal Q4 results on Tuesday, January 13, 2026 at 6:45 AM ET (before market open). This is THE catalyst that the $11M January calls are positioned for. Wall Street consensus and expectations:
- 📊 Q4 NII ex-markets: $23.5B guided by management
- 💰 Q4 Total NII: ~$25B (includes trading/markets revenue)
- 🏦 Investment Banking: Expected low-single digit % increase YoY
- 📈 Markets Revenue: Expected low-teens % increase YoY (continued trading strength)
- 💸 Expenses: ~$24.5B for Q4, but 2026 guidance of $105B is the wildcard
Upside surprise potential:
- Trading revenue has been exceptional in Q3 ($8.9B record) - Q4 could continue momentum
- Investment banking environment described as "more constructive for bank M&A"
- Analyst price targets averaging $344 (8% above current) suggest room to run
Downside risk factors:
- Q4 NII guidance of $23.5B represents sequential decline from Q3's $24.1B
- Management flagged potential for deposit growth to cool
- 2026 expense guidance already shocked market with $105B (up 9.4% vs 2025) - any further negatives would hurt
Historical precedent: JPM typically moves 2-4% on earnings, but guidance sensitivity can create larger moves. The stock trading just 2% below all-time highs suggests high expectations are already priced in.
🚀 Near-Term Catalysts (Q1 2026)
$50 Billion Buyback Execution 💰
JPM's $50B share repurchase program announced July 1, 2025 remains a massive tailwind:
- 💪 Scale matters: $50B represents ~5.8% of current market cap - significant buying power
- 📊 Steady support: Buybacks provide consistent bid, smoothing volatility
- 🎯 Capital allocation priority: Management committed to returning excess capital with CET1 ratio at 14.8% (well above 11.5% required)
- ⏰ Timing flexibility: Can accelerate buybacks if stock pulls back, supporting downside
Dividend Payment - January 31, 2026 📅
Board approved $1.50/share quarterly dividend (7.1% increase from $1.40) payable January 31, 2026 to shareholders of record January 6, 2026:
- 💵 $6.00 annual dividend with 2.0% yield
- 📈 18 consecutive years of dividend growth
- 🏆 Fortress balance sheet supports continued increases
- 🎯 Income appeal: Attractive yield plus growth potential
Basel III Endgame Regulatory Decision (Q1 2026) ⚖️
Clarity expected in first quarter of 2026 on final Basel III capital rules:
- 🎯 Expected outcome: Final rules likely to be capital neutral (vs original proposal for ~20% increase)
- 📊 JPM position: Had projected capital requirements rising ~45% by 2025 under original proposals
- 💰 Impact if favorable: Could unlock additional capital for enhanced buybacks or dividends
- 🏦 Industry excess capital: U.S. large banks hold ~$200B in excess capital
- 📈 Probability: 70-75% likelihood of significantly scaled-back requirements
This could be a MAJOR positive catalyst - if Basel III rules come in lighter than feared, banks including JPM could announce enhanced capital return programs.
📊 Competitive Position & Market Leadership
Jamie Dimon's 2025 Investor Day (Expected April-May 2026) 📣
JPM typically hosts annual investor day in May where management provides multi-year outlook:
- 🎯 Strategic priorities: AI investment ($2B annually finding equal cost savings), branch expansion, international growth
- 📈 Long-term targets: Path to maintain ROE above 15%, continued market share gains
- 💡 Technology showcase: 2,000 AI-focused employees driving efficiency
- 🌍 Wealth management trajectory: On track from $6.4T to $10T in client assets
2026 Stress Test Results (Expected June 27, 2026) 📊
Annual CCAR stress tests expected to show lower capital requirements than 2025:
- 📉 Regulatory tailwind: Fed already reduced JPM's Stress Capital Buffer from 3.3% to 2.5% in 2025
- 💰 Capital flexibility: Lower requirements = more capital for buybacks and dividends
- 🎯 Potential catalyst: Could trigger announcement of supplemental buyback or special dividend
⚠️ Risk Catalysts (Negative)
December 2026 Expense Guidance Overhang 💸
The $105B 2026 expense guidance announced December 9th already triggered a 4.5% selloff and remains an overhang:
- 📊 $9B increase (9.4% YoY) vs 2025, exceeding consensus by $4B+
- ⚠️ Operating leverage concerns: Market worried revenue growth won't keep pace with cost inflation
- 🤔 Credibility issue: If Q4 guidance disappoints on revenue, expense concerns amplify
- 💡 Management spin: Characterized as "high-quality growth investments" but market skeptical
Consumer Credit Deterioration Risk 📉
JPM maintaining elevated loan loss provisions ($3.4B in Q3) while peers reduce reserves:
- ⚖️ Conservative positioning: Management warning about "benign credit environment may not last"
- 💳 Card charge-offs: Could move higher in 2026 per management commentary
- 📊 Spending slowdown: Credit and debit card volumes showing signs of slowing
- 🎯 Earnings sensitivity: Higher credit costs directly impact bottom line
Geopolitical & Macro Uncertainty 🌍
Dimon consistently warning of "considerable turbulence" from complex geopolitical environment:
- 🚨 Sticky inflation: "Inflation is there and maybe not going down"
- ⚖️ Rate uncertainty: If Fed cuts aggressively in 2026, NII faces pressure
- 🌎 Global tensions: Middle East, US-China, Russia-Ukraine impacts trading/markets
- 📉 Recession risk: Dimon estimates "30% chance" of significant downturn
🎲 Price Targets & Probabilities
Using gamma levels, implied move data, and upcoming catalysts, here are the scenarios through January 16th expiration:
📈 Bull Case (35% probability)
Target: $330-$344
How we get there:
- 💪 Q4 earnings BEAT with trading revenue continuing Q3 strength
- 🏦 Investment banking surprises to upside as M&A environment accelerates
- 📊 Credit concerns prove overblown - provisions decline vs Q3 levels
- ⚖️ Basel III clarity in late January removes regulatory uncertainty with capital-neutral outcome
- 💰 Management announces accelerated buyback or supplemental capital return
- 📈 Break above $320 gamma resistance triggers momentum to $325, then $330
- 🎯 Analyst consensus target of $344 gets validated
Key metrics needed:
- Q4 NII $25B+ (beating $23.5B guidance)
- Investment banking revenue up mid-to-high single digits (not just low single digits)
- Credit provisions stable or declining vs Q3
- 2026 revenue guidance strong enough to offset expense concerns
Probability assessment: 35% because it requires strong earnings execution AND favorable regulatory outcome. Stock already recovered partially from December dip, limiting easy upside. Gamma resistance at $320 is formidable barrier.
🎯 Base Case (50% probability)
Target: $310-$325 range (MODERATE CHOP)
Most likely scenario:
- ✅ Solid earnings meeting or slightly beating consensus
- 📊 Trading revenue good but not spectacular - normalizing from Q3's record levels
- 🏦 Investment banking in-line with guidance (low-single digit growth)
- ⚖️ Credit commentary balanced - not alarming but maintaining conservative stance
- 💸 Expense focus dominates - market wants to see revenue growth plans for 2026
- 🔄 Trading within $315 support and $325 resistance for several weeks
- 📉 Initial post-earnings volatility fades quickly as position consolidates
- ⏰ Market waits for Basel III clarity and next catalyst (Q1 earnings in April)
This aligns perfectly with the call buyer's positioning: The $300 strike calls stay deep in-the-money with JPM trading $315-325. At January expiration:
- Stock at $320: Calls worth $20.00 intrinsic value (vs $21.18 paid) = small loss offset by December position profits
- Stock at $325: Calls worth $25.00 = modest profit
- Combined with $17.77 December calls that are already profitable
Why 50% probability: JPM's diversified business model and fortress balance sheet make dramatic moves less likely. Stock at fair value (15.7x earnings) near all-time highs. Most institutions will hold and collect dividends while waiting for catalysts.
📉 Bear Case (15% probability)
Target: $295-$310 (TEST SUPPORT)
What could go wrong:
- 😰 Earnings miss on revenue OR weak Q1 guidance disappoints
- 🚨 Trading revenue significantly below Q3 levels - volatility environment normalizes
- 💸 Credit provisions INCREASE vs Q3, validating conservative stance but scaring market
- 📊 Management commentary on 2026 revenue fails to offset $105B expense concerns
- 🌍 Macro deterioration - recession fears increase, impacting loan demand
- ⚖️ Basel III rules come in tougher than expected (low probability but possible)
- 💰 Deposit growth cooling materializes, pressuring NII outlook
- 🔨 Break below $315 support triggers cascade toward $310, then $300
Critical support levels:
- 🛡️ $317.50: Immediate gamma floor (11.4B) - currently testing
- 🛡️ $315: Major support (15.3B gamma) - MUST HOLD or momentum shifts
- 🛡️ $310: Deep support (13.6B gamma) - major institutional buyers likely step in
- 🛡️ $300: Extended floor + call strike - would require significant negative catalysts
Probability assessment: Only 15% because it requires multiple negative surprises. JPM's Q3 beat, strong trading franchise, $50B buyback support, and conservative credit provisioning provide downside cushion. Even if earnings disappoint, stock unlikely to break $300 support given fundamental strength.
Call P&L in Bear Case:
- Stock at $310 on Jan 16: $300 calls worth $10.00, loss = -$11.18/share × 5,000 = -$5.6M (51% loss) - OUCH but not catastrophic for $20M position
- Stock at $305 on Jan 16: Calls worth $5.00, loss = -$16.18/share × 5,000 = -$8.1M (73% loss)
- Stock at $295 on Jan 16: Calls worth $0 (out-of-money), full loss on Jan calls = -$11M (100%)
The $17.77 December calls would already be closed/rolled before this scenario, potentially reducing total loss.
💡 Trading Ideas
🛡️ Conservative: Own the Stock, Sell Covered Calls
Play: Buy JPM stock around $315-318, sell covered calls against position
Why this works:
- 💰 Dividend yield: 2.0% ($6.00/year) provides income cushion
- 🛡️ Downside protection: $50B buyback provides support, gamma floor at $315 strong
- 📊 Valuation reasonable: 15.7x earnings vs 18-20x historical premium
- ⏰ Event catalyst: Q4 earnings January 13th provides defined timeline
- 💸 Income enhancement: Sell Jan 16 $325 calls for $4-5 premium (1.3-1.6% extra income)
Structure:
- 📈 Buy 100 shares JPM at $316-318 = $31,600-31,800
- 💵 Sell 1x Jan 16 $325 call for ~$4.50 = $450 credit
- 🎯 Total basis: ~$312.50 after call premium
Estimated P&L:
- 📈 Max profit: $1,700 if JPM ≥$325 at Jan 16 (stock gain $8.50 + call premium $4.50 = $13.00/share) = 4.1% return in 35 days
- 💼 Moderate profit: $550-850 if JPM at $316-320 (call expires worthless, keep premium + small stock gain)
- 📉 Downside protection: Breakeven at $312.50 (vs entry at $316.50) = 1.3% cushion from call premium
- 🛡️ Gamma support: $315-317.50 levels provide technical floor
Risk level: Low (stock ownership with income enhancement) | Skill level: Beginner-friendly
Expected outcome: Consistent income strategy that outperforms in flat-to-moderate bull scenarios. Even if called away at $325, 4% return in 5 weeks is excellent.
⚖️ Balanced: Bull Call Spread (Copy The Pros' Strike)
Play: Buy call spread at same $300 strike as institutional trade
Structure: Buy $300 calls, Sell $330 calls (January 16 expiration - SAME as the $11M trade)
Why this works:
- 🎯 Copying smart money: Following the exact strike and expiration of $20M institutional bet
- 📊 Defined risk spread: $30 wide = $3,000 max risk per spread
- 💰 Reasonable cost: Net debit ~$21.00 - $8.00 = $13.00 (vs full $21.00 for naked call)
- 🎪 Positioned through earnings: January 13th Q4 results is THE catalyst
- 📈 Gamma target: $330 resistance aligns with spread max profit
- ⏰ 35 days to work: Plenty of time for thesis to play out
Estimated P&L:
- 💰 Pay ~$13.00 net debit per spread ($1,300 per spread)
- 📈 Max profit: $17.00 if JPM ≥$330 at expiration ($1,700 per spread) = 131% return!
- 🎯 Breakeven: $313 (well below current $317)
- 📉 Max loss: $13.00 if JPM <$300 ($1,300 per spread) - unlikely given support structure
- 📊 Risk/Reward: 1.3:1 which is EXCELLENT for defined-risk bullish play
Entry timing:
- 🎯 Enter on any dip toward $315 (better entry, wider margin of safety)
- ✅ Current levels ~$317 still attractive given institutional validation
- ⏰ Avoid waiting too close to earnings (Jan 13) as implied volatility will spike
Position sizing: Risk 3-7% of portfolio (this is directional speculation on earnings catalyst)
Why this beats the naked call: You reduce cost by 38% ($21 → $13) by giving up upside above $330. Since analyst targets average $344 and gamma resistance at $330 is strong, capping gains there is reasonable tradeoff for significantly reduced risk.
Risk level: Moderate (defined risk, directional bullish) | Skill level: Intermediate
🚀 Aggressive: Double Down on Earnings with ATM Straddle (ADVANCED ONLY!)
Play: Buy straddle betting on post-earnings volatility explosion
Structure: Buy $320 calls + Buy $320 puts (January 16 expiration)
Why this could work:
- 💥 Implied move only 3.3% ($10.64) but JPM moved 4.5% on December 9th expense news alone
- 🎰 Betting earnings reaction exceeds implied move pricing
- 📊 2026 expense guidance already shocked market - either strong revenue guidance sends it higher OR disappointing outlook confirms fears
- ⚡ Only need stock to move >4-5% either direction to profit
- 🎪 Binary catalyst with clear event date (January 13th)
Why this could blow up (SERIOUS RISKS):
- 💸 EXPENSIVE: Straddle costs ~$16-18 ($1,600-1,800 per straddle)
- ⏰ TIME DECAY KILLER: Theta burns -$50-75/day approaching earnings
- 😱 IV CRUSH: Even if stock moves 4-5%, IV collapse post-earnings could still result in LOSS on both legs
- 📊 Tight gamma range: Stock pinned between $315-$325 support/resistance makes big moves harder
- 🎢 Need 5%+ move to breakeven AFTER factoring in IV crush
- ⚠️ Earnings could be "as expected" - stock gaps to $322-325 (only 3% move) and straddle loses 40-50%
Estimated P&L:
- 💰 Cost: ~$17 per straddle ($1,700)
- 📈 Profit scenario: Stock moves to $335 or $305 (5%+ move) = $8-10 gain (47-59% ROI)
- 🚀 Home run: Stock moves to $344 or $296 (8%+ move) = $20+ gain (118%+ ROI)
- 📉 Loss scenario: Stock ends $312-328 range = lose $8-12 (47-71% loss)
- 💀 Total loss: Stock flat at $320 = lose entire $17 (100% loss)
Breakeven points:
- 📈 Upside breakeven: ~$337 (need 6% rally)
- 📉 Downside breakeven: ~$303 (need 5% drop)
CRITICAL WARNING - DO NOT attempt unless you:
- ✅ Have traded straddles through bank earnings before and understand IV dynamics
- ✅ Can afford to lose ENTIRE premium (real possibility!)
- ✅ Understand you're betting AGAINST current options pricing
- ✅ Can monitor position Tuesday morning (Jan 13) post-earnings and take profits quickly
- ✅ Accept that IV crush typically reduces straddle value 30-50% even on 3-4% moves
- ⏰ Plan to close position within 24-48 hours post-earnings (don't hold to expiration)
Alternative safer approach: Wait until 2-3 days before earnings, buy CHEAPER straddle when IV is higher but time decay less threatening. Or use weekly options for earnings week only.
Risk level: EXTREME (can lose 100% of premium) | Skill level: Advanced only
Probability of profit: ~35-40% (lower than implied 50% due to IV crush mechanics)
⚠️ Risk Factors
Don't get caught by these potential landmines:
-
⏰ Earnings binary event in 32 days: Results January 13th before market open create volatility risk. Q4 NII guidance of $23.5B represents sequential decline from Q3's $24.1B, so any further disappointment magnified. Markets extremely focused on 2026 revenue guidance to offset the $105B expense shock. Stock could gap 3-5% either direction.
-
💸 Expense guidance overhang: The $105B 2026 expense guidance (up 9.4% vs 2025) already triggered 4.5% selloff on December 9th. Market needs to see STRONG revenue growth plans or this becomes "earnings growth headwind" narrative. Peers maintaining tighter cost discipline, making JPM's operating leverage look weak.
-
📉 Credit quality deterioration risk: JPM maintaining elevated $3.4B provisions while rivals reduce reserves signals management sees credit risks others don't. Card charge-offs could move higher in 2026 per CEO commentary. Any actual credit deterioration would hit earnings directly and validate conservative stance.
-
🌍 Jamie Dimon's macro warnings: CEO consistently cautioning about "considerable turbulence" and "30% chance of significant downturn". When the most successful banker alive is THIS cautious, investors should listen. Sticky inflation concerns and geopolitical tensions (Middle East, China) create macro uncertainty.
-
📊 NII pressure if rates cut: Q4 NII guidance of $23.5B ex-markets already shows sequential decline. If Fed cuts rates more aggressively than expected in 2026, net interest income faces further pressure. Balance sheet growth can only partially offset lower rates. This is THE key sensitivity for bank stocks.
-
🏦 Trading revenue normalization: Q3's record $8.9B trading revenue benefited from volatility around election and Trump trade policies. If markets calm in 2026, trading could revert toward $6-7B quarterly run rate, creating earnings headwind. Market may not be pricing this normalization risk.
-
💰 Deposit growth cooling: Management flagged December guidance that deposit growth could cool. This is critical for funding loan growth and trading operations. Slowing deposits = margin pressure = NII headwinds. Watch this metric closely in Q4 results.
-
⚖️ Basel III uncertainty (until Q1 2026): While 70% probability of capital-neutral outcome, there's still 30% chance rules come in tougher than expected. Final clarity not until Q1 2026 means this overhang persists. If unfavorable, could constrain capital returns.
-
🎢 Limited upside from current levels: Stock at $317 is only 2% below November all-time high of $322. Already up 27-29% YTD. Analyst consensus target of $344 represents just 8% upside. For mega-cap bank stock, that's modest. Need significant positive surprises to drive meaningful outperformance from here.
-
🔨 Gamma ceiling at $320 creates mechanical resistance: Massive 34.8B call gamma at $320 means market makers systematically SELL into rallies to hedge exposure. This creates natural resistance making breakouts difficult. Need sustained institutional buying (like this $20M trade) to overcome. Recent action shows stock struggling to break through.
-
🐋 Insider selling earlier in year: Notable Q2 2025 selling by CFO Jeremy Barnum (68.95% stake reduction, $10M) and General Counsel Stacey Friedman. While insiders own <1% total, large sales by senior executives can signal caution about near-term outlook. These sales occurred BEFORE the December expense guidance - what did they know?
🎯 The Bottom Line
Real talk: Someone just deployed $20 MILLION betting JPM stays strong through Q4 earnings on January 13th. This isn't a hedge - this is a MASSIVE directional bullish bet on the largest bank in America by sophisticated institutional money that sees what's coming.
What this trade tells us:
- 🎯 They're positioned for JPM to hold $300+ through January (currently $317)
- 💰 They bought TWO expirations - December for near-term strength, January for earnings
- ⚖️ The $300 strike choice (5.4% below current) suggests high conviction stock stays elevated
- 📊 Timing right after December 9th expense selloff (-4.5%) shows they're buying the dip
- ⏰ Smart money betting Q4 earnings BEAT and/or Basel III clarity provides positive catalyst
This is NOT a "buy blindly and ignore risk" signal - it's a "JPM's fortress balance sheet and diversified business model position it well for Q4 catalysts" signal.
If you own JPM:
- ✅ HOLD - fundamentals remain strong with $50B buyback support
- 📊 Consider selling covered calls at $325-$330 to generate income while waiting for earnings
- ⏰ Set MENTAL STOP at $310 (major gamma support) to protect if something breaks
- 🎯 Earnings January 13th is moment of truth - expect 2-4% move either direction
- 🛡️ $315-317.50 gamma support provides downside cushion
If you're watching from sidelines:
- 🎯 Current levels $315-318 offer reasonable entry with 2% dividend yield and buyback support
- ⏰ Post-earnings dip (if it occurs) to $310-312 would be EXCELLENT opportunity
- 📈 Looking for confirmation: Q4 NII >$25B, investment banking acceleration, credit quality stable
- 🚀 Longer-term (6-12 months), Basel III relief and enhanced capital returns could drive $340-350
- ⚠️ Wait for pullback below $310 if you're more conservative - gamma support strong there
If you're considering options:
- 🎯 Bull call spread $300/$330 (Jan 16) offers best risk/reward - copy the pros!
- 📊 Cost ~$13 for $17 max profit potential (131% ROI) with breakeven at $313
- ⚠️ Avoid naked call buying unless you understand IV crush risk post-earnings
- 📉 Straddles are EXPENSIVE and risky - only for advanced traders betting on >5% earnings move
- ⏰ Best entry: current levels or any dip toward $315
Mark your calendar - Key dates:
- 📅 December 19 (Friday) - Monthly OPEX, triple witch expiration ($8.9M calls expire)
- 📅 January 6, 2026 (Monday) - Record date for $1.50 quarterly dividend
- 📅 January 13, 2026 (Tuesday) 6:45 AM ET - Q4 FY2025 earnings report (THE CATALYST!)
- 📅 January 16, 2026 (Friday) - Monthly OPEX, expiration of $11M call position
- 📅 January 31, 2026 - $1.50 dividend payment
- 📅 Q1 2026 (Feb-Mar) - Basel III Endgame final rules expected
Final verdict: JPM's fortress balance sheet ($57B excess capital, 14.8% CET1 ratio), diversified revenue streams (record $8.9B trading in Q3, growing wealth management $4.6T→$10T AUM path), and market leadership position it as defensive quality in uncertain times. The $105B expense guidance is a headwind, but management's conservative credit provisioning and Jamie Dimon's cautious macro stance provide downside protection.
The $20M institutional call buy is a CLEAR signal: smart money sees Q4 as a beat-and-raise opportunity with Basel III regulatory relief providing additional upside catalyst in Q1 2026.
At 15.7x earnings with 2% yield, JPM offers quality, income, and capital appreciation potential. The risk/reward at $315-320 levels looks favorable for 6-12 month investors willing to own through earnings volatility. 💪
Disclaimer: Options trading involves substantial risk of loss and is not suitable for all investors. This analysis is for educational purposes only and not financial advice. The unusual scores (17.76x and 14.82x average) reflect these specific trades' sizes relative to recent JPM history - they do not imply the trades will be profitable or that you should follow them. Past performance doesn't guarantee future results. Earnings create binary event risk with potential for 3-5% gaps either direction. The call buyer may have complex portfolio strategies not applicable to retail traders. Always do your own research and consider consulting a licensed financial advisor before trading.
About JPMorgan Chase: JPMorgan Chase is one of the largest and most complex financial institutions in the United States, with more than $4 trillion in assets. The institution operates across four divisions: consumer and community banking, corporate and investment banking, commercial banking, and asset and wealth management, with a market cap of $864.0 billion in the National Commercial Banks industry.