🏦 JPM: $2.2M LEAPS Call Betting on $360 After Record-Breaking 2024!
📅 December 26, 2025 | 🔥 Extremely Unusual Activity
🎯 The Quick Take
Someone just dropped $2.2 MILLION on a deep out-of-the-money LEAPS call in JPMorgan Chase (JPM), betting the banking giant rallies another 10% to $360 by January 2027. This isn't a short-term trade - it's a 13-month thesis that the regulatory deregulation tailwinds, capital return programs, and investment banking resurgence justify multi-year outperformance. Let's break down why this trader is willing to bet seven figures on America's most dominant bank breaking to new highs.
💰 The Option Flow Breakdown
📊 What Just Happened
Trade Details - Long LEAPS Call:
| Field | Value |
|---|---|
| Time | 11:27:17 |
| Strike | $360 |
| Type | CALL |
| Side | BUY |
| Size | 1,000 contracts |
| Premium | $2.2M |
| Spot | $327.91 |
| Expiration | 2027-01-15 |
| Days to Expiry | 385 days |
| Order Type | BTO |
| Strategy | Long Call (Buy to Open) |
Net Debit: $2,200 per contract ($2.2M total)
Max Profit: Unlimited above $360 Max Risk: $2.2M (100% of premium if JPM stays below $360) Breakeven: $362.20 (strike + premium paid)
🤓 What This Actually Means
This is institutional-grade "buy and hold the rally" conviction with a time horizon stretching into 2027. Here's the translation:
💡 The Setup:
- Bought 1,000 out-of-the-money calls at $360 strike (9.8% above current price)
- Paid $2,200 per contract = $2.2M total premium
- Expiration: January 15, 2027 (385 days = 13 months of runway)
- This is EXTREMELY UNUSUAL - statistically rare activity
📈 The Bet:
- JPM rallies from $327.91 to above $360 (+9.8% move) by January 2027
- If JPM trades at $370: Profit = $10 per share x 100,000 shares = $1M gain (45% ROI)
- If JPM trades at $380: Profit = $20 per share x 100,000 shares = $2M gain (91% ROI)
- If JPM trades at $400: Profit = $40 per share x 100,000 shares = $4M gain (182% ROI)
- If JPM stays below $362.20 at expiry: Full loss of $2.2M
⚡ Why It's Notable: This trade came on December 26, 2025 - the day after Christmas when liquidity is thin but conviction is high. The trader is paying for 13 months of optionality on the regulatory deregulation story, Basel III Endgame softening, and the ongoing $50 billion buyback program. This is a bet on structural drivers, not quarterly noise.
This represents activity that almost never happens in normal trading. Someone is making a serious statement.
📈 Chart Check-Up
YTD Performance: Banking's Best Year Ever
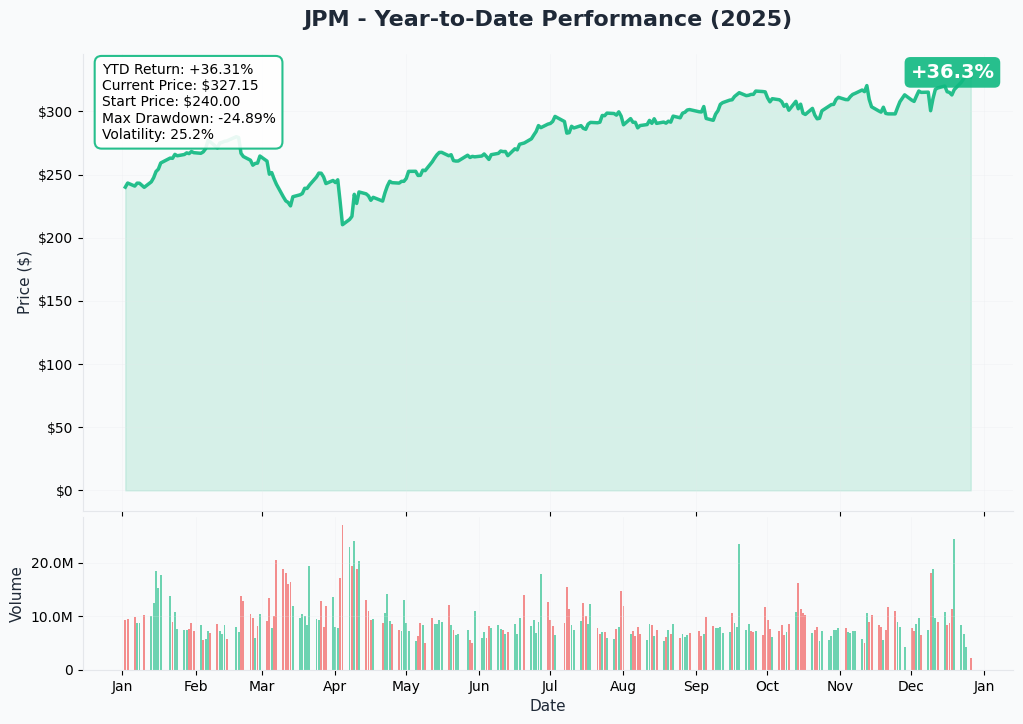
JPM has delivered a masterclass in 2024-2025 performance, climbing from ~$202 to an all-time high of $329.17 in late December 2025 (+63% YTD). The stock has been a relentless grinder higher, riding a trifecta of catalysts:
- Record Earnings: $58.5B net income in 2024 - the most profitable year for any U.S. bank in history
- Investment Banking Recovery: IB fees +49% YoY in Q4 2024 as M&A and IPO markets thawed
- Deregulation Tailwinds: U.S. banks added $600B in market cap in 2025 on Trump administration deregulation expectations
The stock's now trading at all-time highs around $327.91, which makes this $360 call bet particularly interesting. It's not buying a dip - it's betting the breakout continues.
Gamma-Based Support & Resistance Analysis
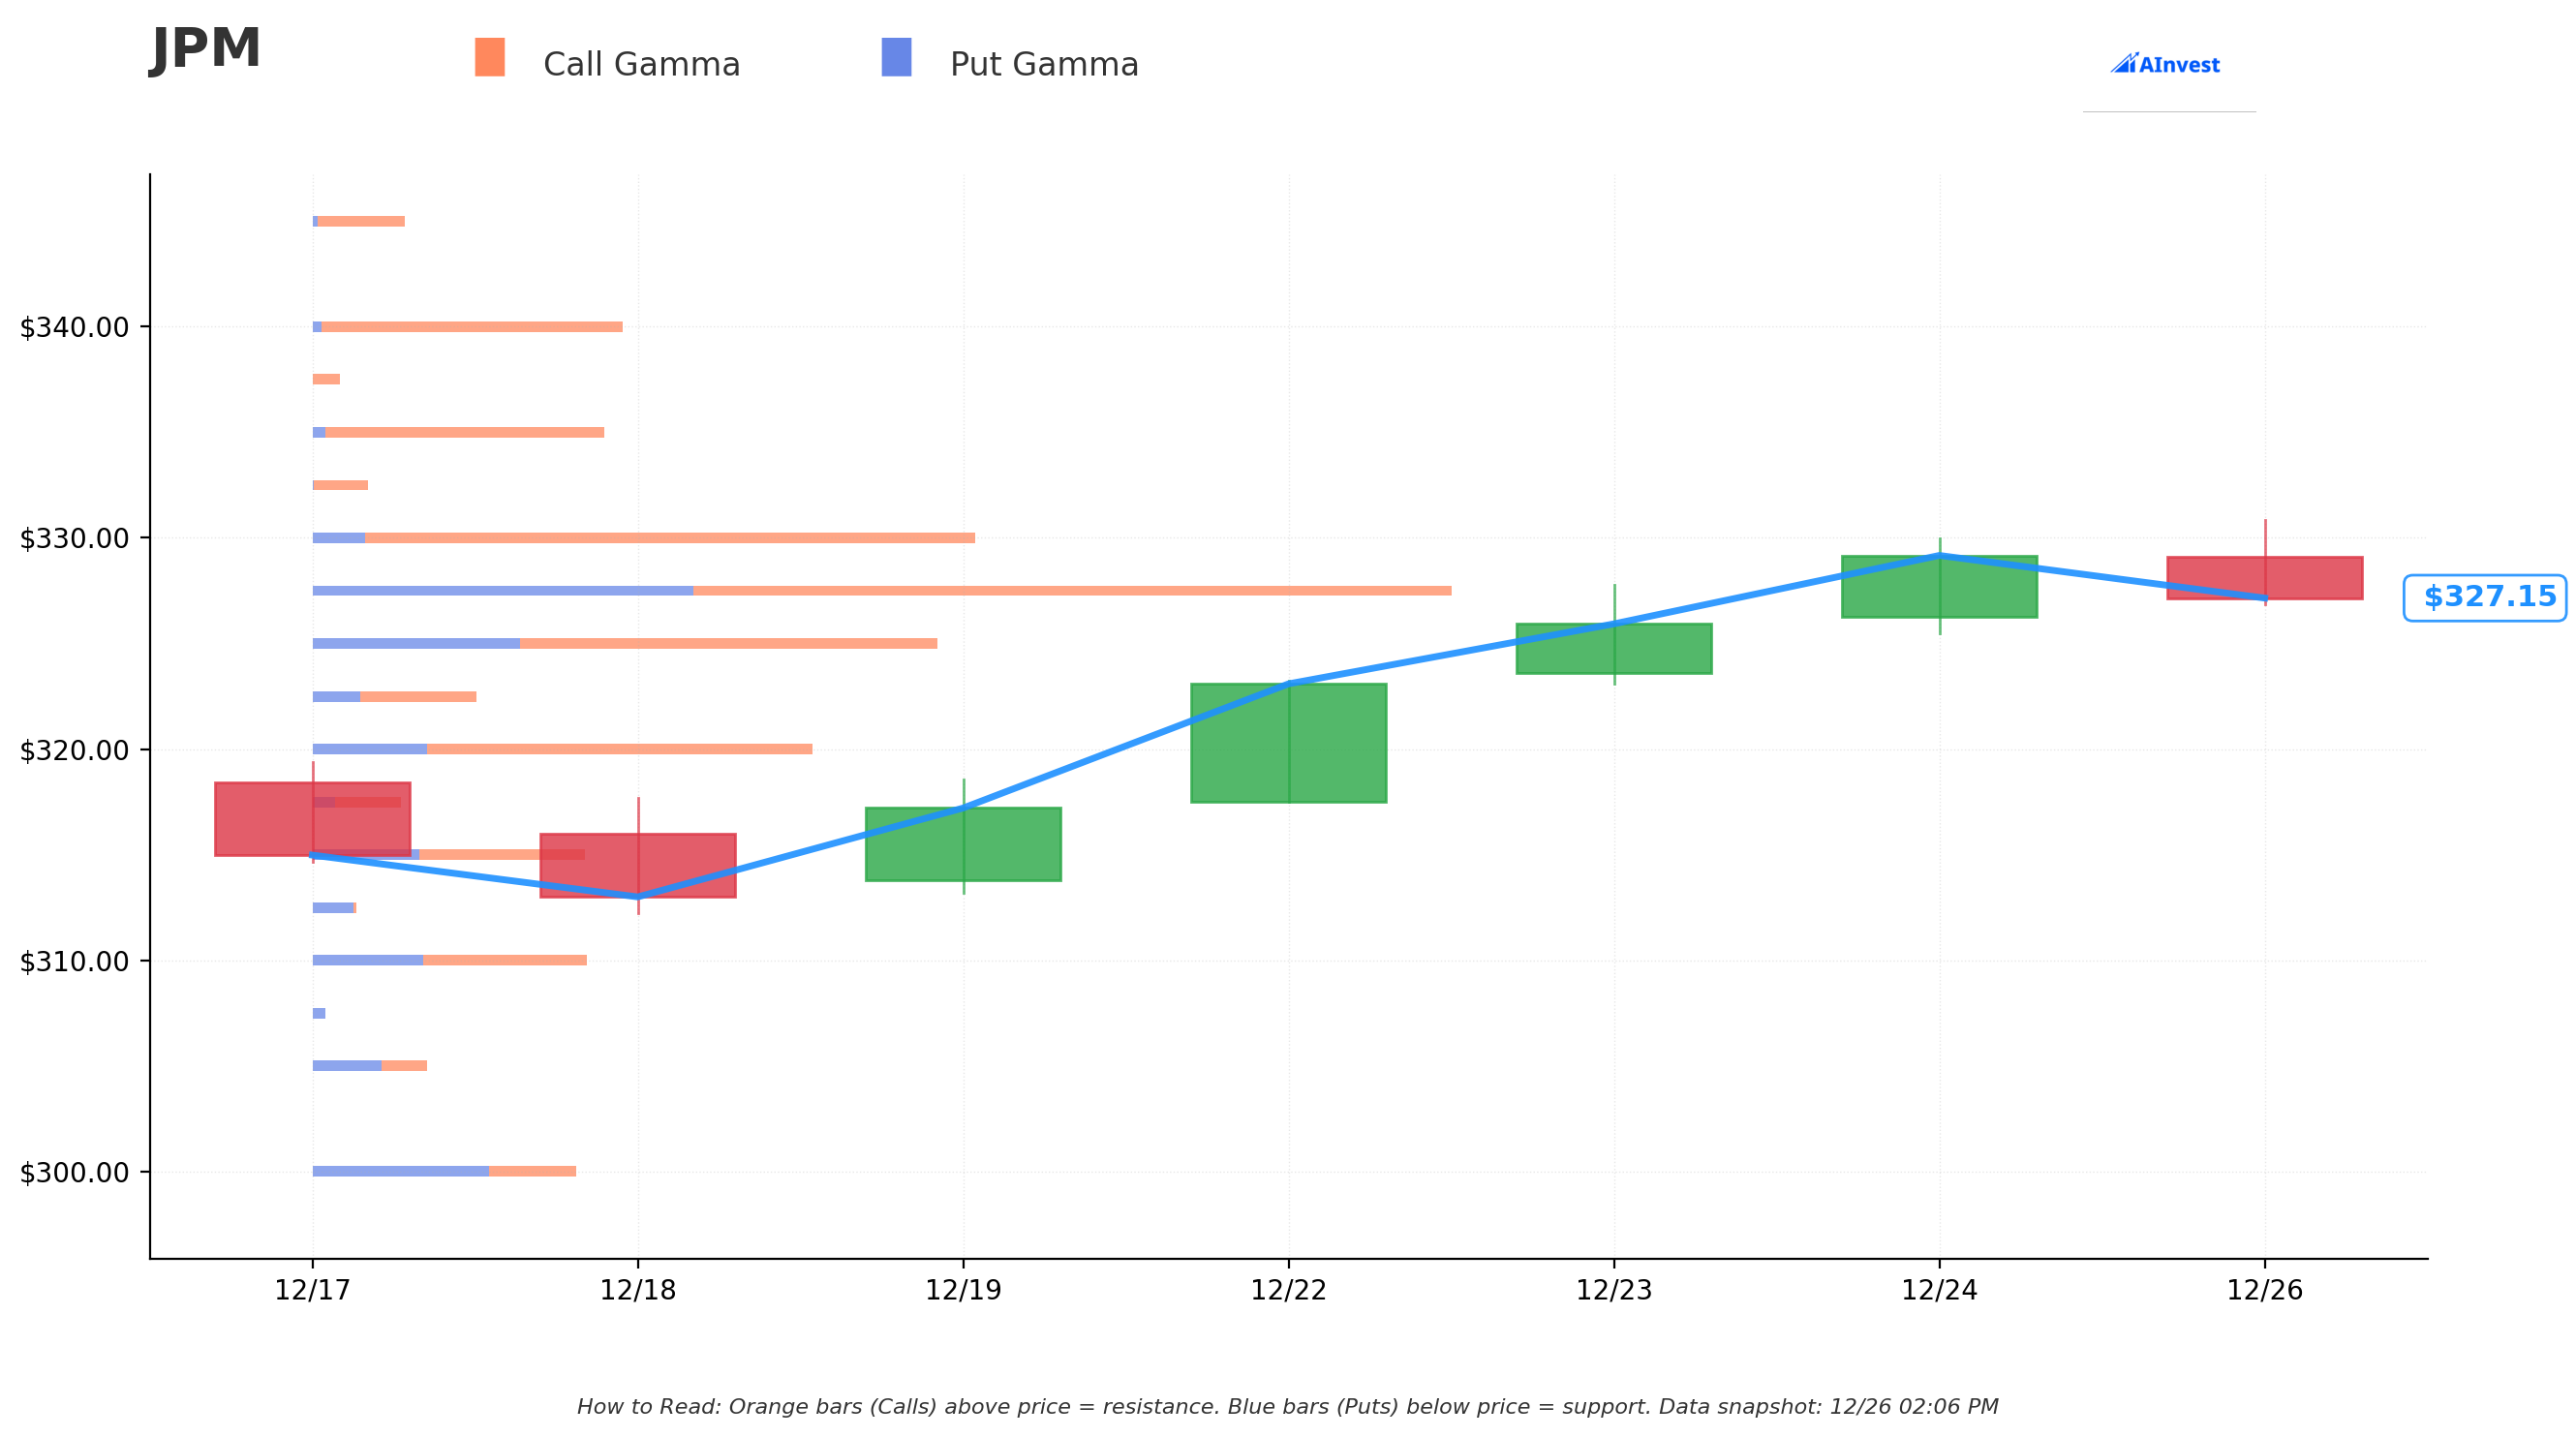
🔵 Support Levels (Put Gamma - Blue Bars):
- $327.50 - Strongest support with 1.0319 total gamma exposure (current battleground)
- $325 - Secondary floor with meaningful dealer positioning
- $320 - Major backstop if market pulls back
🟠 Resistance Levels (Call Gamma - Orange Bars):
- $330 - Immediate ceiling with heavy call gamma concentration
- $325 - Prior resistance now turned support (current price: $327.91)
- $320 - Was major resistance, now solid support zone
Net GEX Bias: Currently balanced with support cluster at $327.50
The gamma map shows JPM is sitting right on top of the highest gamma strike at $327.50 - this is the market's "center of gravity" where dealers are most hedged. Breaking cleanly above $330 opens up room to run toward $340-350 with less dealer resistance. The $360 target is well beyond current gamma positioning, suggesting this trader expects a regime change.
Implied Move Support & Resistance
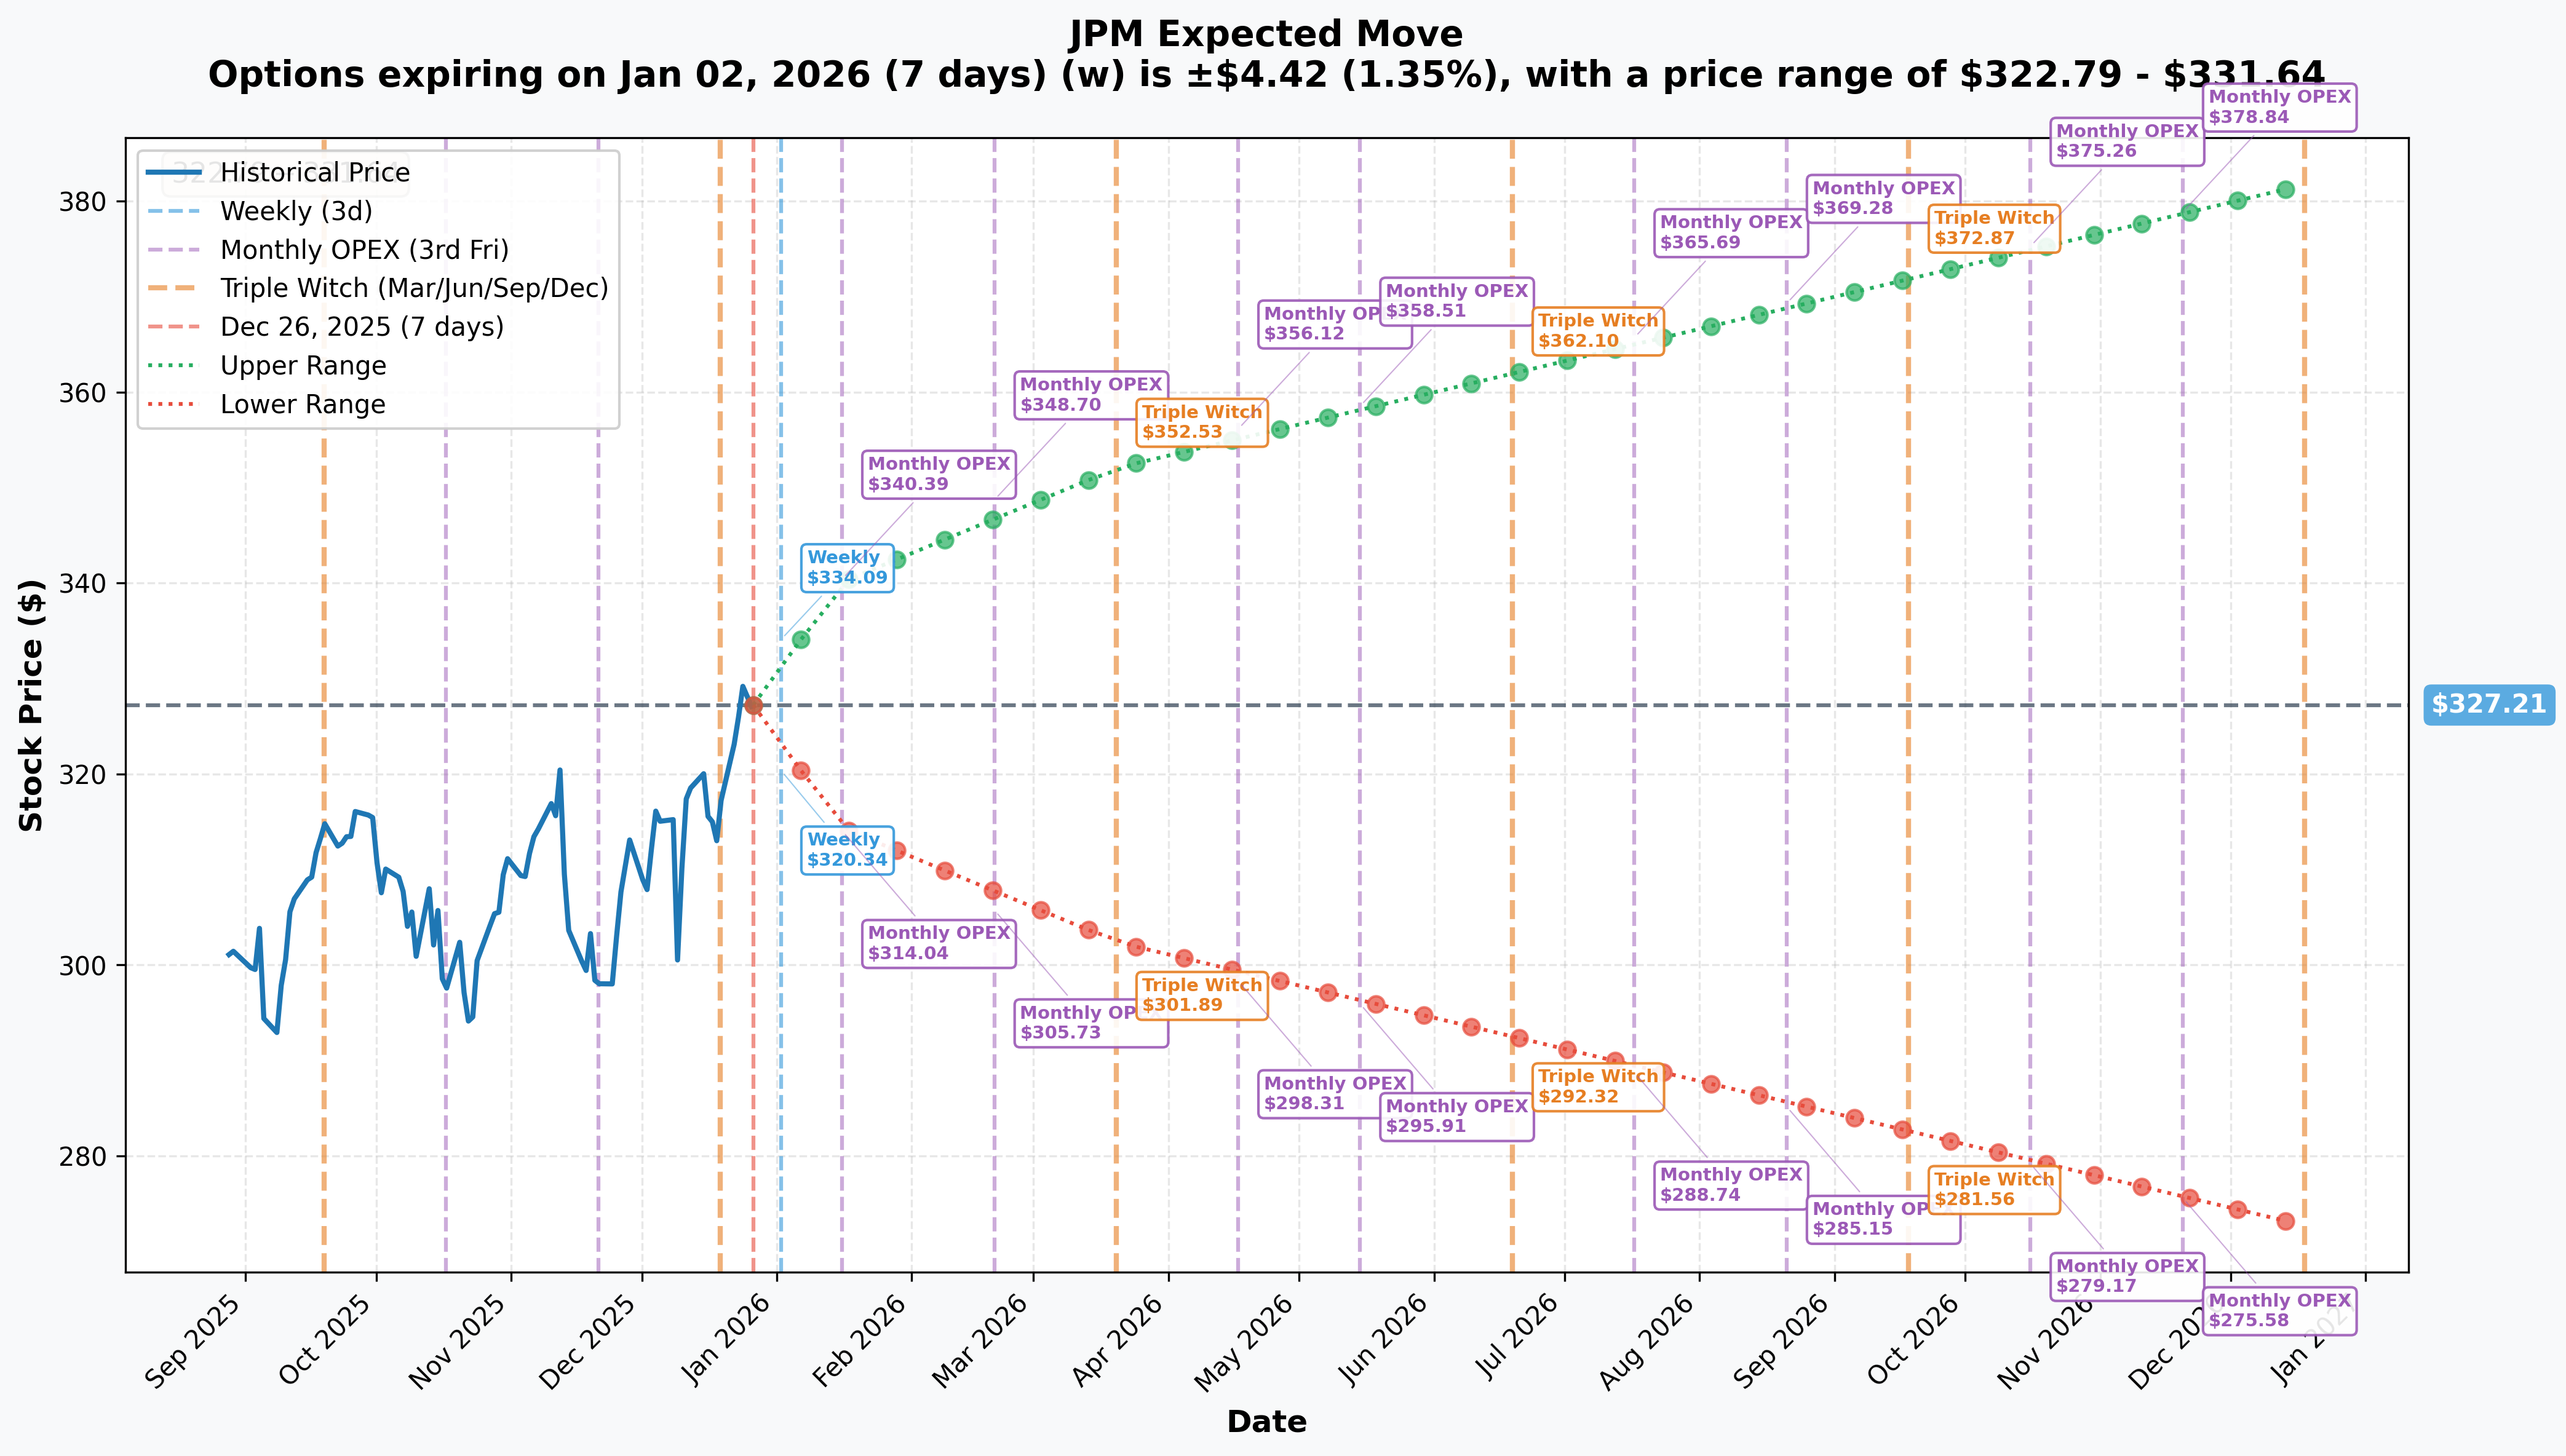
Implied Move for January 16, 2026 Monthly OPEX (21 days):
- Expected Range: $314.23 - $340.20 (±3.97% or ±$12.97)
- Upper Target: $340.20 - already pricing in potential breakout above $330
Key Price Zones:
- Weekly (Jan 2, 2026): $322.79 - $331.64 (±1.35%) - Tight range through year-end
- Monthly OPEX (Jan 16, 2026): $314.23 - $340.20 (±3.97%) - Near-term earnings volatility
- Quarterly Triple Witch (Mar 20, 2026): $302.33 - $352.10 (±7.60%) - $360 target enters realm of possibility
- Yearly LEAPS: ±16.68% - Pricing $274-$382 range over 12 months
The implied volatility market is pricing a ±7.60% quarterly move by March 2026, which translates to an upper bound of $352.10. The $360 LEAPS target is just 2.2% above that level - well within statistical reach if the bank delivers on Q4 2025 earnings and Basel III relief materializes.
For the full January 2027 expiration window, the yearly implied move suggests a range of approximately $274-$382, meaning the $360 strike sits comfortably in the upper quartile of expected outcomes, not some lottery ticket scenario.
🎪 Catalysts
✅ Already Happened (Recent Past)
Q4 2024 Earnings Blowout (January 15, 2025):
- Revenue: $43.74B vs $41.73B consensus (+10% YoY) - beat estimates
- Net Income: $14.0B (+50% YoY) - record quarter
- EPS: $4.81 vs $4.03 consensus (19.35% beat)
- Full-Year 2024 Net Income: $58.5B (record)
- Full-Year 2024 Revenue: $166.88B (+12.16% YoY)
Investment Banking Resurgence:
- IB fees: $2.48B (+49% YoY), beat $2.39B estimate
- Advisory fees: +41% YoY as M&A activity returned
- Fixed Income Trading: $5.0B (+20% YoY)
- JPM holds #1 investment banking fee share at 9.3%
Regulatory Environment Shift:
- U.S. banks added $600B in combined market value in 2025 on Trump deregulation expectations
- Jamie Dimon: "A lot of bankers are dancing in the streets" at promise of deregulation
- Basel III Endgame expected to be "capital neutral" vs original proposal requiring major capital increases
Stock Performance:
- Current Price: $329.17 (all-time high) as of December 24, 2025
- Market Cap: $896 billion - most valuable bank globally
- 12-Month Performance: +50%
First Republic Integration Complete:
- Integration is "largely over" as of late 2024
- 75% retention rate for advisors and clients from wealth division
- Assumed $92B in deposits and $173B in loans
Asset & Wealth Management Growth:
- AUM reached $4.0 trillion (+18% YoY) as of Q4 2024
- Client net inflows: $486B in 2024
- Management fees rose 21% YoY
📅 Upcoming (Next 13 Months - Trade Window)
Q4 2025 Earnings Report (January 13, 2026):
- Date: January 13, 2026, 8:30 AM ET
- Consensus EPS: ~$4.00-$4.50 (based on trailing trends)
- Key Metrics to Watch:
- Net Interest Income trajectory vs $90B guidance for 2025 (down from $92.5B in 2024)
- Investment banking fee momentum and 2026 M&A pipeline outlook
- Credit card charge-off rates (currently 3.6%)
- 2026 guidance and capital return plans
- Why It Matters: First major earnings catalyst within the LEAPS window. Strong results + optimistic 2026 guidance could spark rally toward $340-350.
Capital Returns Program:
- Dividend: $1.50/share quarterly ($6.00 annual), yield ~1.82%
- $50 billion buyback program authorized July 1, 2025 - ongoing through 2026-2027
- Replaced prior $30B program ($11.7B remaining as of March 2025)
- Why It Matters: Continuous buying pressure from buybacks provides technical support and accretive EPS growth.
Basel III Endgame Final Rules (Expected Q1-Q2 2026):
- Final rules delayed until 2026 at earliest; may never be finalized in original form
- Banks sitting on ~$200B in excess capital that can be deployed if rules soften
- Former Fed Vice Chair Barr signaled potential 50% scaling back of original proposal
- Why It Matters: If Basel III is watered down, JPM could massively increase buybacks/dividends. This is the "unlock" catalyst the LEAPS trader is betting on.
2026 Fed Stress Tests (Expected June 2026):
- 2025 results: JPM passed with 14.2% minimum CET1 ratio under severely adverse scenario
- Stress Capital Buffer (SCB): 2.5% for 2025 (down from 3.3% in 2024)
- Non-stress CET1 ratio: 15.4% (Q1 2025) = $54B capital cushion
- Why It Matters: Clean pass allows for dividend increases and accelerated buybacks in 2H 2026.
Investment Banking Recovery Continuation:
- M&A and IPO activity reviving after 2022-2023 drought
- Deal pipeline expected to strengthen through 2026 on improved CEO confidence
- Deregulation could accelerate financial sector M&A activity
- Why It Matters: IB fees are high-margin revenue. Sustained recovery could drive EPS beats and multiple expansion.
Federal Reserve Policy:
- Current Federal Funds Rate: 3.50%-3.75% (late 2025)
- J.P. Morgan Research expects two more cuts in 2025, one in 2026
- NII expected to trough mid-2025, then recover on loan growth
- Why It Matters: NII stabilization removes a major headwind and could trigger upward earnings revisions.
🎲 Price Targets & Scenarios
Based on gamma levels, implied move analysis, catalyst timing, and analyst targets, here's how this LEAPS call could play out over the next 13 months:
🐂 Bull Case (55% Probability): $370+ by Jan 2027
Target Zone: $370-390
What Needs to Happen:
- Q4 2025 earnings (Jan 13, 2026) beat expectations; management guides 2026 NII higher than feared
- Basel III Endgame rules finalized with major softening by Q2 2026, unlocking tens of billions for buybacks
- Investment banking fee growth sustains at 30%+ as M&A/IPO markets fully recover
- 2026 stress tests pass cleanly, allowing for dividend increase and buyback acceleration
- Stock breaks above $340 resistance on quarterly earnings beats, momentum carries to $360-370 range
Technical Path: $328 (current) → $340 (Q1 2026 breakout) → $350 (mid-2026 grind) → $360-370 (late 2026 Basel III catalyst)
Analyst Support:
- Average Price Target: $329-$333
- High Price Target: $363-$370 (this trade's range)
- Barclays PT: $342 (October 2025)
Trade Outcome:
- At $370: $1M profit (45% ROI on $2.2M investment)
- At $380: $2M profit (91% ROI)
- At $390: $3M profit (136% ROI)
⚖️ Base Case (30% Probability): $360-370 Range
Target Zone: Chop in $350-370 range, finish near breakeven
What Needs to Happen:
- Stock grinds higher on buybacks and steady fundamentals but faces multiple expansion limits
- Basel III softening happens but takes longer than expected (late 2026 vs mid-2026)
- NII stabilizes but doesn't meaningfully exceed expectations
- Investment banking recovery continues but at slower pace (20-30% growth vs 49%)
- Market rotates between value and growth; banks consolidate after 2025's massive run
Technical Path: $328 → $340 (Q1 2026) → $350 (consolidation) → $360 (grind by late 2026) → Expires near $362-368
Trade Outcome:
- At $362.20: Breakeven (0% ROI)
- At $365: $300K profit (14% ROI)
- At $368: $600K profit (27% ROI)
🐻 Bear Case (15% Probability): Below $360 at Expiry
Target Zone: $320-350 range
What Needs to Happen:
- Recession hits in 2026; credit card charge-offs spike above 4-5%, reserves surge
- Jamie Dimon's stagflation warning materializes; inflation + slow growth = NIM compression + loan losses
- Basel III Endgame passes in stricter-than-expected form, forcing capital conservation
- Investment banking recovery stalls as M&A market freezes again on macro uncertainty
- Dimon succession announcement creates leadership uncertainty, stock sells off
Technical Path: $328 → $310 (recession fears) → $300 (credit concerns) → Chop in $300-340 range through 2026
Trade Outcome:
- At $360 or below: Full loss of $2.2M (-100% ROI)
- At $350: Loss of $2.2M (-100% ROI)
- At $340: Loss of $2.2M (-100% ROI)
💡 Trading Ideas
🛡️ Conservative: Sell Cash-Secured Puts at Support
Strategy: Sell $320 Puts (March 2026 expiry) Premium: ~$3-4 per contract Max Profit: $300-400 per contract (premium collected) Max Risk: $320 per share if assigned (net cost basis $316-317) Breakeven: $316-317
Why This Works: You're betting JPM holds the $320 gamma support level (which has been rock-solid). If you get assigned, you're buying America's best bank at $316-317 - a level that's backed by massive put gamma positioning. You can then sell covered calls against the position.
Probability of Success: ~80% (JPM would need to crash 5%+ below current support for this to lose)
⚖️ Balanced: Diagonal Call Spread (LEAPS-Selling Strategy)
Strategy: Buy Jan 2027 $330 Call / Sell Monthly $335-340 Calls Structure:
- Long: Jan 2027 $330 Call (13 months, costs ~$18-20)
- Short: March 2026 $335 Call (3 months, collect ~$5-6)
- Repeat monthly call selling to reduce cost basis
Net Cost: ~$14 after first short call Max Profit: $5-10 per spread if stock stays $335-345 range Breakeven: $344 after collecting 3-4 months of premium
Why This Works: You own the same long-dated upside as the institutional trader (betting on $360 by 2027) but you're financing it by selling shorter-term calls. Each month you collect $500-600, reducing your cost basis. If JPM explodes past $360, you cap gains at $345-350 but still make 100%+ ROI.
Probability of Success: ~65% (benefits from time decay on short calls while keeping long-term upside)
🚀 Aggressive: Replicate the Flow (Smaller Size)
Strategy: Buy Jan 2027 $360 Calls (same as institutional flow) Cost: ~$22 per contract ($2,200 each) Position Size: 5-10 contracts ($11K-22K capital) Max Profit: Unlimited above $360 Breakeven: $382.20 Stop Loss: 50% if stock breaks below $315 or time decay exceeds plan
Why This Works: You're literally copying the smart money's homework. The institutional trader did the research and paid $2.2M for this conviction. You're piggybacking on their thesis with controlled size (1-2% of portfolio max).
Risk Management:
- Set mental stop at 50% loss ($1,100 per contract)
- Exit if JPM breaks below $315 support decisively
- Consider scaling out at $370 (take 50% off), let rest run to $380-400
Probability of Success: ~55% (high risk, high reward directional bet on deregulation + buybacks)
⚠️ Risk Factors
Execution Risks
Net Interest Income Decline: 2025 NII (ex-Markets) guided to ~$90B, down $2.5B YoY from $92.5B in 2024. Fed rate cuts are compressing net interest margin. If NII falls more than expected in 2026, it pressures EPS estimates and multiple expansion. Management expects NII to trough mid-2025 then recover, but if loan growth disappoints, recovery may not materialize.
Credit Card Charge-Offs Rising: Credit card charge-offs at 3.6% signal consumer stress. If unemployment rises or consumer spending cracks in 2026, charge-offs could spike to 4-5%+, forcing higher loan loss reserves and hitting earnings. The bank opened 10 million new card accounts in 2024, which could be a lagging indicator of credit quality deterioration.
Jamie Dimon Succession Uncertainty: Dimon (age 69) signaled retirement is "not five years anymore" and plans to stay "several more years" then potentially transition to Chairman. Key candidates include Marianne Lake (CCB CEO), Troy Rohrbaugh (CIB co-CEO), Douglas Petno (CIB co-CEO). If Dimon announces retirement within the LEAPS window, stock could sell off 5-10% on uncertainty.
Market Risks
Valuation at All-Time Highs: Stock trading at $329.17 (all-time high) with average analyst PT of $329-$333. This means consensus sees zero upside from current levels. The $360 target requires either multiple expansion (difficult after 50% rally) or significant earnings beats. Limited margin of safety if macro deteriorates.
Basel III Regulatory Risk: While softening is expected, final rules remain uncertain. If a stricter version passes (political winds shift, financial crisis occurs, etc.), banks would need to hold more capital, reducing ROE and limiting buybacks. This is the biggest binary risk to the bull thesis.
Macro Recession: Jamie Dimon has warned of stagflation risk and draws parallels to 1970s economic environment. If recession hits in 2026, loan losses surge, investment banking fees collapse, and stock multiples compress. Banks are cyclical - recession = pain.
Deregulation Disappointment: The Trump deregulation rally added $600B to bank market caps, but actual policy may underwhelm expectations. If Basel III passes in stricter form than anticipated or if political priorities shift away from bank deregulation, the "deregulation premium" evaporates and stocks give back gains.
Time Decay
Theta Burn: This LEAPS call has 385 days to expiration, so time decay is relatively slow initially but accelerates in the final 6 months. If JPM trades sideways at $325-335 for the first 6-9 months, the option loses significant extrinsic value even if the stock doesn't drop. By mid-2026, theta decay becomes a meaningful headwind unless the stock is moving toward $360.
🎯 The Bottom Line
Real talk: This $2.2M LEAPS call is a multi-year structural bet that JPMorgan continues to compound as the dominant financial institution in America, supercharged by regulatory relief, aggressive capital returns, and a recovering investment banking cycle.
Here's the situation:
✅ If You Own JPM: This flow validates your thesis. The institutional trader sees the same thing you do - record $58.5B net income, $50B buyback program ongoing, #1 IB fee share, and potential Basel III relief unlocking $200B in excess capital. Hold through volatility and let the buybacks do their work.
👀 If You're Watching: Mark your calendar for January 13, 2026 (Q4 2025 earnings) and Q2 2026 (Basel III final rules). If JPM beats earnings and Basel III gets watered down, this could be the setup for a 2026 rally to $360+. But if credit costs spike or NII disappoints, the stock may consolidate in the $320-340 range for months.
📉 If You're Bearish: The bear case requires believing that: (1) JPM's stock at all-time highs has no room to run, (2) recession/stagflation hits and credit losses surge, (3) Basel III passes in stricter form, killing buybacks, and (4) Dimon succession creates instability. That's a lot of dominoes that need to fall. The $320-325 support zone (backed by gamma + 50-day MA) won't break easily.
The Trade's Edge: This isn't a short-term gamble - it's a 13-month thesis with multiple catalysts (earnings, Basel III, stress tests, buybacks) that could drive the stock to $360-370. The trader paid $2.2M for 385 days of optionality on structural tailwinds. With analyst high PTs at $363-370, the target is achievable but requires execution.
Probability Math:
- Bull Case (55%): Deregulation + buybacks + IB recovery = $370+ (45-136% ROI)
- Base Case (30%): Slow grind to $360-365 range (0-27% ROI)
- Bear Case (15%): Macro shock or regulatory disappointment, stays below $360 (-100% ROI)
Expected Value: (0.55 × 91%) + (0.30 × 14%) + (0.15 × -100%) = +45% expected return
My Take: I'd lean toward a diagonal spread strategy (long Jan 2027 $330 call, sell monthly $335-340 calls) to capture the long-term thesis while reducing cost basis through premium collection. The pure LEAPS call makes sense if you have ultra-high conviction on Basel III softening + sustained buybacks driving the stock to $370+.
For more conservative traders, selling $320 cash-secured puts lets you get paid to wait at support levels with far less risk.
One thing's for sure: When someone bets $2.2 million on a 13-month window with this level of unusual activity, they've done serious homework. This isn't a YOLO - it's an institutional conviction trade. The question is whether you believe the same story.
📊 Company Overview
About JPMorgan Chase & Co. (JPM):
JPMorgan Chase is one of the largest and most complex financial institutions in the United States, with more than $4 trillion in assets. The firm operates across four primary business divisions: consumer and community banking, corporate and investment banking, commercial banking, and asset and wealth management. JPM is the #1 U.S. bank by assets and market cap, generating 21% ROTCE vs peers at 13-15%.
- Market Cap: $896 billion (as of December 26, 2025)
- Sector: National Commercial Banks / Financial Services
- YTD Performance: +50% (December 2025)
- Q4 2024 Revenue: $43.74B (+10% YoY)
- Key Strengths: Investment banking dominance, asset management scale ($4T AUM), fortress balance sheet, diversified revenue streams
📎 Option Details
LEAPS Call: Chart Analysis - $360 Strike, Jan 2027 Expiry
Full Stock Analysis: JPM Deep Dive
Catalyst Deep Dive:
See /Users/wenchenli/projects/option_trader/agent/UOA/20251226/JPM/JPM_catalysts.md for full research report with 16+ sources.
⚠️ Disclaimer: This analysis is for educational and informational purposes only and should not be considered financial advice. Options trading involves substantial risk of loss and is not suitable for all investors. LEAPS options can expire worthless, resulting in 100% loss of premium paid. Past performance does not guarantee future results. Always conduct your own research and consult with a licensed financial advisor before making investment decisions. The author may or may not hold positions in the securities discussed.
Analysis Date: December 26, 2025 Data Sources: Option flow data, JPM catalysts research report, gamma exposure analysis, implied volatility data, company filings (Q4 2024 earnings), analyst reports, and market data as of December 26, 2025