🏦 KRE $6.7M Bear Put Spread Unwind: Institutional Trader Closes Regional Bank Hedge | 2026-03-09
📅 March 9, 2026 | 🔍 Major Position Closing Detected
🎯 The Quick Take
Someone just closed a $6.7 million bear put spread on the SPDR S&P Regional Banking ETF (KRE), unwinding downside protection on regional banks. The trader bought to close a $63 put and sold to close a $60 put -- both legs of what was originally a bearish bet against KRE. With the ETF trading at ~$63.37 and regional banking stocks sitting on top of a $1.5 trillion CRE maturity wall, this unwind could mean the worst is already priced in -- or this trader is rotating into a different hedge entirely.
Either way, a Z-score of 8.08 on the short put leg means this kind of volume almost never happens. Pay attention.
📊 What Is KRE?
The SPDR S&P Regional Banking ETF (KRE) tracks the S&P Regional Banking Select Industry Index, giving you exposure to 146 regional bank stocks using a modified equal-weight methodology. Unlike XLF, which is dominated by JPMorgan, Berkshire, and Visa, KRE gives every regional bank roughly the same voice in the portfolio.
Key Stats:
- AUM: $4.32 billion
- 52-Week Range: $47.06 - $74.08
- YTD Return: +13.33%
- Top Holdings: Popular Inc (2.18%), Webster Financial (2.11%), Valley National Bancorp (2.08%), M&T Bank (2.03%), Cullen/Frost Bankers (2.03%)
- Current Price: ~$63.37
Think of KRE as the pulse of Main Street banking. When regional banks do well, it means loans are flowing, deposits are stable, and the American economy is humming at the ground level. When they struggle, it's usually a sign of credit stress or rate pain rippling through the real economy.
💰 The Option Flow Breakdown
📋 Full Trade Table
| Time | Symbol | Buy/Sell | Call/Put | Expiration | Strike | Volume | Premium | Order Type | Strategy | Z-Score |
|---|---|---|---|---|---|---|---|---|---|---|
| 12:43:13 | KRE | BUY | PUT | 2026-05-15 | $63 | 13,000 | $4.5M | BTC | Close Long Put | 4.25 |
| 12:43:13 | KRE | SELL | PUT | 2026-04-17 | $60 | 14,000 | $2.2M | STC | Close Short Put | 8.08 |
Total Premium: $6.7M across 27,000 contracts
🤓 Decoding the Trade
Let's break this down so it actually makes sense.
This trader originally held a bear put spread on KRE -- a classic directional bearish bet:
- Long the $63 put (May expiration) -- profits if KRE falls below $63
- Short the $60 put (April expiration) -- caps the downside profit at $60, reducing cost
Now they are closing both legs simultaneously:
- BTC (Buy to Close) the $63 long put -- selling back the put they owned
- STC (Sell to Close) the $60 short put -- buying back the put they sold
This is a complete position unwind. The trader is taking chips off the table on their regional bank bearish bet. The question is: why now?
Three possible explanations:
-
Profit-taking -- If they entered this spread before the March 2 crash (when KRE plunged 5%), they likely made good money and are now locking in gains. Smart.
-
The worst is priced in -- They may believe the CRE maturity wall, geopolitical risk, and tariff fears are already reflected in KRE's current price. No need to stay hedged if the downside is fully baked.
-
Rolling into a different hedge -- They might be closing this spread to open a new position with different strikes, expirations, or even a different instrument entirely. The hedge isn't gone -- it's evolving.
The 8.08 Z-score on the short put leg is screaming: this volume is 8 standard deviations above normal. We are firmly in "extremely unusual" territory. Institutions don't close $6.7M positions casually.
📈 YTD Chart Analysis
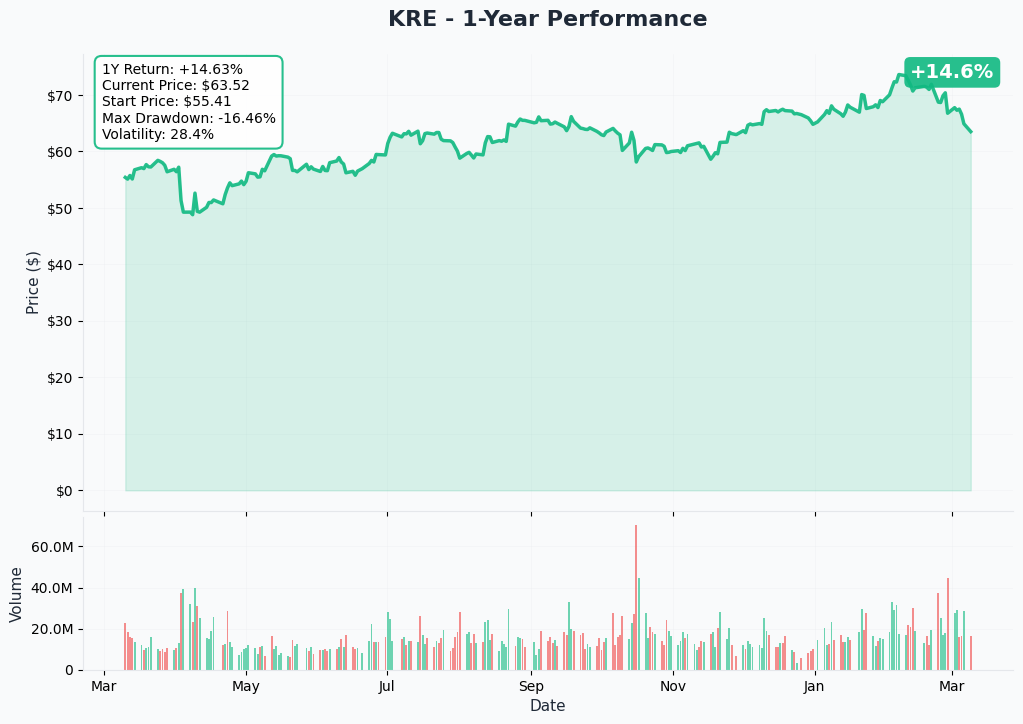
The chart tells a turbulent story. KRE was on a tear in January, pushing toward its 52-week high of $74.08 on the back of M&A euphoria and deregulation optimism. Then reality hit.
The March 2 selloff was the defining moment -- a brutal 5% single-day plunge triggered by the geopolitical shock of "Operation Epic Fury" (a joint U.S.-Israeli military operation against Iran that effectively closed the Strait of Hormuz) colliding with renewed fears about the $1.5 trillion CRE debt maturity wall. It was the worst single-day selloff for regional banks since mid-October 2025.
Since then, KRE has stabilized around $63-$65, finding a floor near its 200-day SMA of $62.63. The current price of ~$63.37 sits:
- 12.4% below the 52-week high of $74.08
- 34.6% above the 52-week low of $47.06
- Roughly at the critical 200-day moving average support zone
The takeaway: KRE has undergone a significant correction but hasn't broken down catastrophically. The trader closing this bear put spread may be reading the chart and concluding that the downside momentum is exhausted -- at least for now.
🎪 Gamma-Based Support & Resistance Analysis
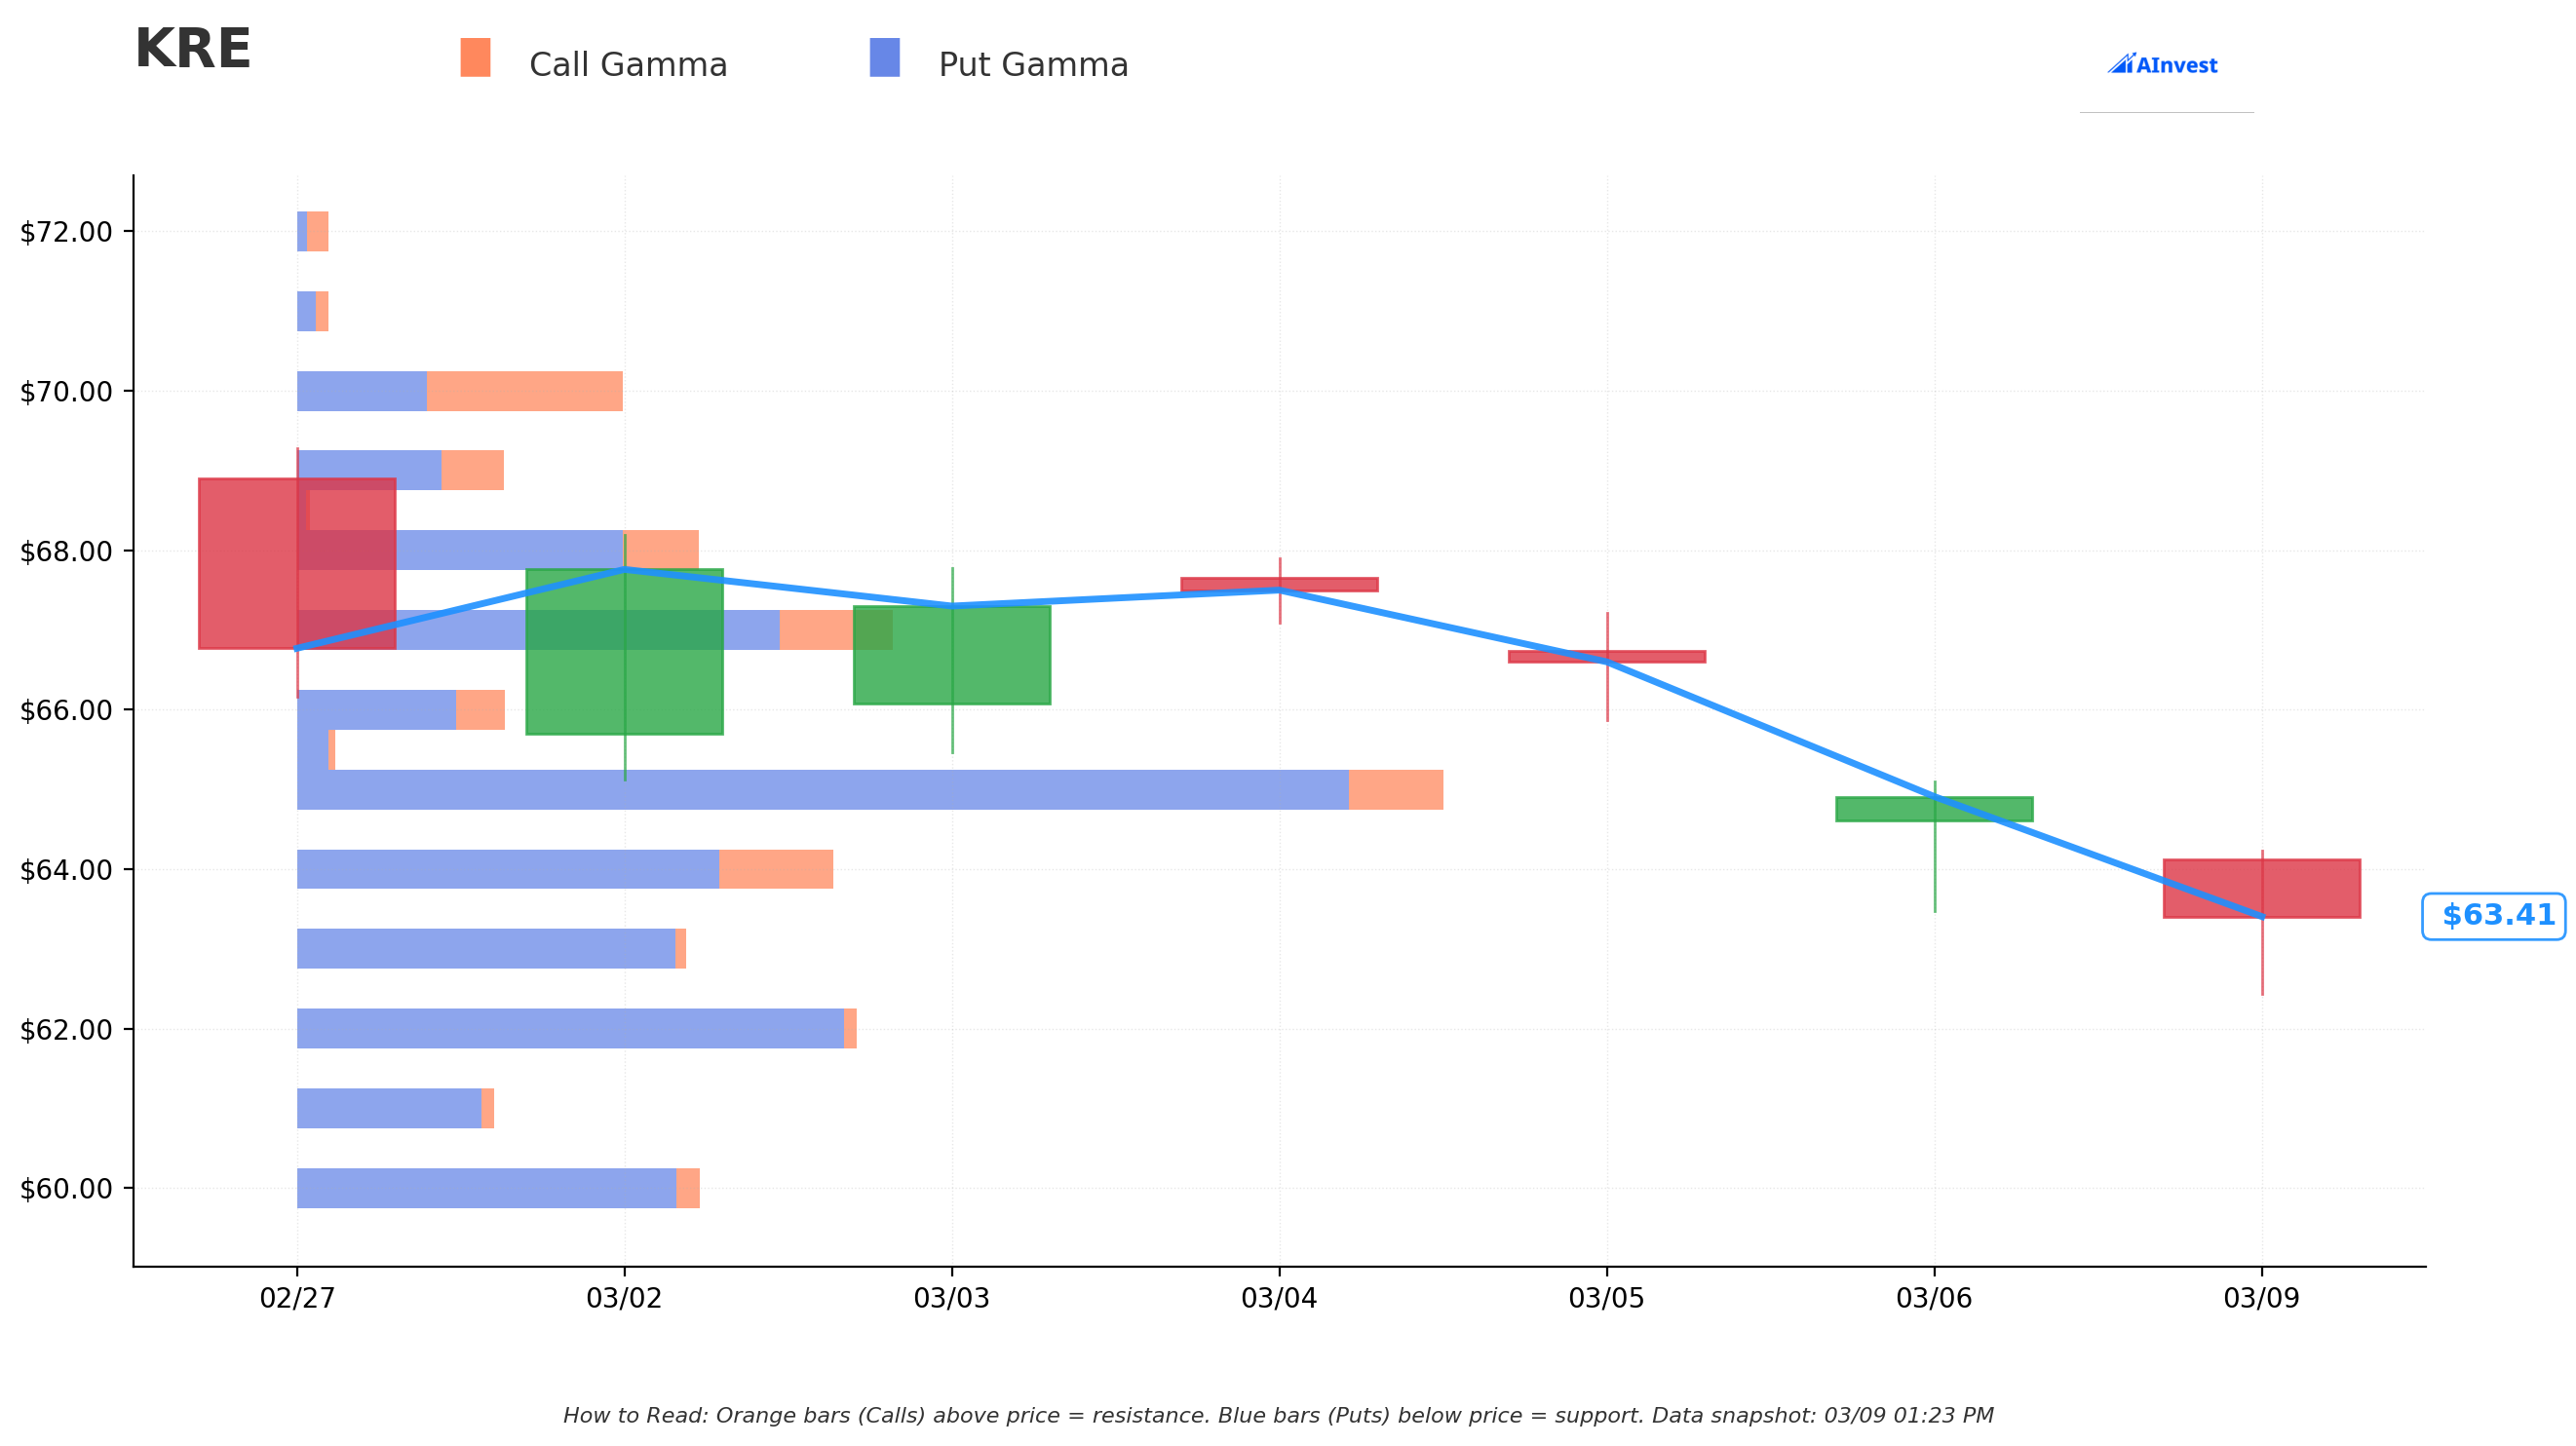
Gamma levels reveal where options market makers will be forced to buy or sell shares to hedge their positions. Think of them as invisible walls on the price chart.
🔵 Put Gamma (Support Levels Below Current Price)
The blue bars below $63.37 show where the market has built defensive walls:
-
$63 -- IMMEDIATE SUPPORT 💪 Right below current price with $25.7B in gamma exposure. This is the short strike of the closed bear put spread -- and it's acting as a magnetic floor. Market makers are positioned to buy shares aggressively near this level, creating natural support.
-
$62 -- STRONGEST SUPPORT ZONE 🛡️ The heaviest gamma concentration at $37.1B. This aligns almost perfectly with the 200-day SMA ($62.63). If $63 breaks, this is where the cavalry arrives. Market makers become forced buyers here, making it extremely difficult for KRE to punch through cleanly.
-
$60 -- DEEP SUPPORT Another $26.6B gamma wall. This was the long put strike in the closed spread -- and it represents the "worst case" level the original trader was protecting against. There is real institutional interest defending this price.
🟠 Call Gamma (Resistance Levels Above Current Price)
Orange bars above $63.37 reveal where rallies might stall:
-
$64 -- IMMEDIATE RESISTANCE First ceiling with $35.4B in total gamma. KRE needs to push through here convincingly before any relief rally gets traction.
-
$65 -- MAJOR RESISTANCE The biggest gamma concentration on the entire chart at $75.5B. This is where call sellers are stacked deep. Breaking above $65 would be a meaningful technical signal -- but getting there will not be easy.
-
$67-$68 -- UPPER RESISTANCE BAND Secondary resistance levels. If KRE can reclaim these, it starts to rebuild the technical damage from the March crash.
-
$70-$75 -- RECOVERY TARGETS Call gamma at $70 and $75 represents the old trading range. Getting back here would require a genuine shift in sentiment -- something like a CRE refinancing solution or a major Fed rate cut.
🎯 Net GEX Bias: Bearish
The overall gamma exposure is bearish, meaning put gamma dominates. Here's what that means in practice: market makers are short puts across KRE's options chain, which means they are short delta -- they need to buy shares when KRE drops and sell when it rallies. This creates a dampening effect on both directions but provides natural support on dips.
For the closed bear put spread: the trader was likely watching these gamma levels and concluded that the $62-$63 support zone is strong enough to limit further downside, making the hedge less necessary.
📊 Implied Move Analysis
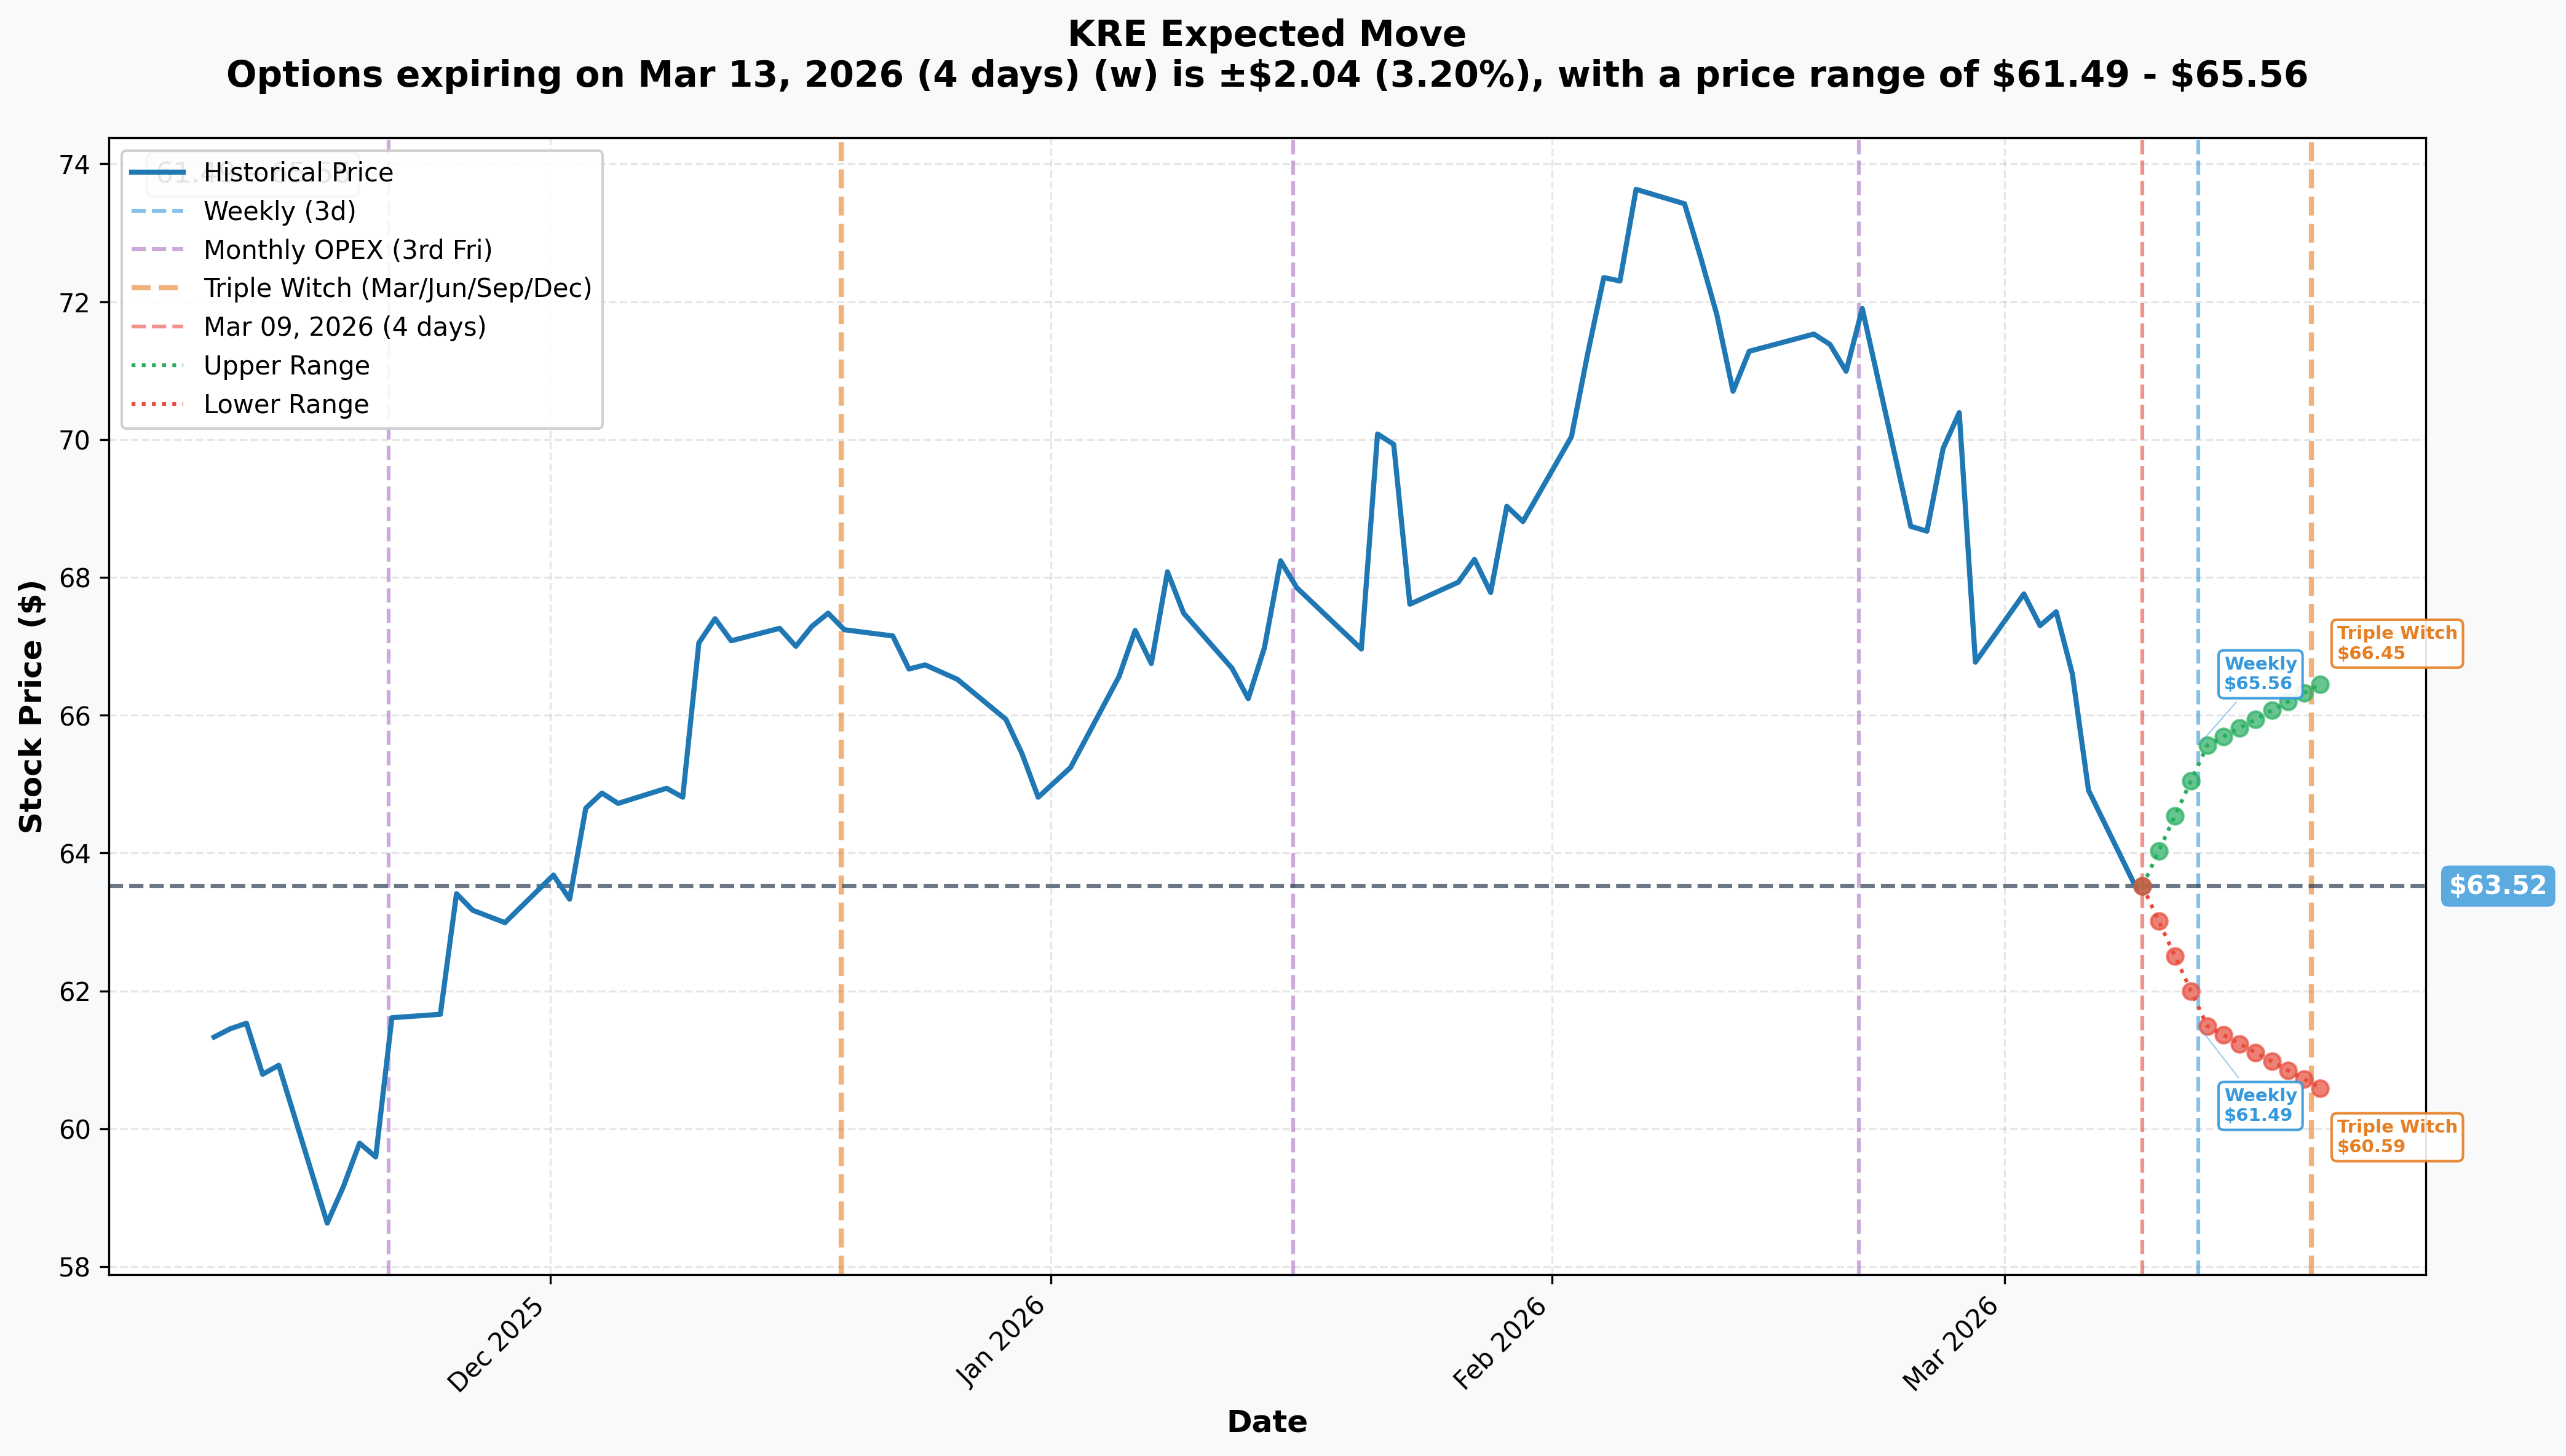
The options market is pricing in meaningful volatility for KRE over the coming weeks. Let's walk through what the implied move data is telling us.
📅 Weekly (March 13, 2026): ±3.20%
Expected Range: $61.49 - $65.56
A ±3.20% weekly implied move is elevated for an ETF. For context, SPY typically trades with weekly implied moves of ±1-2%. The market is saying KRE could swing $2 in either direction by Friday. The lower bound of $61.49 would briefly breach the $62 gamma support -- but wouldn't reach the old $60 spread strike. The upper bound of $65.56 would break through $64 resistance and test the $65 gamma wall.
📅 Monthly OPEX / Triple Witch (March 20, 2026): ±4.61%
Expected Range: $60.59 - $66.45
This is the big one. March 20 is Triple Witch -- quarterly options, index options, and futures all expire simultaneously. The implied range expands to nearly ±$3, which means the market sees a scenario where KRE could test the $60 level (the old long put strike) or rally back to $66.
Critical observation: The closed bear put spread had its long leg at $60 April and short leg at $63 May. The monthly OPEX implied move range says $60.59 is the floor -- suggesting the original spread was well-structured to capture a downside move that the market currently considers the outer boundary of likely outcomes.
🎲 What This Tells Us About the Closing Trade
The trader closed a spread with strikes at $63/$60. The current implied move suggests:
- $63 is essentially the center of the expected range -- a coin flip whether we finish above or below
- $60 is near the extreme lower bound -- a low-probability destination
If the trader entered this spread when KRE was at $70+, the move to $63 may have already delivered most of the expected profit. Closing now, with $63 as the midpoint rather than a deep out-of-the-money target, makes sense from a risk/reward perspective.
🎪 Catalysts: What Could Move KRE
📊 CRE Maturity Wall -- The Elephant in the Room
This is the single most important macro catalyst for regional banks in 2026. Approximately $1.5 trillion in commercial real estate loans mature this year, with roughly one-fifth tied to office properties where vacancy rates hover near 20%. Many of these loans were originated in the low-rate era and simply cannot be refinanced at current rates.
The numbers are sobering: S&P Global projects loan-loss provisions could rise to 24% of net revenue in 2026, up from 20.8% in 2025. Among the largest 158 U.S. banks, 59 have CRE exposures exceeding 300% of equity capital. The most exposed names within KRE -- Flagstar, Zions, Synovus, Valley National -- are sitting on concentrated risk.
Why this matters for the trade: The trader closing their bear put spread might believe CRE losses will be manageable and absorbed gradually, rather than triggering a 2023-style panic. If they're right, KRE has already priced in the worst.
📅 CPI Report -- March 12 (Wednesday)
Inflation data drops just three days from now. For regional banks, CPI matters because it drives the Fed's rate path, which directly impacts net interest margins. A hot CPI print keeps rates elevated -- mixed for banks (good for loan yields, bad for deposit costs and CRE refinancing). A cool print raises rate-cut odds, which would be broadly positive for CRE borrowers struggling to refinance.
🏛️ FOMC Meeting -- March 18-19
The Fed decision lands one week before the March 20 Triple Witch expiration. Current Fed funds futures price in two 25 bps cuts in 2026, likely beginning in the spring. If the Fed signals readiness to cut at this meeting, it would be a major relief valve for regional banks -- lower rates make CRE refinancing more viable and reduce deposit cost pressure.
However, the Fed's own dot plot shows just one cut in 2026. A hawkish hold could send KRE retesting the $60 support level.
🏗️ Basel III Endgame Finalization -- Early 2026
U.S. regulators plan to publish the final Basel III rule package with a three-year phased rollout. The Trump administration is pushing a "capital-neutral" approach that could reduce capital charges for banks with over $100 billion in assets, while smaller regionals would be largely exempt.
Net impact: Positive for KRE. Lighter capital requirements free up capital for lending, buybacks, and dividends. This is one of the key bullish catalysts that may have prompted the trader to close their bearish hedge.
🏢 Q1 2026 Earnings Season -- April
Regional bank earnings will be the next major fundamental test. Key metrics to watch:
- Regions Financial (RF): Consensus 2026 EPS of $2.58; NIM guided at ~3.70%
- Citizens Financial (CFG): Guiding NIM expansion of ~4-5 bps per quarter toward 3.25% by year-end
- PNC Financial (PNC): Record revenue year in 2025, NIM expanding as fixed-rate assets reprice
If earnings show that CRE provisions are manageable and NIM expansion is real, KRE could rally sharply. If provisions blow out, watch below.
🤝 M&A Consolidation Wave
U.S. bank M&A hit a 7-year high in early 2026 as regulatory approval times plummeted from 18 months to 3-6 months. Major deals include:
- Fifth Third + Comerica ($10.9B) -- closed February 1, creating the 9th-largest U.S. bank
- Santander + Webster Financial ($12.3B) -- expected to close H2 2026. Webster is KRE's #2 holding at 2.11% weight -- upon closing, it exits the index.
- PNC + FirstBank ($4.1B) and Prosperity + Stellar ($2.02B)
This wave of consolidation puts a floor under KRE because acquisition premiums boost the ETF's NAV, and the market loves the "who's next?" speculation game. Could be another reason the trader closed their bearish bet.
⚡ Tariff & Geopolitical Risk
Tariff-driven recession risk could strain credit quality across regional banks, particularly those exposed to Midwest agriculture and manufacturing. U.S. bank earnings could decline ~2% from tariff impacts alone.
Meanwhile, the aftermath of "Operation Epic Fury" continues to create oil price volatility and macro uncertainty. Any escalation would hit risk assets broadly, with regional banks particularly vulnerable.
🎯 Price Targets & Scenario Analysis
🟢 Bull Case (30% Probability): KRE to $68-$70
What drives this:
- FOMC signals rate cuts at March meeting
- Q1 earnings show NIM expansion and manageable CRE provisions
- Basel III finalization comes in "capital-neutral" as expected
- M&A premium speculation lifts sentiment
Key levels to watch: Break above $65 gamma resistance (the big one) would trigger a squeeze higher. Next stop $67-$68, then $70.
For the closed trade: The trader who closed their bear put spread looks like a genius. They avoided the reversal and freed up capital.
🟡 Base Case (45% Probability): KRE range-bound $60-$65
What drives this:
- CPI comes in mixed, Fed stays on hold
- Earnings are decent but CRE provisions edge higher
- Market digests the geopolitical shock without panic
- KRE oscillates between $62 gamma support and $65 gamma resistance
Key levels to watch: $63 becomes the pivot. Above $63, bulls have the edge. Below $63, bears start pressing.
For the closed trade: Reasonable exit. The spread was near max profit with KRE at $63.37 (essentially at the short strike), and remaining theta decay wasn't worth the risk of a reversal.
🔴 Bear Case (25% Probability): KRE to $56-$60
What drives this:
- CRE maturity wall triggers multiple bank-specific credit events
- Fed stays hawkish, rates remain elevated through year-end
- Tariff escalation causes economic slowdown
- Contagion fear -- another regional bank failure triggers deposit flight
Key levels to watch: Break below $60 gamma support opens the door to $56-$58. Below that, the 2023 crisis lows near $47 become a psychological magnet.
For the closed trade: If this scenario plays out, the trader left money on the table by closing early. But risk management means you don't always hold to max profit. Locking in gains and living to trade another day is the professional move.
💡 Trading Ideas
🛡️ Conservative: "Wait for CPI, Then Buy the Dip"
For traders who want KRE exposure with a margin of safety.
Wait for Wednesday's CPI report. If the data comes in cool (below 3.0% headline) and KRE dips toward the $62 gamma support zone, buy shares with a defined risk plan:
- Entry: $62.00-$62.50 (near 200-day SMA and strongest gamma support)
- Stop Loss: $59.50 (below all gamma support levels)
- Target 1: $65.00 (gamma resistance test, +4%)
- Target 2: $68.00 (50-day SMA reclaim, +9%)
- Risk/Reward: Risking ~$2.50 to make $3-$6 (1.2:1 to 2.4:1)
Why it works: You're buying at a level where market makers are forced buyers, the 200-day SMA provides technical support, and CPI data gives you a catalyst for entry timing. The closed bear put spread at $63/$60 tells you someone with $6.7M at risk thinks the downside below $60 is limited.
Position size: Risk 2% of portfolio max. On a $50,000 account, that's roughly 400 shares with the $59.50 stop.
⚖️ Balanced: "The Volatility Crush Play"
For traders who think KRE will stay range-bound through March OPEX.
With implied volatility elevated and Triple Witch approaching March 20, sell a short iron condor to harvest premium:
- SELL KRE March 20 $60 Put
- BUY KRE March 20 $58 Put (protection)
- SELL KRE March 20 $66 Call
- BUY KRE March 20 $68 Call (protection)
- Net Credit: ~$0.40-$0.60 per iron condor
- Max Risk: $1.40-$1.60 per spread
- Breakeven Range: $59.40 - $66.60
Why it works: The $60 put strike sits at deep gamma support (the same level the institutional trader was protecting with their spread). The $66 call strike is above the $65 mega-gamma wall. The implied move says $60.59-$66.45 is the expected range -- and your iron condor is set just outside that. You profit from time decay and volatility crush after Triple Witch.
Position size: Risk 3% of portfolio max. On a $50,000 account, trade 8-10 iron condors ($1,400-$1,600 max risk).
🔥 Aggressive: "The CRE Survival Trade"
For traders who believe regional banks will survive the CRE maturity wall and re-rate higher.
If you think the March crash was a buying opportunity and regional banks can digest CRE losses without systemic failure, go long with a risk reversal:
- SELL KRE May 15 $58 Put (collect premium, willing to buy at $58)
- BUY KRE May 15 $67 Call (upside exposure to recovery)
- Net Cost: Near zero or slight credit
- Max Profit: Unlimited above $67
- Max Risk: Put assignment at $58 if KRE tanks (you own shares at a 8.5% discount)
Why it works: The trader who just closed their May $63 put at $4.5M was paying elevated premiums for downside protection. By selling a put at $58, you're getting paid to take the other side of that fear. The call at $67 gives you exposure to the recovery rally if Q1 earnings deliver and the CRE wall proves manageable.
The thesis: Stanley Druckenmiller bought $123M in KRE shares betting on deregulation. Citizens Financial is guiding NIM to 3.25% by year-end. M&A is at a 7-year high. If the CRE wall is a slow burn rather than a sudden collapse, this trade prints.
Position size: This is a high-conviction play. Risk no more than 5% of portfolio on the put assignment obligation. On a $50,000 account, sell 4-5 puts max ($23,200-$29,000 assignment exposure).
⚠️ Risk Factors
🏢 CRE Credit Crisis
This is NOT the same risk as 2023. The SVB crisis was a duration/liquidity problem that the Fed could solve with the Bank Term Funding Program. The 2026 CRE issue is a credit quality crisis -- whether borrowers can actually repay. The Fed cannot directly fix that. There is currently no BTFP-style backstop, and the Discount Window carries stigma that banks avoid.
Fed stress tests found significant CRE stress could generate $80 billion in banking industry losses. Among KRE constituents, the most vulnerable are banks with CRE concentrations exceeding 300% of equity capital.
📉 Consumer Credit Deterioration
Consumer delinquencies are at their highest level in nearly a decade. Credit card charge-offs hit 4.03% in Q4 2025, and aggregate delinquency touched 4.8% of outstanding debt. Stress is concentrated in younger borrowers and lower-income households -- exactly the demographics that regional banks serve.
🌊 Tariff-Driven Economic Slowdown
U.S. bank earnings could decline ~2% from tariff impacts. Midwest agricultural banks and manufacturing-exposed lenders are most vulnerable. Tariffs reduce consumer purchasing power, which dampens loan demand for autos and housing -- regional banks' bread and butter.
🏛️ M&A Integration Risk
The Fifth Third + Comerica merger created a $294B-asset behemoth with a full systems conversion expected over Labor Day weekend 2026. Integration failures in banking can be catastrophic. Meanwhile, Webster Financial's acquisition by Santander will remove KRE's #2 holding from the index upon closing.
🦢 Contagion Risk
Metropolitan Capital Bank & Trust failed on January 30, 2026 -- a small bank at $261M in assets, but bank failures have an outsized psychological impact. Without a BTFP backstop, any larger bank failure could trigger deposit flight to money market funds and "too big to fail" banks, accelerating the stress on regional bank funding costs.
📊 NIM Squeeze Scenario
The "2026 Banking Twist": the yield spread between short-term and long-term rates has narrowed, with the 10-year Treasury yield at ~4.09% while short-term repo funding costs sit at ~4.2%. If deposit costs stay sticky while loan yields compress, NIM gets squeezed -- and that directly hits bank profitability.
🎯 The Bottom Line
Here's what we know: An institutional trader just closed a $6.7 million bear put spread on regional banks, with the short put leg registering a Z-score of 8.08 -- volume that is truly extraordinary. They originally bet on KRE falling from the $63 area toward $60, and now they're taking that bet off.
What this signals:
The closing trade tells us that at least one sophisticated player believes the downside risk in regional banks has diminished -- or at minimum, that the risk/reward of holding the hedge no longer justifies the capital commitment. With KRE sitting right at $63.37 (essentially at the short strike of the closed spread), the trade likely delivered solid returns from the March 2 selloff, and the trader is harvesting those gains.
The bigger picture is nuanced:
- ✅ Bull case strength: M&A at 7-year highs, NIM expansion guidance from major holdings, Trump-era deregulation providing structural tailwinds, Druckenmiller's $123M conviction bet, and gamma support stacking up at $62-$63
- ❌ Bear case strength: $1.5 trillion CRE maturity wall without a Fed backstop, consumer delinquencies at decade highs, tariff uncertainty, and loan-loss provisions projected to hit 24% of net revenue
⏰ Mark Your Calendar
- March 12 (Wed): CPI report -- direct impact on Fed rate path and CRE refinancing math
- March 18-19 (Tue-Wed): FOMC meeting -- rate decision and dot plot update
- March 20 (Thu): Triple Witch expiration -- massive gamma and options activity
- April (TBD): Q1 regional bank earnings -- the fundamental test for CRE provisions and NIM trajectory
🧠 The Lesson
When you see an institutional trader closing a bearish position rather than adding to it, pay attention to what they're NOT doing. They're not piling into more puts. They're not rolling to lower strikes. They're walking away from a directional bet that worked. In the options world, knowing when to stop being right is just as important as getting the direction correct in the first place.
The $63/$60 bear put spread did its job. Now the question is whether the next institutional trade on KRE will be a new hedge -- or a bullish bet.
⚠️ Disclaimer: Options trading involves substantial risk and is not suitable for all investors. Past performance is not indicative of future results. The value of options may fluctuate based on market conditions, and you may lose your entire investment. This analysis is for educational purposes only and does not constitute financial advice. Please consult with a qualified financial advisor before making investment decisions. The author/publisher is not responsible for any losses incurred from trading based on this analysis.
Analysis by Ainvest.com Options Research | Data as of March 9, 2026