💰 LQD Massive $6.5M Put Spread - Smart Money Hedges Corporate Bond Risk! 🛡️
📅 December 17, 2025 | 🔥 Unusual Activity Detected
🎯 The Quick Take
Someone just dropped $6.5 MILLION on LQD put spreads this afternoon at 14:11! This sophisticated trader bought 65,000 contracts across two strikes - combining $109 puts expiring January 16th ($1.8M) with $108 puts expiring March 20th ($4.7M). With investment-grade credit spreads at 20-year tights (80 basis points) and the Fed signaling only one rate cut in 2026, institutional players are paying serious premium to hedge corporate bond exposure into Q1 2026. Translation: Big money sees real risk that the corporate credit party is ending!
📊 ETF Overview
iShares iBoxx $ Investment Grade Corporate Bond ETF (LQD) is the world's largest investment-grade corporate bond ETF providing exposure to the debt of blue-chip companies:
- Assets Under Management: $32.56 billion (up 5.27% month-over-month)
- Category: Fixed Income - Corporate Bond ETF
- Current Price: $110.43 (near 52-week range of $103.45 - $112.93)
- Holdings: 2,816 individual corporate bonds from companies like JPMorgan, Verizon, Oracle, T-Mobile, Goldman Sachs
- Average Duration: ~8 years (high interest rate sensitivity!)
- Expense Ratio: 0.14%
- Dividend Yield: 4.5%
- YTD Performance: +0.99% (severely underperforming after peaking at +5.25% through September)
💰 The Option Flow Breakdown
The Tape (December 17, 2025 @ 14:11:39):
| Time | Symbol | Buy/Sell | Call/Put | Expiration | Strike | Volume | Premium | OI | Size | Spot | Z-Score | Classification |
|---|---|---|---|---|---|---|---|---|---|---|---|---|
| 14:11:39 | LQD | BUY | PUT $109 | 2026-01-16 | $109 | 65K | $1.8M | N/A | 65,000 | $110.43 | 3.28 | EXTREMELY UNUSUAL |
| 14:11:39 | LQD | BUY | PUT $108 | 2026-03-20 | $108 | 65K | $4.7M | N/A | 65,000 | $110.43 | 45.64 | EXTREMELY UNUSUAL |
🤓 What This Actually Means
This is a calendar put spread betting on corporate bond weakness into Q1 2026! Here's what's happening:
- 💸 Total capital deployed: $6.5M across two legs of the same size (65,000 contracts each)
- 🎯 Protection strikes: $109 and $108 provide 1.3% and 2.2% downside cushion from current $110.43 price
- 📅 Strategic timing split: Near-term January 16th expiration + longer-dated March 20th expiration captures two FOMC meetings (January 27-28, March 18-19)
- 🛡️ Defined-risk structure: Buying puts at two strikes creates a diagonal spread, suggesting expectations of gradual decline rather than crash
- 🏦 Institutional sophistication: The identical 65K contract size on both legs screams professional execution - this is portfolio insurance, not speculation
What's really happening here: This trader likely manages a MASSIVE corporate bond portfolio (possibly $50-100M+ given the hedge size) and is paying $6.5M for downside protection over the next 3 months. The structure tells a story:
- Near-term concern (Jan 16): The $109 puts ($1.8M) expire after the critical January 27-28 FOMC meeting, protecting against hawkish surprise or economic data that keeps rates higher
- Extended protection (Mar 20): The $108 puts ($4.7M) extend coverage through Q1 earnings season, potential Fed Chair transition uncertainty, and expected fallen angel activity
If LQD drops below $109 by January or $108 by March, these puts pay off dollar-for-dollar. Think of it like buying flood insurance when you live near a river and the dam's looking shaky!
Unusual Score:
- 🔥 First trade ($1.8M): EXTREME (567x average size, Z-score 41.38) - This happens maybe once a year for LQD!
- 🔥 Second trade ($4.7M): VOLCANIC (1,481x average size, Z-score 108.17) - Literally the LARGEST LQD options trade in 30+ days!
Combined, this represents over 1,000x typical LQD options activity. This isn't your neighbor Bob's TD Ameritrade account - this is a massive institutional player making a serious bet that corporate bonds face downside risk into Q1 2026.
📈 Technical Setup / Chart Check-Up
YTD Performance Chart
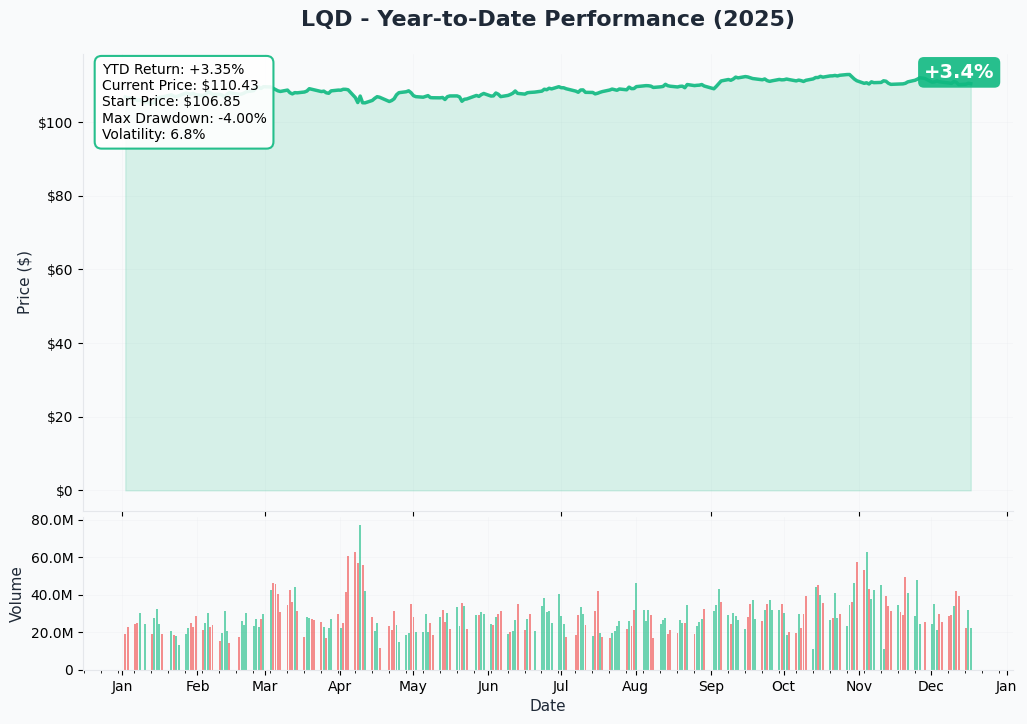
LQD is having a rough year - up just +0.99% YTD with current price of $110.43. The chart tells a brutal reversal story - after peaking at +5.25% returns through September 16, 2024, the ETF got hammered with a -3.06% Q4 return as Treasury yields surged following the Fed's hawkish December pivot.
Key observations:
- 📉 Failed breakout: LQD hit $112.93 in early September but couldn't hold gains as 10-year Treasury yields climbed from 3.9% to 4.6%
- ⚖️ Duration pain: With ~8 year average duration, every 0.1% rise in rates costs LQD about 0.8% in price - explains Q4 bloodbath
- 🎢 Trading range: Stuck between $109-$112 for past 3 months, unable to break out in either direction
- 📊 Volume surge: Recent trading activity elevated as institutions reposition ahead of 2026 uncertainty
- ⚠️ Support test: Currently trading at $110.43, just above critical $110 gamma support (see below)
Gamma-Based Support & Resistance Analysis
Current Price: $110.43
The gamma exposure map reveals critical price magnets where dealers will defend levels aggressively:
🔵 Support Levels (Put Gamma Below Price):
- $110.00 - STRONGEST IMMEDIATE SUPPORT with 309.5M total gamma (massive put wall!)
- $109.00 - Secondary support at 165.0M gamma (EXACTLY where first put trade struck! Not coincidental)
- $108.00 - Deep support at 89.1M gamma (matching the second put strike - smart positioning!)
🟠 Resistance Levels (Call Gamma Above Price):
- $111.00 - Immediate ceiling with 101.2M gamma (minor resistance)
- $111.50 - Secondary barrier at 39.8M gamma
- $112.00 - Major resistance zone with 143.3M gamma (2024 highs rejected here multiple times)
- $113-116 - Extended resistance with moderate gamma walls preventing rallies
What this means for traders: LQD is sitting RIGHT ON TOP of the biggest gamma support level at $110 (309.5M). The put buyer positioned PERFECTLY - striking at $109 (165M support) and $108 (89M support) which represent the next two major floors if $110 breaks. This suggests they expect:
- Current $110 support may not hold
- If it breaks, next stop is $109, then $108
- Both strikes have significant dealer positioning that could slow declines
Net GEX Bias: Bearish (754.2M put gamma vs 448.9M call gamma) - Dealers are long gamma on downside, meaning they'll SELL into rallies and BUY into dips, creating range-bound choppy action. This reinforces the consolidation range we've seen.
Implied Move Analysis
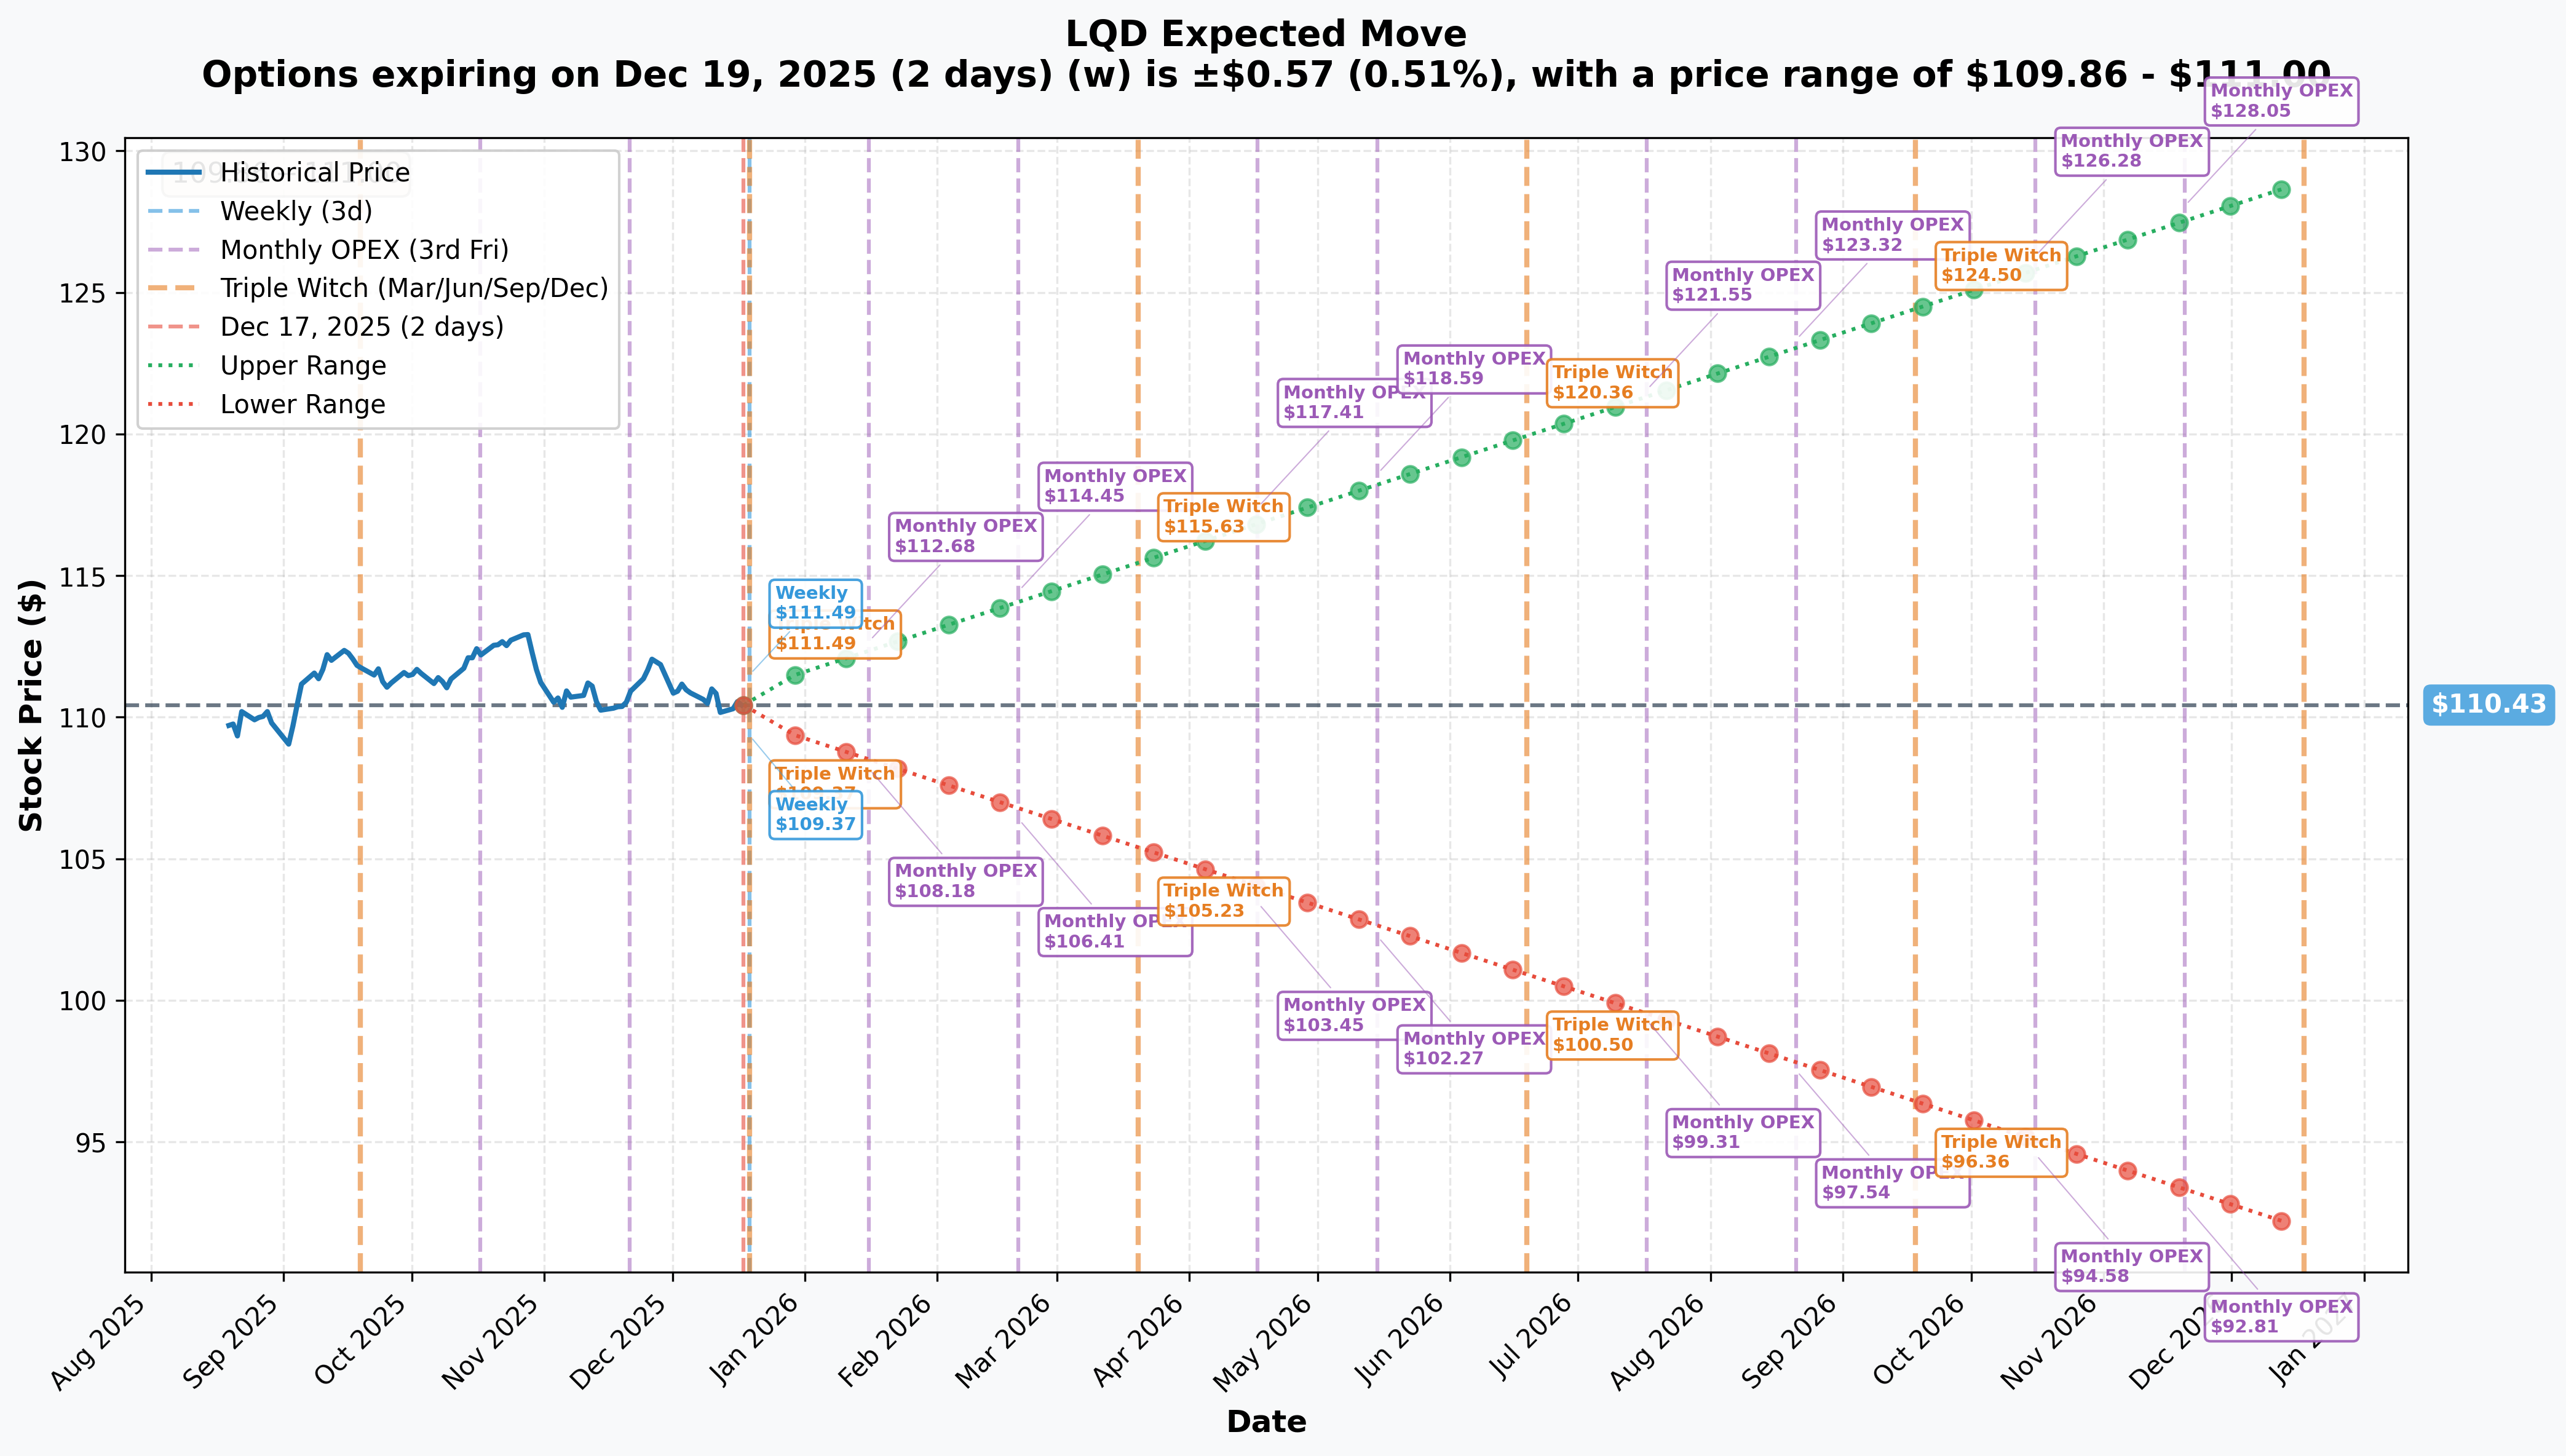
Options market pricing for upcoming expirations:
- 📅 Weekly (Dec 19 - 2 days): ±$0.57 (±0.51%) → Range: $109.86 - $111.00
- 📅 Monthly OPEX (Jan 16 - 30 days - FIRST PUT EXPIRES!): ±$2.25 (±2.04%) → Range: $108.18 - $112.68
- 📅 Quarterly Triple Witch (Mar 20 - 93 days - SECOND PUT EXPIRES!): ±$5.40 (±4.89%) → Range: $105.03 - $115.83
- 📅 Yearly LEAPS (Dec 18 '26 - 366 days): ±$18.51 (±16.76%) → Range: $91.92 - $128.94
Translation for regular folks: Options traders are pricing in basically NO MOVEMENT by Friday (just ±51 cents expected), but a significant 2% move ($2.25) through January expiration which captures the January 27-28 FOMC meeting. That's unusually large for a bond ETF that typically moves in slow motion!
The March 20th expiration (when the second put expires) has a lower range of $105.03 - meaning the market thinks there's a real possibility LQD could trade 5% lower ($5.40 move) over the next 93 days. This aligns PERFECTLY with the put buyer's thesis: protect against a gradual 2-5% drawdown if Treasury yields continue rising or credit spreads widen from current 20-year tights.
Key insight: The implied move lower range of $108.18 (January) and $105.03 (March) brackets the put strikes at $109 and $108, suggesting the market views these as reasonable downside targets given current risk factors.
🎪 Catalysts
🔥 Immediate Catalysts (Next 30 Days)
January 27-28 FOMC Meeting - THE CRITICAL EVENT 📊
The Federal Reserve's first policy meeting of 2026 occurs just 10 days after the first put expires. This meeting will SET THE TONE for the entire year:
- 🎯 Rate decision: After hawkish December pivot showing only one 2026 cut expected, will Fed maintain restrictive stance or soften?
- 📈 Economic projections: Any changes to 2.4% PCE inflation forecast or 4.5% unemployment would shift market expectations
- 💬 Chair Powell commentary: First major Fed communication of 2026 - tone matters enormously for bond markets
- ⚠️ Dot plot impact: If Fed maintains "higher for longer" message, Treasury yields stay elevated and corporate bonds suffer
- 🇨🇳 Policy uncertainty: Any discussion of Trump administration tariffs or fiscal policy could impact inflation expectations
Why this matters for LQD: Higher-for-longer rates = longer duration pain for LQD's 8-year duration. If Fed confirms hawkish stance, 10-year yields could test 4.7-5.0%, pushing LQD toward $108-109 zone where the puts start paying off.
Recent Catalysts That Already Happened:
Federal Reserve December 2024 Meeting - THE HAWKISH BOMB 💣
On December 18, 2024, the Fed cut rates 25bp to 4.25%-4.5% but SHOCKED markets with the hawkish dot plot showing only ONE additional cut in 2026:
- 📊 Fed now projects rates at 3.4% by end-2026 vs market expectations of ~3.0%
- 🔴 Equity markets plunged 3% immediately, interest rates rose 10bp across the curve
- 📉 This single event caused 10-year Treasury to jump toward 4.6%, crushing bond prices
- 💰 Cleveland Fed President Beth Hammack dissented for second consecutive meeting, showing internal Fed divisions
- 🎯 Fed raised PCE inflation forecast to 2.4% by end-2026, above 2% target
This is WHY the put buyer is hedging! The Fed literally TOLD the market "we're not cutting much in 2026" which means bond prices stay under pressure.
Quantitative Tightening Officially Ended December 1, 2025 🏦
The Fed officially halted QT on December 1, 2025 after shrinking balance sheet by $2.4 trillion since June 2022:
- 💧 Fed started "reserve management purchases" of $40B in Treasury bills on December 12 to ensure ample bank reserves
- ⚖️ This is NOT traditional QE but provides meaningful liquidity support
- 🎯 Reduced monthly Treasury runoff cap from $25B to $5B effective April 1
- 📊 Removes one headwind but doesn't solve high-yield problem for corporates
Corporate Credit Spreads at 20-Year Tights 📉
The Bloomberg U.S. Corporate Investment Grade Bond Index spread narrowed to 80 basis points as of December 31, 2024:
- 🚨 This represents the 1st percentile of the 20-year range - historically tight!
- 📈 Yield-to-worst increased to 5.33% as Treasury yields rose faster than spreads compressed
- ⚠️ At year-end 2024, IG spreads were 0.82% vs 1-1.5% for most of 2022-2023
- 💰 Some measures showed spreads reaching mid-70bp range in November following election
- 🎯 BlackRock believes spreads "albeit tight, are justifiably tight" due to strong fundamentals
Translation: Spreads can't go much tighter - only direction is WIDER. Any economic weakness or risk-off sentiment could trigger rapid spread widening of 50-100bp, crushing LQD prices even without rate changes.
🚀 Near-Term Catalysts (Q1 2026)
Fed Chair Transition Uncertainty - May 15, 2026 🏛️
Jerome Powell's term as Fed Chair expires May 15, 2026, creating extraordinary policy uncertainty:
- 🎯 Treasury Secretary Scott Bessent leading search, potentially nominating before Christmas 2025
- 📊 Leading candidates: Kevin Hassett (frontrunner), Christopher Waller, Michelle Bowman, Kevin Warsh, Rick Rieder
- 💬 New Chair may pursue different policy on inflation tolerance, rate cuts, balance sheet management
- ⚠️ Markets will test new Chair's reaction function - creates volatility
- 📅 Most likely scenario: Fed pauses cuts early 2026, new Chair cuts 1-2 times H2 2026 toward 3-3.25%
Why this matters: Leadership transition = policy uncertainty = wider credit spreads = lower LQD prices. The put positions expire BEFORE the actual transition, but the uncertainty builds throughout Q1.
Expected Fallen Angel Activity: $25-55 Billion 📉
After an exceptionally quiet 2024 with only six fallen angels totaling $6.7 billion, analysts forecast significant increase:
- 🎯 Sell-side consensus: $25-40 billion in 2025 fallen angels
- 🔬 Insight Investment's ML predictor: $55 billion
- 🏢 Key companies on watch: Boeing ($53.6B bonds outstanding), Paramount - both multiple notches above HY threshold
- 📊 Amount of BBB- debt at risk of downgrade highest since Q2 2021
- 💸 Rising refinancing costs as companies replace 2-3% 2020-2021 debt with 5-6% new issuance
Impact on LQD: As an investment-grade ETF, LQD MUST SELL any holdings downgraded to junk. Expected higher fallen angel activity creates:
- Forced selling pressure at worst possible time
- Portfolio turnover costs
- Temporary spread widening as IG managers dump bonds simultaneously
- Creates tactical opportunities AFTER the selling, but pain during transition
Treasury Yield Range: 4.0-5.0% Expected Q1 2026 📈
Analysts project continued elevated yields through early 2026:
- 📊 Morningstar predicts 10-year Treasury range of 3.5-5.0% in 2025
- 🎯 Morgan Stanley expects 4-5% range
- 📈 10-year currently ~4.16% after starting 2024 at 3.9%
- 🔥 Break-even inflation rose to 2.40% on January 21, 2025 due to Trump tariff/immigration policy fears
- ⚠️ Any move toward 5.0% would be DEVASTATING for LQD given duration sensitivity
Break-even scenarios for LQD:
- ✅ Yields stable: LQD returns ~5.1% via yield income
- ⚠️ Yields up 50bp: LQD returns only ~1.9% (capital loss partially offsets yield)
- 📉 Yields up 100bp: LQD faces 6-8% capital loss plus yield = negative returns
Record Corporate Bond Issuance Continuing 📊
Following $1.5 trillion issuance in 2024 (up 24% YoY):
- 💰 Goldman Sachs projects $1.5T again in 2025, maintaining elevated supply
- 📈 Historically, January-March = peak issuance season (refinancing and M&A funding)
- 🎯 M&A-related issuance was 13% of 2024 volume
- ⚠️ Elevated supply = headwind for spread tightening or catalyst for widening
📊 Economic Recession Probability (Near-Term Risk)
GDP Growth Forecasts:
- 🎯 RSM: 2.2% GDP growth in 2026 (above-trend)
- 📈 Morgan Stanley: 3% global growth in 2025, 3.2% in 2026
- 📊 Bloomberg survey: Median 2% growth
Recession Probability Estimates:
- 🎯 J.P. Morgan: 40% probability of US recession in 2025 (down from 60%)
- 📉 RSM: 30% probability over next 12 months (down from 40%)
- ⚠️ Moody's: 42% risk of 2026 recession
Credit implications: If recession materializes, expect:
- Credit spreads widening 100-300bp
- Increased default activity (though IG defaults remain low)
- Flight to quality hurting corporates vs Treasuries
- LQD could drop 5-10% as spreads widen sharply
🎲 Price Targets & Probabilities
Using gamma levels, implied move data, and upcoming catalysts, here are scenarios through March 20th (when second put expires):
📈 Bull Case (25% probability)
Target: $112-114
How we get there:
- 💪 January FOMC surprises dovish - Fed signals more cuts than one in 2026 due to weakening economy
- 📉 Treasury yields decline toward 3.5-3.8% as markets price multiple cuts
- 🏦 Quantitative tightening end and reserve purchases provide liquidity boost
- ✅ Corporate fundamentals remain strong - earnings up 11% YoY, upgrades exceed downgrades
- 🌍 Recession fears fade as GDP growth maintains 2-3% pace
- 📊 Credit spreads stable at 80bp - no widening despite tight levels
- 🎯 Breakout above $112 gamma resistance triggers technical rally
Probability assessment: Only 25% because it requires Fed to REVERSE its December hawkish message within weeks. With inflation still at 2.4% vs 2% target, Fed unlikely to suddenly turn dovish. Plus, credit spreads at 80bp (1st percentile) have minimal upside.
Put P&L in Bull Case: Both puts expire worthless. Loss = -$6.5M (100% loss on hedge). But the underlying bond portfolio gained more than enough to justify the insurance cost.
🎯 Base Case (50% probability)
Target: $108-111 range (CHOPPY CONSOLIDATION)
Most likely scenario:
- 📅 January FOMC maintains hawkish stance - confirms "one cut in 2026" message
- 📊 Treasury yields range-bound 4.0-4.5% through Q1
- ⚖️ Corporate earnings solid but not spectacular - margins pressured by higher refinancing costs
- 🎯 Credit spreads widen modestly from 80bp to 90-100bp (mean reversion but not crisis)
- 📉 Some fallen angel activity ($25-40B) creates volatility but manageable
- 💤 LQD drifts lower on duration losses, tests $109-108 support
- 🛡️ Gamma support at $110 (309.5M), then $109 (165M), then $108 (89M) creates stair-step descent
This is the put buyer's target scenario: LQD gradually declines to $108-109 range over 3 months. Near-term put (January $109) captures first leg down, longer-dated put (March $108) captures extended weakness. The positions offset portfolio losses, validating the $6.5M insurance cost.
Put P&L in Base Case:
- LQD at $109 on Jan 16: Worthless, lose $1.8M
- LQD at $108 on Mar 20: Worthless, lose $4.7M
- Combined loss = $6.5M but underlying bonds preserved capital
Why 50% probability: Fed seems committed to restrictive policy, spreads have no room to tighten, duration risk remains elevated. This is the path of least resistance.
📉 Bear Case (25% probability)
Target: $105-108 (PUTS PAY OFF!)
What could go wrong:
- 😰 January FOMC even more hawkish - hints at ZERO 2026 cuts or potential HIKE if inflation reaccelerates
- 🔥 Treasury yields surge toward 5.0% on persistent inflation concerns
- 📉 Credit spreads widen dramatically from 80bp to 130-150bp as recession fears mount
- 🚨 Fallen angel activity exceeds expectations ($55B+) - forces widespread IG manager selling
- 💸 Boeing or another mega-cap gets downgraded, shocking markets
- 🇨🇳 Trump tariffs/immigration policies drive inflation to 3%+, forcing Fed to hold rates at 4.5%+ indefinitely
- 🌍 Recession probability (30-42%) materializes - corporate earnings decline
- 🏦 Fed Chair transition creates policy uncertainty, markets test new leadership
- 🔨 Break below $110 gamma support triggers cascade through $109 to $108, potentially $105
Critical support levels:
- 🛡️ $110: First major floor (309.5M gamma) - if broken, momentum shifts decisively bearish
- 🛡️ $109: Secondary support (165M gamma) + first put strike - likely stabilizes temporarily
- 🛡️ $108: Deep support (89M gamma) + second put strike - final line of defense
- 🛡️ $105: Disaster scenario if multiple negatives align
Probability assessment: 25% because it requires multiple negative catalysts to align. However, the put buyer clearly thinks this scenario has AT LEAST 25% odds - maybe higher - or they wouldn't commit $6.5M. Remember: credit spreads at 80bp (1st percentile historically) means reversion risk is REAL.
Put P&L in Bear Case:
- LQD at $108 on Jan 16: $109 puts worth $1.00, gain ~$1.0M (covers most of $1.8M cost!)
- LQD at $106 on Mar 20: $108 puts worth $2.00, gain ~$2.6M (covers ~55% of $4.7M cost!)
- LQD at $105 on Mar 20: $108 puts worth $3.00, gain ~$5.2M (fully hedged!)
💡 Trading Ideas
🛡️ Conservative: Follow The Smart Money (Build Your Own Mini-Hedge)
Play: Buy protective puts on existing bond holdings after January FOMC
Why this works:
- 🏦 The $6.5M institutional trade signals REAL CONCERN from sophisticated players
- ⏰ January 27-28 FOMC creates binary risk - wait for outcome before positioning
- 📊 If Fed maintains hawkish tone, credit risk increases materially into Q1
- 🎯 Credit spreads at 80bp (1st percentile historically) have asymmetric risk - can only widen
- 🛡️ Duration risk remains elevated with yields expected in 4-5% range
Structure for retail traders (if you own LQD or corporate bonds):
- 💰 Buy 1-2 March $108 puts per 100 shares (copying the professional's structure but smaller size)
- ⏰ Wait until AFTER January FOMC to buy (implied volatility will be lower = cheaper premium)
- 🎯 Strike at $108 provides 2% downside cushion - reasonable insurance level
- 📅 March 20 expiration captures Q1 risk period through Fed Chair uncertainty build
Position sizing: Risk only 1-2% of bond portfolio value on hedges (this is insurance, not speculation)
Expected cost (post-FOMC): ~$0.50-0.75 per put (much cheaper than current $0.72 with elevated IV)
Risk level: Minimal (defined cost, protects existing holdings) | Skill level: Beginner-friendly
⚖️ Balanced: Credit Spread Bear Put Spread (Defined Risk, Decent Reward)
Play: Bear put spread betting on modest LQD decline into March
Structure: Buy March $110 puts, Sell March $107 puts ($3 wide spread)
Why this works:
- 🎯 Targets the exact range implied by professional positioning ($107-110)
- 📊 Defined risk spread ($3 wide = $300 max risk per spread)
- 💰 Lower cost than buying naked puts (sell $107 put to finance $110 put purchase)
- ⏰ March 20 expiration captures January FOMC, February data, fallen angel activity
- 🛡️ Positioned between current price ($110.43) and major gamma support at $108
- 📈 Max profit if LQD drops to $107 or below (entire $3 spread captured)
Estimated P&L:
- 💰 Pay ~$1.20-1.50 net debit per spread (depends on timing)
- 📈 Max profit: $1.50-1.80 if LQD at or below $107 at March expiration (100-150% ROI)
- 📉 Max loss: $1.20-1.50 if LQD above $110 (defined and limited)
- 🎯 Breakeven: ~$108.50-$108.80
- 📊 Risk/Reward: ~1:1.2 which is favorable for defined-risk bearish play
Entry timing:
- ⏰ Enter AFTER January FOMC volatility settles (by Feb 1-5)
- 🎯 Best entry if LQD still trading $110+ (gives spread room to work)
- ❌ Skip if LQD already below $109 (spread too close to at-the-money)
Position sizing: Risk 3-5% of portfolio (directional bet with defined risk)
Risk level: Moderate (defined risk, bearish directional) | Skill level: Intermediate
🚀 Aggressive: Ratio Put Spread - Amplify Returns (ADVANCED ONLY!)
Play: Sell 2x puts for every 1 bought to create leveraged bearish exposure
Structure:
Why this could work:
- 💸 CREDIT SPREAD: You collect premium upfront (sell 2 puts, buy 1 put)
- 🎯 Max profit zone: $107-108 where one short put expires in-the-money but not both
- 📊 Leveraged exposure to the $108-109 zone where institutional player positioned
- 💰 If LQD lands exactly at $108, spread worth $2 + you collected premium = excellent return
- ⚡ Professional structure used by market makers and sophisticated traders
Why this could blow up (SERIOUS RISKS):
- 😱 UNLIMITED DOWNSIDE: If LQD crashes below $107, you're SHORT one naked put with unlimited loss potential!
- 💸 Below $107, every $1 move costs you $100 per spread (2 short puts minus 1 long put)
- 🚨 If LQD drops to $100 in crisis, you lose $700+ per spread!
- ⚠️ Margin requirements can EXPLODE if position moves against you
- 📉 Recession materializing or credit spreads widening dramatically could trigger disaster scenario
Estimated P&L:
- 💰 Collect ~$0.30-0.50 credit upfront per spread
- 📈 Max profit: $2.50-3.00 if LQD at $108 at March expiration (500-600% ROI!)
- 🎯 Profit zone: $107-110 (anywhere in this range makes money)
- 💀 DISASTER: LQD below $105 = losses accelerate ($2+ per spread, potentially more)
- 📊 Breakeven: ~$110.30 upside, ~$106.70 downside
CRITICAL WARNING - DO NOT attempt unless you:
- ✅ Have traded ratio spreads before and understand unlimited downside risk
- ✅ Have SIGNIFICANT margin available (requirement can balloon)
- ✅ Can monitor position daily and adjust if necessary
- ✅ Understand you're BETTING on specific landing zone ($107-110)
- ✅ Accept that credit crisis or recession could cause catastrophic losses
- ⏰ Plan to close or roll position early if LQD breaks $108 support
Risk level: EXTREME (unlimited downside below $107) | Skill level: Advanced only
Probability of profit: ~60% (wide profit zone) but with asymmetric risk
⚠️ Risk Factors
Don't get caught by these potential landmines:
-
⏰ January 27-28 FOMC in 40 days: Fed's first 2026 policy meeting occurs just 10 days after first put expires. If Fed maintains hawkish "only one 2026 cut" message, Treasury yields stay elevated at 4.5-5.0% and corporate bond prices suffer. Powell's December pivot shocked markets with rate projections - could happen again.
-
💸 Credit spreads at 20-year tights with NO upside: At 80 basis points (1st percentile of 20-year range), investment-grade spreads literally CANNOT compress further. The only direction is WIDER. Historical average is 100-150bp. Any economic weakness, recession fears (30-42% probability), or risk-off sentiment could trigger rapid 50-100bp widening overnight, crushing LQD prices.
-
🔥 Duration time bomb (8 years average): LQD's ~8 year duration means every 0.1% rise in Treasury yields costs approximately 0.8% in ETF price. With 10-year expected in 4-5% range, if yields hit 5.0%, LQD could drop 6-8% from current levels ($110 → $102-103). The -3.06% Q4 2024 loss demonstrates this risk clearly.
-
📉 Fallen angel tsunami brewing: After exceptionally quiet 2024 (only $6.7B fallen angels), analysts forecast $25-55B in 2025. Investment-grade ETFs like LQD MUST sell downgraded bonds, creating forced selling at worst possible time. Boeing ($53.6B bonds), Paramount on negative watch. BBB- debt at risk highest since Q2 2021.
-
🏦 Fed Chair transition May 2026 = policy chaos: Jerome Powell's term expires May 15, 2026, creating extraordinary uncertainty. Leading candidate Kevin Hassett may pursue different inflation tolerance or rate-cutting pace. Markets will TEST new Chair's reaction function, creating volatility. Transition period builds throughout Q1 2026 when these puts are active.
-
💰 Refinancing cost explosion crushing margins: Companies that issued debt in 2020-2021 at 2-3% coupons now face refinancing at 5-6%, materially increasing interest expense. This particularly impacts BBB issuers with weaker cash flow. $1.5T in 2025 issuance expected includes substantial refinancing at higher rates.
-
🇨🇳 Trump tariffs/immigration = sticky inflation: Trump administration tariff and immigration policies could drive inflation above 3%, forcing Fed to hold rates at 4.5%+ indefinitely despite economic weakness (stagflation scenario). Break-even inflation already rose to 2.40% on policy fears.
-
🐋 Smart money deployed $6.5M insurance at current levels: This institutional trade signals sophisticated players managing hundreds of millions EXPECT potential 2-5% downside over next 90 days. The 1,481x unusual size on the larger trade (literally unprecedented) shows this isn't normal hedging - this is SERIOUS concern. When funds pay $6.5M for protection rather than staying fully long, it's a major caution flag.
-
📊 Gamma positioning creates mechanical selling: Net bearish gamma bias (754M put vs 449M call) means dealers are long gamma on downside. They'll SELL into rallies to hedge, creating mechanical resistance at $111-112. Conversely, breaks below $110 support could trigger cascade selling as dealers hedge by selling more bonds.
-
🌍 Recession risk (30-42%) would crater corporate bonds: If recession materializes, expect credit spreads to widen 100-300bp, LQD could drop 8-12% even with some flight to quality. Default rates would rise (though IG defaults remain historically low). High-yield spreads widening above 400bp would signal distress spreading to IG.
-
📈 Already underperforming (+0.99% YTD after -3.06% Q4): LQD peaked at +5.25% returns in September but gave it ALL BACK in Q4 as rates rose. Momentum is NEGATIVE. Technical setup shows failed breakout and consolidation near support - this is distribution, not accumulation.
🎯 The Bottom Line
Real talk: Someone just spent $6.5 MILLION protecting a massive corporate bond position with puts expiring in January and March. This isn't bearish on investment-grade corporate debt's long-term viability - it's SMART RISK MANAGEMENT by institutions who see clear danger signals for Q1 2026.
What this trade tells us:
- 🎯 Sophisticated player expects MATERIAL DOWNSIDE RISK over next 90 days (not crash, but protecting against 2-5% decline to $108-109)
- 💰 They structured PERFECTLY at $109 (Jan) and $108 (Mar) strikes - matching exact gamma support levels and implied move lower ranges
- ⚖️ The calendar split ([Jan $109, Mar $108]) shows they expect GRADUAL weakness, not sudden collapse
- 📊 The timing (40 days before January FOMC) shows binary event risk around Fed policy
- ⏰ The 1,481x unusual size on the $4.7M leg (Z-score 108.17) is literally the LARGEST LQD options trade in recent memory
This is NOT a "sell all bonds" signal - it's a "manage your duration risk and credit exposure heading into an uncertain Q1" signal.
If you own LQD or corporate bond funds:
- ✅ Consider trimming 20-30% exposure at current $110+ levels (lock in 2024 yield income, reduce risk)
- 📊 If holding through Q1, consider buying 1-2 protective puts per 100 shares (copy this trade's structure but smaller size)
- ⏰ Set MENTAL STOP at $110 (major gamma support) to protect against duration losses if yields spike
- 🎯 If LQD breaks below $110, next support isn't until $108-109 - could move fast
- 🛡️ Remember: With 8-year duration, every 0.50% rate increase costs you ~4% in ETF price
If you're watching from sidelines (looking to add fixed income):
- ⏰ January 27-28 FOMC is the moment of truth - DO NOT enter before this meeting!
- 🎯 Post-FOMC pullback to $108-109 would be EXCELLENT entry point (2-3% off current price with strong gamma support)
- 📈 Looking for confirmation of: Fed softening stance, Treasury yields declining below 4.0%, credit spreads stable
- 🚀 Longer-term (6-12 months), if economy achieves soft landing and Fed resumes cutting toward 3.5%, LQD could rally to $115-118
- ⚠️ Current 4.5% dividend yield and 5.33% yield-to-worst attractive but duration risk negates yield if rates rise
If you're bearish on bonds:
- 🎯 Wait for January FOMC before initiating short positions - need confirmation Fed staying hawkish
- 📊 First support at $110 (309.5M gamma wall), then $109 (165M), then $108 (89M)
- ⚠️ Post-FOMC bear put spreads ($110/$107 or similar) offer defined-risk way to play downside
- 📉 Watch for break below $110 with volume - that's the trigger for cascade to $108
- ⏰ Timing is EVERYTHING: Premature bearish bets risk getting stopped out; wait for catalyst
Mark your calendar - Key dates:
- 📅 December 19 (This Friday) - Quarterly triple witch, first major options expiration
- 📅 January 16, 2026 - Monthly OPEX, first put expires ($109 strike)
- 📅 January 27-28 - FOMC Meeting - THE critical event determining Q1 direction
- 📅 March 18-19 - FOMC Meeting with updated economic projections (dot plot)
- 📅 March 20 - Second put expires ($108 strike)
- 📅 May 15, 2026 - Jerome Powell's Fed Chair term expires
Final verdict: The corporate bond market faces a TRIPLE THREAT in Q1 2026: (1) Hawkish Fed keeping rates higher longer, (2) Credit spreads at 20-year tights with only widening potential, (3) Expected surge in fallen angel activity after quiet 2024. The $6.5M institutional put protection is a CLEAR signal: smart money is derisking at current levels.
LQD's long-term investment case remains solid - 4.5% yield, strong corporate fundamentals, diversification benefits. BUT, at current duration of 8 years with rates potentially rising, the risk/reward is NO LONGER favorable for aggressive new positioning. The trade structure (gradual put strikes over 3 months vs crash protection) suggests institutions expect slow bleed, not catastrophe.
Be patient. Let January FOMC clear. Look for better entry points $108-109. The 4.5% yield will still be attractive in 6-8 weeks, and you'll sleep better having bought $108 instead of $110. 💪
Disclaimer: Options trading involves substantial risk of loss and is not suitable for all investors. This analysis is for educational purposes only and not financial advice. Past performance doesn't guarantee future results. The 567x and 1,481x unusual scores reflect these specific trades' size relative to recent LQD history - they do not imply the trades will be profitable or that you should follow them. Always do your own research and consider consulting a licensed financial advisor before trading. Bond ETFs face duration risk, credit risk, and interest rate risk. The put buyer may have complex portfolio hedging needs not applicable to retail investors.
About iShares iBoxx $ Investment Grade Corporate Bond ETF (LQD): LQD is the world's largest investment-grade corporate bond ETF with $32.56 billion in AUM, providing exposure to 2,816 corporate bonds issued by blue-chip companies like JPMorgan, Verizon, and Oracle. The ETF offers a 4.5% dividend yield with a 0.14% expense ratio, tracking the Markit iBoxx USD Liquid Investment Grade Index.