🎯 LRCX $6.4M Deep ITM Call Sale - Smart Money Taking Profits After 116% Rally! 📊
📅 December 3, 2025 | 🔥 Unusual Activity Detected
🎯 The Quick Take
A large institution just sold $6.4 MILLION worth of deep in-the-money calls on LRCX (Lam Research), striking at $136 expiring January 16, 2026. With the stock trading at $158.32 (14% above the strike), this represents a covered call or profit-taking trade locking in gains at $161.55 effective price after a monster 116% YTD rally. The trade strategically expires BEFORE Q2 earnings (Jan 28), avoiding event risk while capturing year-end strength. Translation: Smart money is cashing out near the highs - and they're doing it before the next earnings catalyst!
📊 Company Overview
Lam Research Corporation (LRCX) is a leading global supplier of semiconductor wafer fabrication equipment and services:
- Current Price: $158.32 (December 3, 2025)
- Market Cap: ~$21.8 Billion
- 52-Week Range: $73.00 - $166.37
- YTD Performance: +116% (MASSIVE rally!)
- Institutional Ownership: 84.61%
🎯 What They Do
Lam Research specializes in:
- Plasma Etch Equipment (55% market share globally, 80% at sub-5nm nodes)
- Deposition Systems (second-largest player after Applied Materials)
- Advanced Packaging Solutions (SABRE 3D with 6,000+ installed cells)
- Cleaning Systems for semiconductor manufacturing
Industry Position: Third-largest semiconductor equipment manufacturer globally, behind ASML and Applied Materials, with dominant positions in critical process steps for leading-edge chip production.
Key Customers: TSMC, Samsung, SK Hynix, Micron, Intel
💰 The Option Flow Breakdown
The Tape (December 3, 2025 @ 12:37:23 PM):
| Time | Symbol | Side | Buy/Sell | Type | Expiration | Premium | Strike | Volume | OI | Size | Spot | Option Price |
|---|---|---|---|---|---|---|---|---|---|---|---|---|
| 12:37:23 | LRCX | BID | SELL | CALL $136 | 2026-01-16 | $6.4M | $136 | 2,500 | 5,700 | 2,500 | $158.32 | $25.55 |
Total Notional: $6.4 Million Unusual Activity Score: Z-Score 2.7 (HIGHLY UNUSUAL) Volume/OI Ratio: 0.439 (Moderate-to-High Activity)
🤓 What This Actually Means
This is aggressive profit-taking after an incredible run! Here's what went down:
Deep ITM Call Sale: $136 Strike (Jan 16, 2026) 🎰
- 💰 Premium collected: $6.4M ($25.55 per contract × 2,500 contracts)
- 🎯 Strike: $136 calls - 14.1% BELOW current price (deep ITM!)
- ⏰ Expiration: January 16 (44 days) - expires BEFORE Q2 earnings (Jan 28)
- 📊 Size: 2,500 contracts represents 250,000 shares worth ~$40M
- 💵 Effective Sale Price: $161.55 ($136 strike + $25.55 premium)
- 🎪 Delta: ~0.95 (near-parity with stock, essentially a synthetic short)
- 🔥 Unusual Score: Z-Score 2.7 (only ~0.7% of trades this large occur by chance!)
Strategic Interpretation:
This is a COVERED CALL or PROFIT-TAKING STRATEGY with high conviction characteristics:
Most Likely: Covered Call Scenario 🛡️
Structure: Institution owns 250,000 shares of LRCX and sells calls against the position.
Why they did this:
- 💪 Lock in gains: With LRCX up 116% YTD, selling deep ITM calls effectively monetizes most of the position's value
- 💸 Income generation: Captures $25.55 per share in premium ($6.4M) IMMEDIATELY
- 🎯 Effective exit price: $136 strike + $25.55 premium = $161.55 effective sale price
- 📈 Upside cap: Maximum profit if stock continues higher is $161.55 (only 2% above current $158.32)
- 🛡️ Protection: Premium provides $25.55 downside cushion (16% buffer from current price)
- ✅ Assignment probability: ~95% chance of assignment at expiration given deep ITM status
Alternative: Profit Taking Scenario 💰
Structure: Holder closes long call position established at lower strikes.
Why this makes sense:
- 📊 Stock has rallied $22.32 (14.1%) above the $136 strike
- 🏦 Investor may have purchased $136 calls when stock was trading $136-145
- ⏰ Locking in substantial gains ahead of potential volatility around Q2 earnings (Jan 28)
- 🚨 Avoiding risk events: China export restrictions, valuation concerns, memory cycle peak
What's really happening here:
This trader is NOT betting on continued upside - they're betting LRCX consolidates or pulls back from here. By capping gains at $161.55, they signal skepticism of further near-term rally through mid-January. The timing is STRATEGIC: expire before Q2 earnings (avoiding binary event risk) but maintain exposure through year-end (potential December rally + tax deferral).
Combined signal: $6.4M represents conviction that risk/reward has shifted against LRCX near-term. After 116% rally, smart money is de-risking at $158-162 levels.
📈 Technical Setup / Chart Check-Up
YTD Performance Chart
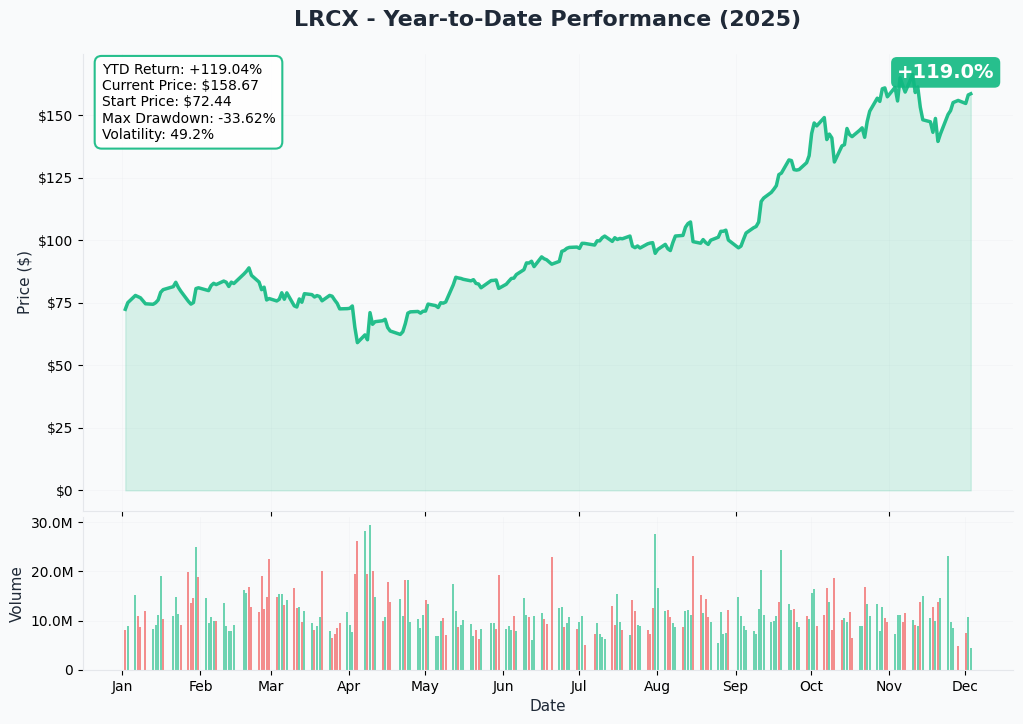
LRCX is in an absolute MONSTER rally - up +116% in 2025 alone! The chart tells the story of semiconductor equipment demand driven by AI, HBM memory, and advanced node transitions.
Key observations:
- 🚀 Parabolic acceleration: Vertical move from ~$73 (Jan 2025) to $158 (Dec 2025)
- 📈 Near 52-week high: Currently at $158.32, just below November high of $166.37
- 🎢 Extended valuation: After 116% gain, risk/reward has shifted
- 📊 Volume pattern: Sustained institutional accumulation through the year
- ⚠️ Profit-taking zone: Smart money selling deep ITM calls signals top formation
- 💪 Momentum sustained: Even at $158+, the trend remains intact (but stretched)
The technical picture is EXTENDED - while the uptrend is clear, the magnitude of gains creates vulnerability to profit-taking. For bulls, this is "trim and take profits." For bears, this is "wait for the pullback before shorting."
Gamma-Based Support & Resistance Analysis
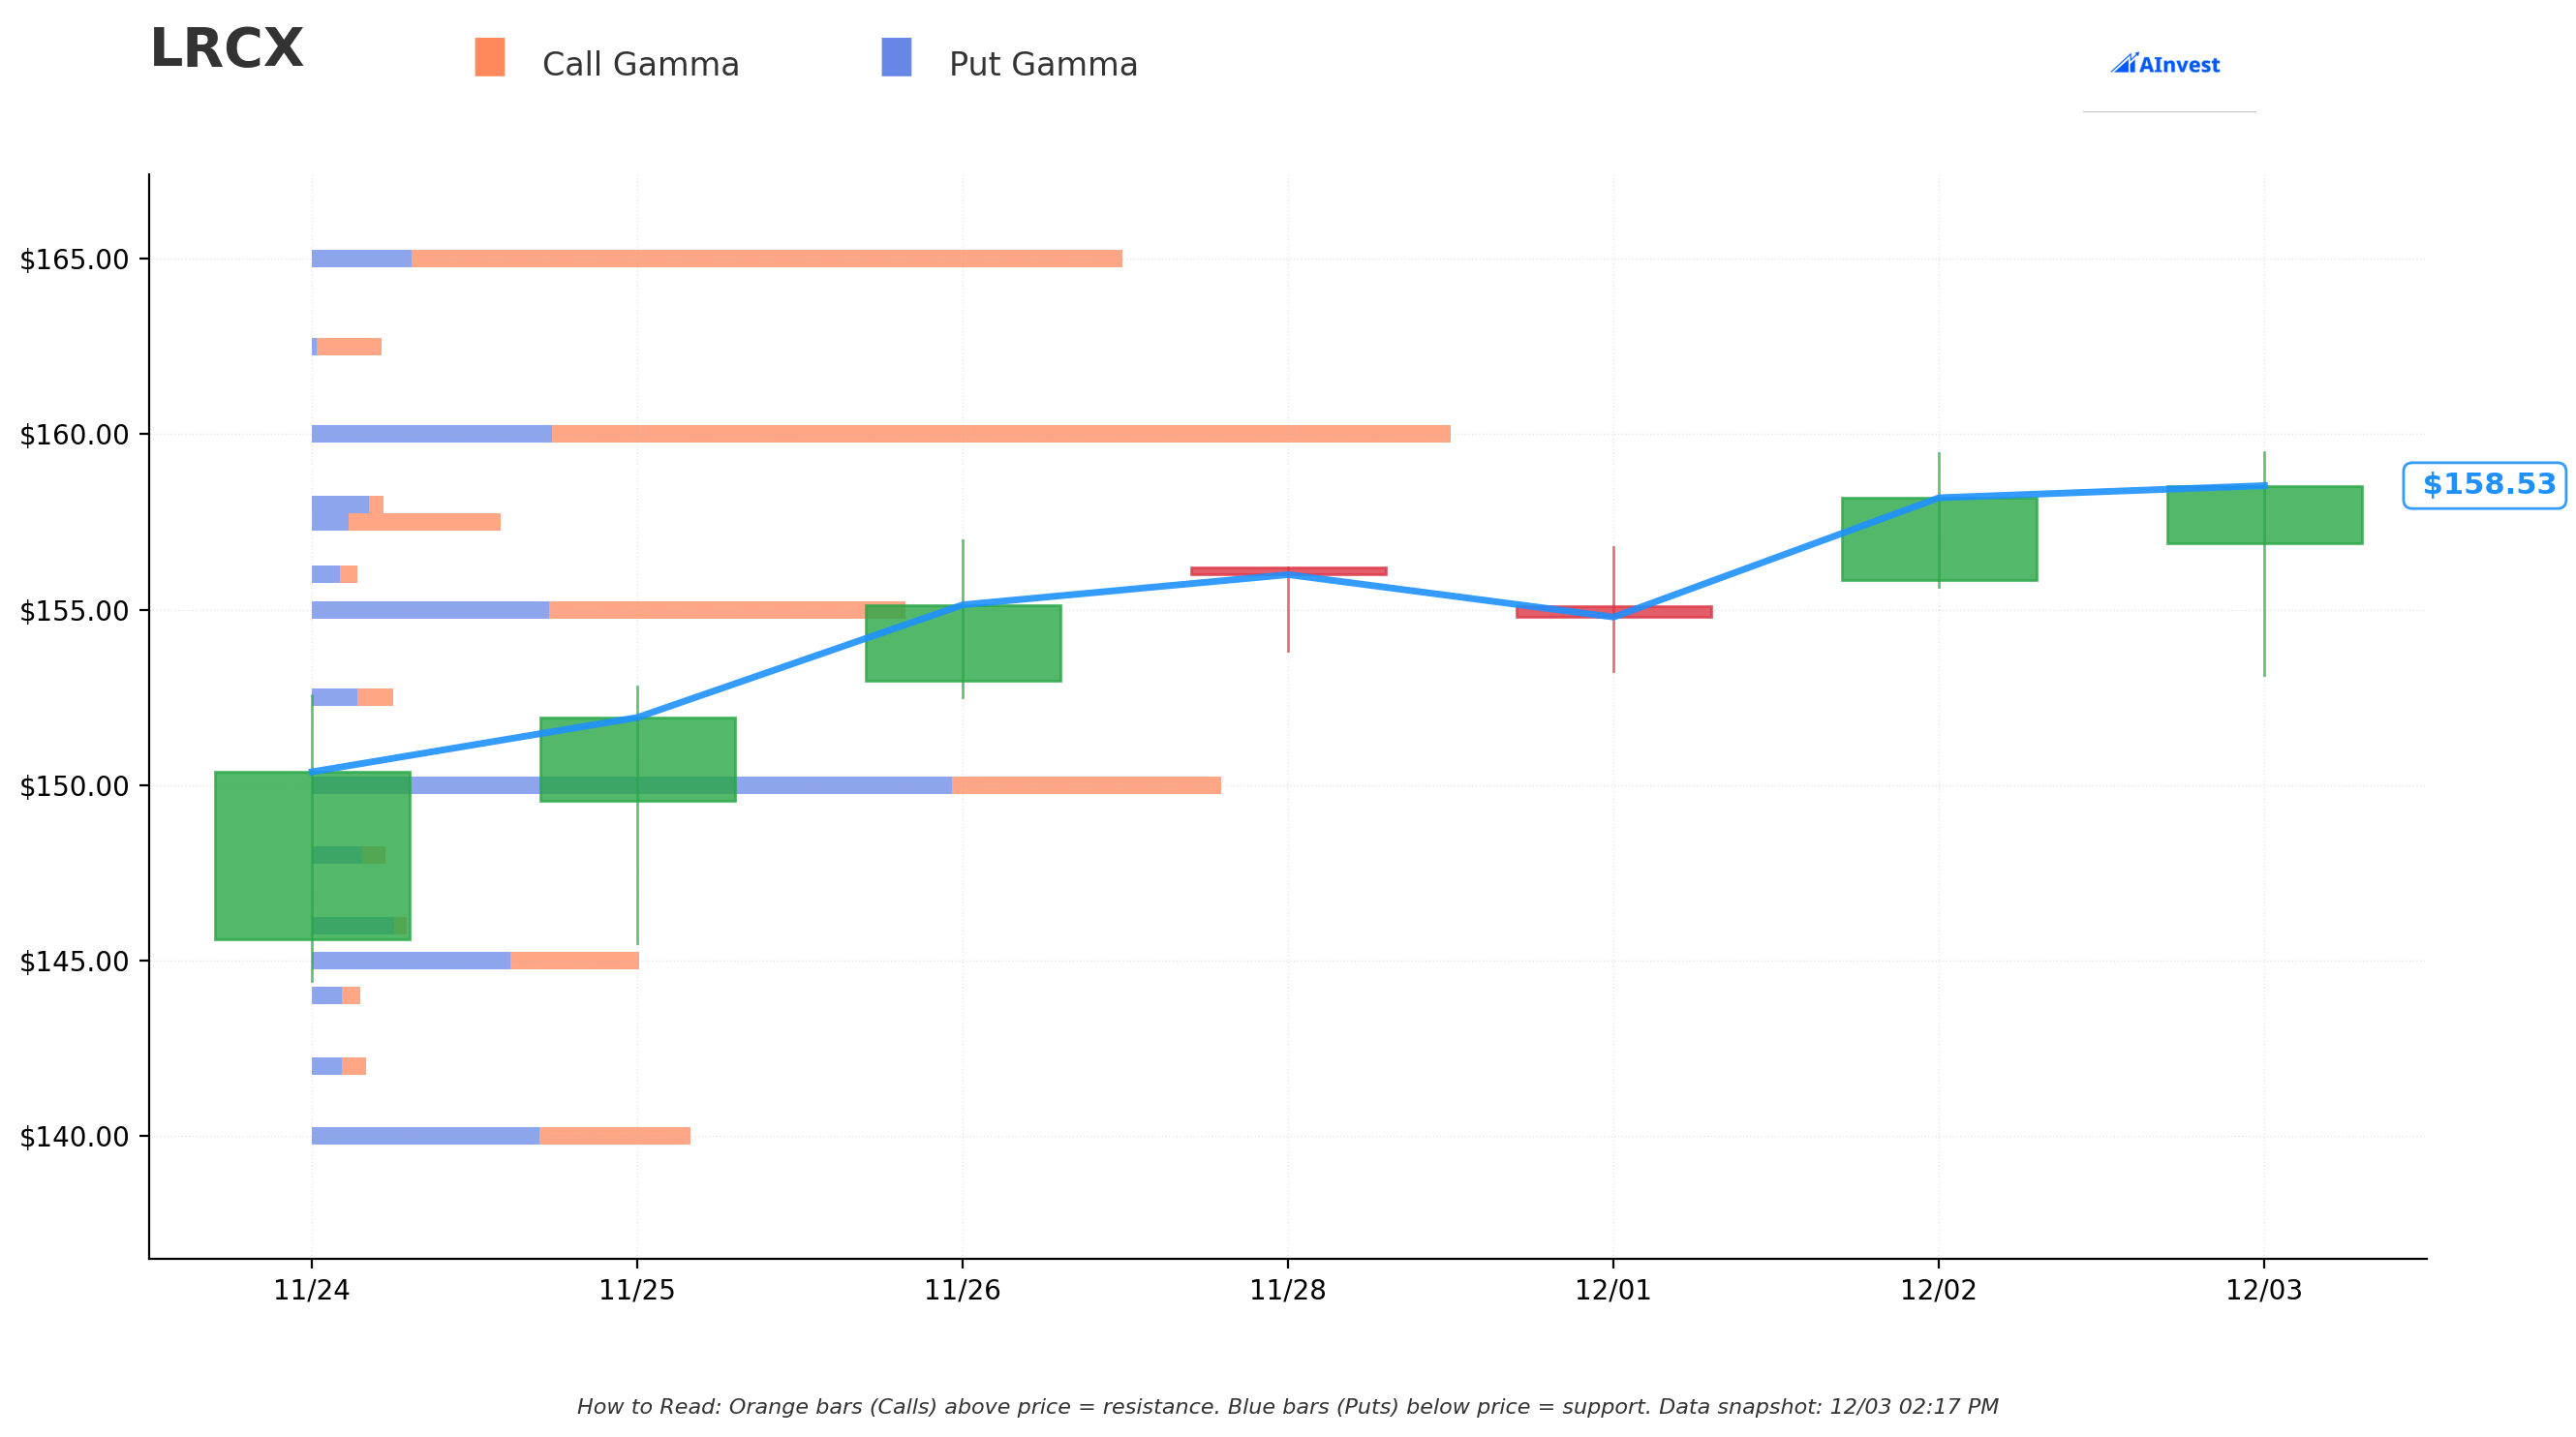
Current Price: $158.32
The gamma exposure map reveals critical price levels where market makers have positions:
🔵 Support Levels (Put Gamma Below Price):
- $155: Immediate support (1.9% below current)
- $150: Major support at average analyst price target area (5.3% below)
- $145: Strong support zone (8.4% below)
- $136: CRITICAL support - exactly where the call strike is! (14.1% below)
🟠 Resistance Levels (Call Gamma Above Price):
- $160: Immediate ceiling (1.1% overhead)
- $165: Secondary resistance (4.2% above)
- $166.37: 52-week high from November 2025
- $170: Strong resistance zone (7.4% above)
Net GEX: Currently neutral (0.0) - balanced dealer positioning
What this means for traders:
LRCX is trading in a tight consolidation near recent highs between $155-165. The gamma map is BALANCED, suggesting no strong directional pressure from options market maker hedging flows.
Notice the pattern? The call seller struck EXACTLY at $136 (deep support level) - if stock retraces there, the covered call breaks even. This is sophisticated positioning at a natural support zone.
If LRCX breaks above $160: The next stops are $165, then $166.37 (52-week high), then $170. But the covered call caps gains at $161.55 - trader doesn't believe this happens.
If LRCX breaks below $155: Watch for quick flush to $150 (analyst target area), then potentially $145. The $136 calls provide cushion down to $136 + $25.55 = $161.55 breakeven.
Implied Move Analysis
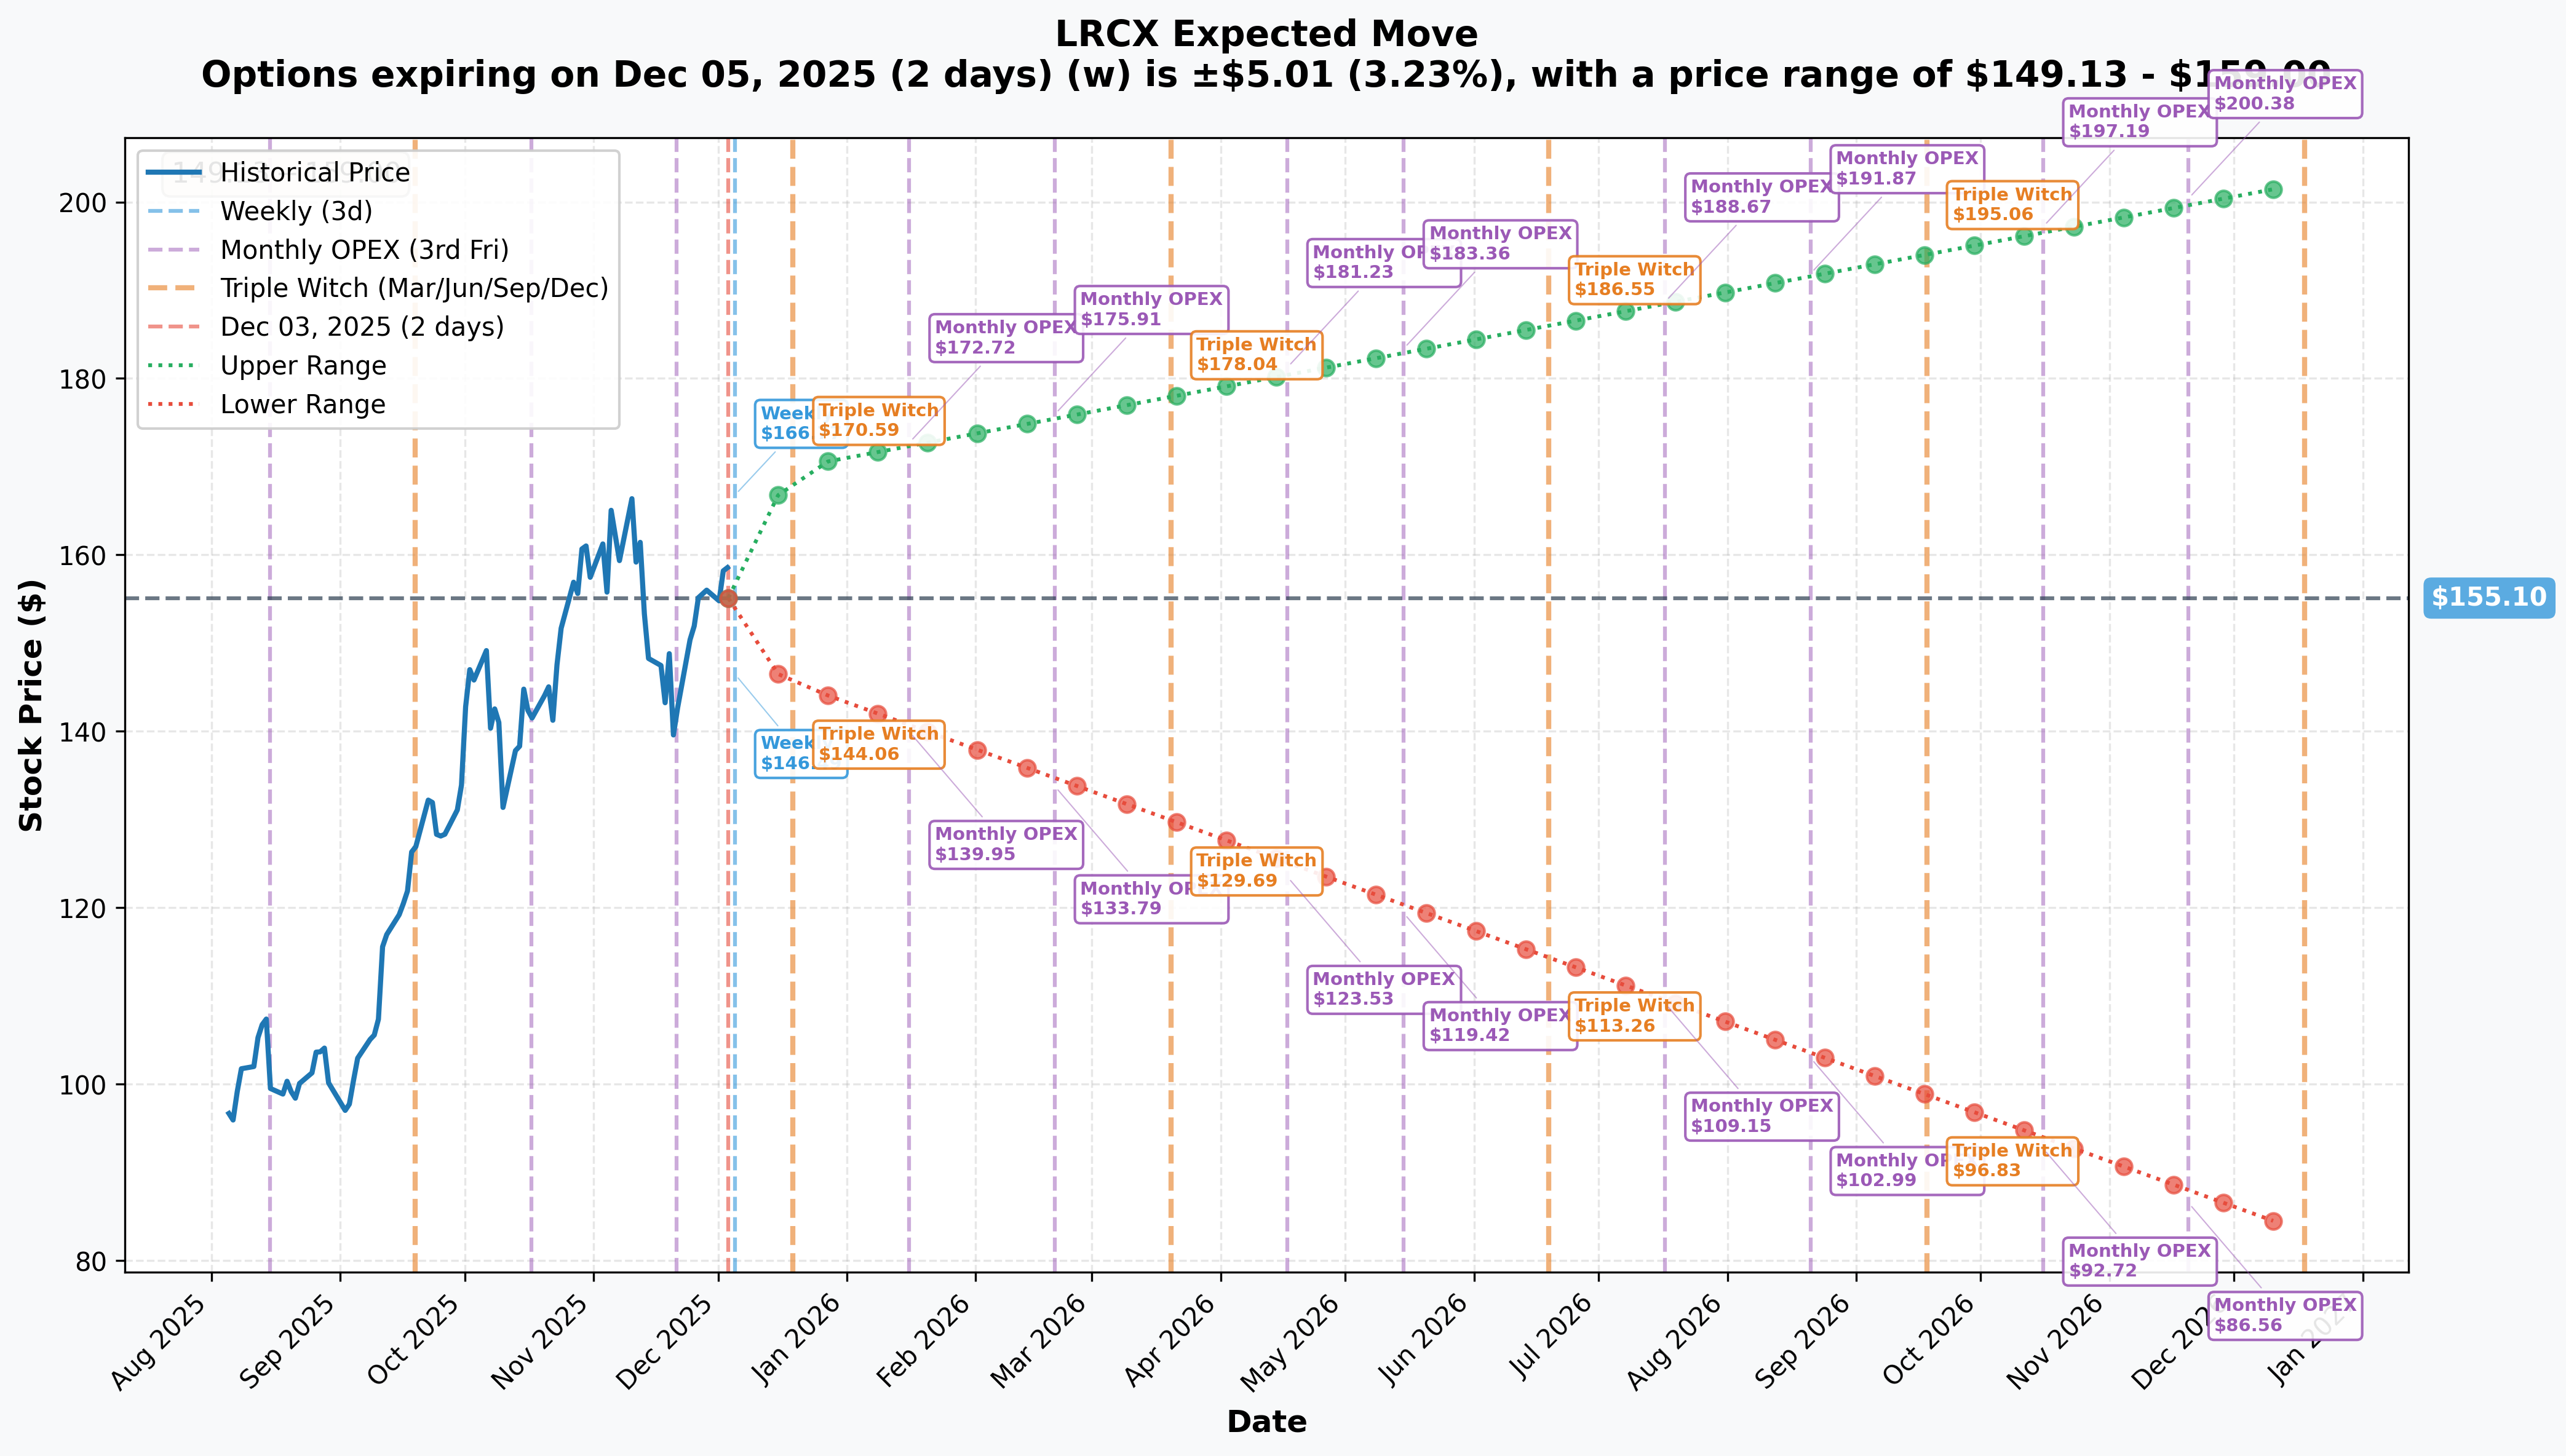
Options market pricing for upcoming expirations:
- 📅 Weekly (Dec 5 - 2 days): ±$5.12 (±3.23%) → Range: $149.13 - $159.00
- 📅 Monthly OPEX (Dec 19 - 16 days): ±$11.37 (±7.33%) → Range: $145.43 - $169.88
- 📅 January OPEX (Jan 16 - 44 days - THE TRADE!): ±$17.28 (±10.5%) → Range: $139.95 - $172.72
- 📅 Yearly LEAPS (Dec 2026 - 1 year): ±$52.23 (±33.7%) → Range: $83.60 - $202.06
Translation for regular folks:
Options traders are pricing in a 3.2% move ($5) by this Friday, but a MUCH LARGER 7.3% move ($11) through December 19 and 10.5% move ($17) through January 16 (trade expiration).
KEY INSIGHT for this trade:
- The January 16 $136 calls have $22.32 of cushion ($158.32 current - $136 strike)
- Even in bearish scenario (stock drops to $140, lower bound of range), calls remain ITM
- Assignment probability extremely high (>95%)
- Trader is comfortable stock stays above $136 through mid-January
The elevated IV (33.7% annualized) makes selling calls attractive - institutions are monetizing expensive options while capping upside.
🎪 Catalysts
🔥 Immediate Catalysts (Already Priced In)
Memory Supercycle Driving Equipment Demand 💾
LRCX's 116% rally has been driven by:
- 🤖 HBM Memory Boom: HBM market: $2.93B (2024) → $16.72B (2033), 21.35% CAGR
- 📈 DRAM Price Surge: DRAM prices up 50% recent quarters
- 🏭 Capacity Expansions: SK Hynix, Micron, Samsung adding memory fab capacity (benefits LRCX etch/deposition tools)
- 🎯 Advanced Packaging: TSMC CoWoS capacity: 330K (2024) → 660K (2025) - 100% increase
Why the call sale NOW: These catalysts are ALREADY in the stock price (116% gain!). Smart money believes upside is exhausted.
🚀 Near-Term Catalysts (Next 45 Days)
Q2 Fiscal 2026 Earnings - January 28, 2026 📊 (THE BIG ONE!)
Consensus Expectations:
- 💰 Revenue: $5.21B (guidance: $4.9B - $5.5B)
- 📈 EPS: $1.16 (guidance: $1.05 - $1.25)
- 🎯 Gross Margin: High-40% range (vs. 50.6% in Q1) - margin compression concern!
Key Metrics to Watch:
- 🌏 China revenue mix: Currently 31%, expected to decline to ~28-30% due to export restrictions
- 📦 Advanced packaging revenue: Key growth driver
- 🏭 Foundry segment: Management guided for 30%+ growth in 2025
- 📊 2026 WFE outlook: Market expects $125-128B guidance (8-10% growth)
Implications for This Trade:
- ⚠️ Options expire Jan 16, 12 days BEFORE earnings (avoids event risk!)
- 🎯 Suggests trader wants to avoid earnings volatility while capturing time decay through year-end
- 💰 This is TACTICAL profit-taking, not bearish fundamental view
December OPEX - December 19, 2025 📈
Implied Move: ±7.33% ($11.37) Expected Range: $145.43 - $169.88
Pin Risk: With significant OI at $160, stock may experience gravitational pull toward $160 into monthly expiration. The $136 strike is so far ITM that pin risk is negligible for this specific trade.
📅 Upcoming Catalysts (2026)
Technology Inflection Points 🤖
Gate-All-Around (GAA) Transition:
- 🏭 TSMC N2 node with GAA: Volume production 2026
- ⚡ TSMC A16 (GAA + backside power): H2 2026
- 🎯 Lam's 55% etch market share positions for outsized benefit
- 🚀 AMD and MediaTek confirmed N2-based products for 2026
WFE Market Growth:
- 💰 2025 WFE: $105-116B (+6% YoY)
- 📈 2026 WFE: $125-128B (+8-10% YoY)
- 🎯 Lam's 15% overall WFE market share should drive ~10-12% revenue growth
Why this matters for the trade: Long-term fundamentals remain strong, but the covered call strategy suggests institution believes near-term (<45 days) upside is limited despite positive 2026 outlook.
🎲 Price Targets & Probabilities
Using gamma levels, implied move data, and Wall Street consensus, here are scenarios through January 16th expiration:
📈 Bull Case (20% probability)
Target: $170-$180
How we get there:
- 💥 Surprise positive news: Major new customer win or China restrictions eased
- 🚀 Memory cycle accelerates beyond expectations (HBM demand explodes)
- 📊 Q2 pre-announcement beats high end of guidance
- 🤖 GAA transition orders pull forward into Q2
- 🏭 Competitor stumble creates market share opportunity
- 📈 Semiconductor equipment sector rally lifts all boats
Key metrics needed:
- Sustained daily volume >3M shares (vs. ~2M recent average)
- Break above $165 with conviction
- Positive semiconductor equipment sector momentum
- No negative China regulation news
Probability assessment: Only 20% because stock already up 116% YTD, near 52-week highs, and institutional selling pressure evident. Requires major positive surprise to overcome profit-taking headwinds.
Call P&L in Bull Case:
- Covered call at $175: Capped at $161.55 effective sale price, misses $175-161.55 = $13.45 per share upside
- Opportunity cost: $13.45 × 250,000 shares = $3.36M in forgone gains
- But: Already locked in 116% YTD gain at $161.55 effective price
🎯 Base Case (65% probability)
Target: $150-$165 range (CONSOLIDATION)
Most likely scenario:
- ✅ LRCX consolidates in $150-165 range through January
- 📊 No major catalysts between now and Jan 16 expiration
- 🎢 Typical year-end trading patterns (light volume, range-bound)
- 💰 Some profit-taking by other institutions after 116% rally
- ⚖️ Valuation concerns prevent breakout above $165
- 📉 China headwinds and margin compression concerns weigh on sentiment
- 🏦 Insider selling creates sentiment headwind
- 📊 Trading within $150-165 band through January expiration
- 🤔 Market waits for Q2 earnings (Jan 28) for next catalyst
This is the "range-bound" scenario: Stock consolidates gains, neither breaks out nor breaks down. Covered call generates income while maintaining most upside to $161.55.
Why 65% probability: This balances the extended valuation (116% gain) against strong fundamentals. After such a massive run, consolidation is most likely outcome. Fundamentals support $150-165 range.
Call P&L in Base Case:
- Covered call at $158: Calls assigned at $136, effective sale at $161.55 = profit locked in
- Return: Achieved maximum profit of $161.55 per share on position
- Outcome: Strategy executed perfectly - monetized position at attractive level
📉 Bear Case (15% probability)
Target: $136-$150 (PULLBACK)
What could go wrong:
- 😰 Q2 earnings pre-announcement disappoints (guide below consensus)
- 🚨 China export restrictions expand further (additional revenue hit beyond $600M)
- 💸 Memory cycle peak concerns intensify (DRAM prices rollover)
- 📉 Valuation reset: Average analyst target $151.71 implies 4.3% downside
- 🐳 Additional insider selling headlines
- 💔 Broader semiconductor selloff drags sector lower
- 🔨 Profit-taking accelerates after 116% rally
Critical support levels:
- 🛡️ $155: Immediate support - must hold
- 🛡️ $150: Major support (analyst target area)
- 🛡️ $145: Strong support zone
- 🛡️ $136: CALL STRIKE - breakeven for covered call
Probability assessment: Only 15% because fundamentals remain strong (WFE growth, GAA transition, HBM demand). Downside limited by strong sector tailwinds. However, valuation stretched after 116% gain.
Call P&L in Bear Case:
- Covered call at $140: Calls still ITM, assigned at $136
- Effective sale: $161.55 ($136 + $25.55 premium)
- Stock loss: $158.32 (entry) - $140 (exit) = -$18.32 per share on stock
- But: Premium cushion of $25.55 provides buffer
- Net: $161.55 effective > $140 actual = still profitable down to $136
Below $136 scenario:
- 💀 If stock drops below $136, covered call breaks even
- 📉 Below $136, loses dollar-for-dollar (stock exposure resumes)
- 🛡️ Premium provides protection: $136 - $25.55 = $110.45 breakeven
💡 Trading Ideas
🛡️ Conservative: Respect the Signal - Wait for Pullback
Play: Stay on sidelines until AFTER pullback to $145-150
Why this works:
- ⏰ Institutional flow is CLEAR signal: smart money de-risking at $158-162
- 📊 116% YTD gain offers zero margin of safety
- 🎯 Better entry likely at $145-150 (8-14% correction) for fresh positioning
- 📉 Valuation: Average analyst target $151.71 suggests downside risk
- 🤔 The $6.4M call sale signals FOMO risk - why chase?
Action plan:
- 👀 Watch December monthly OPEX (Dec 19) closely for volatility
- 🎯 Look for pullback to $145-150 for stock entry with margin of safety
- ✅ Need to see Q2 earnings beat (Jan 28) before aggressive positioning
- 📊 Monitor WFE forecasts and China regulation developments
- ⏰ Revisit post-earnings for Q3 setup with cleaner picture
Risk level: Minimal (cash position) | Skill level: Beginner-friendly
⚖️ Balanced: Copy the Playbook - Sell Covered Calls
Play: If long LRCX, sell covered calls at $160 or $165 strikes (Feb expiration)
Structure: Own 100+ shares, Sell $160 calls or Sell $165 calls (February 20, 2026 expiration)
Why this works:
- 📊 Follow institutional playbook: lock in gains after huge run
- 💰 Collect $8-15 per share premium (5-10% yield in 2-3 months)
- 🎯 Cap upside at $160-165 but generate income
- 🛡️ Premium provides 5-10% downside cushion
- ⏰ Feb expiration captures post-earnings period (can reassess after Jan 28)
Estimated P&L:
- 💰 Collect ~$10-15 per 100 shares ($1,000-1,500 per contract)
- 📈 Max profit if LRCX above $160-165 at Feb expiration
- 📉 Premium cushions losses if stock dips to $145-150
- 🎯 Can roll if stock rallies strongly (extend duration, raise strike)
Risk level: Low-Moderate (defined upside, income generation) | Skill level: Intermediate
🚀 Aggressive: Bear Put Spread - Bet on Pullback (SPECULATIVE!)
Play: Buy bear put spread targeting pullback to $145-150
Structure: Buy $155 puts, Sell $145 puts (February 20, 2026 expiration)
Why this could work:
- 🐋 "Fading smart money" - institutions de-risking suggests pullback coming
- 💥 Valuation stretched after 116% rally
- 📊 Analyst average target $151.71 (4% downside) validates thesis
- 🎯 Defined risk structure ($10 wide = $1,000 max risk per spread)
- ⏰ February expiration gives time for consolidation/pullback
- 📈 Benefits from profit-taking pressure and year-end tax selling
Why this could blow up (SERIOUS RISKS):
- 💸 Cost: Spread costs ~$3-4 ($300-400 per spread)
- 😱 Fundamentals strong: WFE growth, GAA transition, HBM demand all bullish
- ⚠️ Sector momentum: Semiconductor equipment sector in uptrend
- 💀 Q2 beat: Earnings surprise (Jan 28) could invalidate bearish thesis
- 🚨 Fighting trend: Stock in strong uptrend, dangerous to short
Estimated P&L:
- 💰 Cost: ~$3.50 per spread ($350)
- 📈 Profit scenario: Stock at $148 by Feb 20 = $3.50 profit (100% ROI)
- 🚀 Max profit: Stock at $145 by Feb 20 = $6.50 profit (186% ROI)
- 📉 Loss scenario: Stock at $160 by Feb 20 = -$3.50 loss (100% loss)
- 💀 Total loss: Stock above $155 by Feb 20 = -$3.50 loss (100% wipeout)
Breakeven point: $151.50 (4.3% pullback from current $158.32)
CRITICAL WARNING - DO NOT attempt unless you:
- ✅ Understand options pricing and bear spreads
- ✅ Can afford to lose ENTIRE premium (real 100% loss possibility!)
- ✅ Accept that fighting trend is dangerous
- ✅ Plan exit strategy BEFORE entering (don't hold hoping for crash)
- ⏰ Consider taking profits at 50-100% gain
- 📊 Size position at 1-3% of portfolio MAX (high risk!)
Risk level: HIGH (can lose 100% of premium) | Skill level: Advanced only
Probability of profit: ~35-40% (need 4-8% pullback in 75 days against strong trend)
⚠️ Risk Factors
Don't get caught by these potential landmines:
-
💰 China export restrictions getting worse: Projected $600M revenue loss in 2026, gross margin compression to 48.5% from current 50.6%, China revenue mix declining from 43% to 35%. Further restrictions could accelerate margin pressure.
-
🚨 Valuation risk after 116% rally: Average analyst price target $151.71 implies 4.3% downside. Stock trading at/near 52-week highs. Multiple compression risk if growth expectations moderate. This is the #1 reason for the covered call trade.
-
📉 Insider selling signal: $14.9M insider sales over 90 days, CFO and executives reduced positions by 3.9-44%. Likely diversification after huge run, but creates sentiment headwind and aligns with institutional profit-taking.
-
💾 Memory cycle peak risk: Memory historically highly cyclical. Current supercycle driven by AI, but oversupply risk if demand cools. DRAM prices up 50% typically unsustainable. Peak risk grows with each passing quarter.
-
📊 Q2 earnings disappointment risk: China headwinds could pressure results. Gross margin guided lower (high-40% vs. 50.6%). Any guidance cut would be material negative. Note: This trade expires BEFORE earnings, avoiding this risk entirely.
-
🤖 Technology transition execution risk: GAA/backside power adoption dependent on foundry yields. Delays in TSMC N2/A16 ramps could slow equipment orders. Longer-term risk but relevant for 2026 outlook.
-
💔 Geopolitical shock: Taiwan tensions escalate disrupting TSMC, or further escalation of US-China tech restrictions. Would pressure stock sharply. Covered call provides limited protection (only $25.55 cushion).
🎯 The Bottom Line
Real talk: Someone just sold $6.4 MILLION worth of deep ITM calls on LRCX, effectively locking in profits at $161.55 per share (2% above current $158.32) after a 116% YTD surge. This is a high-conviction profit-taking trade by sophisticated institution following the stock's incredible run.
What this trade tells us:
- 🎯 Smart money believes near-term upside beyond $160-165 is LIMITED
- 💥 After 116% rally, risk/reward has shifted - better to lock in gains than chase higher
- 📊 January 16 expiry strategically AVOIDS Q2 earnings (Jan 28) while capturing year-end
- ⏰ This is tactical positioning, not bearish fundamental view
- 💰 $6.4M commitment shows conviction that $158-162 is attractive exit zone
This is NOT a bearish bet - it's SMART RISK MANAGEMENT after an incredible run.
If you own LRCX:
- ✅ Consider trimming 25-50% at $158-162 levels (lock in 100%+ gains if you bought <$80)
- 📊 Set mental stop at $150 (major support) to protect remaining position
- ⏰ Consider covered calls at $160-165 strikes (follow institutional playbook)
- 🎯 If holding through Q2 earnings (Jan 28), be prepared for volatility
- 🛡️ The institutional signal is CLEAR: de-risk at current levels
If you're watching from sidelines:
- ⏰ January 16th options expiration then January 28th earnings are key dates
- 🎯 Pullback to $145-150 would be EXCELLENT entry (8-14% correction for margin of safety)
- 📈 Looking for confirmation: Q2 earnings beat, WFE guidance raised, China restrictions don't worsen
- 🚀 Longer-term (2026), GAA transition and HBM demand support bullish case
- ⚠️ Current valuation (116% YTD) is EXTREME - only chase if momentum continues
If you're considering options:
- 🎯 The covered call strategy is the institutional pick (generates income, caps upside)
- 💀 Buying calls above $160 fights institutional flow (not recommended)
- ⚠️ Bear put spreads offer defined-risk way to bet on consolidation/pullback
- 📊 Iron condors in $150-165 range could work for range-bound view
- ⏰ All options strategies should account for Jan 28 earnings volatility
Mark your calendar - Key dates:
- 📅 December 19 - Monthly OPEX (near-term volatility)
- 📅 January 16, 2026 - Options expiration (THE TRADE!)
- 📅 January 28, 2026 - Q2 FY2026 earnings report (MAJOR catalyst!)
- 📅 2026 - GAA/HBM equipment orders materialize
Final verdict: LRCX's fundamental story is INCREDIBLY strong - WFE growth, GAA transition, HBM demand, dominant market positions. BUT at $158 after 116% rally with $600M China headwind and insider selling, the risk/reward is NO LONGER favorable for aggressive new positioning.
The $6.4M call seller is telling us: "Take profits now, reassess after earnings in late January."
Be smart. Respect the signal. Lock in gains. The semiconductor equipment cycle will still be here in Q2 2026, and you'll sleep better at night with profits banked.
Stay sharp, manage risk, and may the gamma be with you! 💪
Disclaimer: Options trading involves substantial risk of loss and is not suitable for all investors. This analysis is for educational purposes only and not financial advice. Past performance doesn't guarantee future results. The Z-scores and unusual classifications reflect statistical analysis of recent trading patterns - they do not imply the trades will be profitable or that you should follow them. Always do your own research and consider consulting a licensed financial advisor before trading.
About Lam Research Corporation (LRCX): Lam Research is a leading global supplier of semiconductor wafer fabrication equipment and services with ~$21.8B market cap, specializing in plasma etch (55% global share), deposition systems, advanced packaging solutions, and cleaning systems for leading-edge chip production.