💎 LRCX $4.9M Put Close - Smart Money Locks In Gains Near All-Time Highs! 🔒
📅 December 23, 2025 | 🔥 Unusual Activity Detected
🎯 The Quick Take
Someone just closed $4.9 MILLION worth of March put protection on Lam Research (LRCX) this morning at 10:14:56! This BTC (Buy to Close) order for 5,000 contracts of $160 strike puts expiring March 20th suggests institutional players are taking profit on their downside hedges as LRCX trades at $175.19, just shy of all-time highs of $176. With the stock up 114.8% YTD and semiconductor equipment spending hitting record levels, smart money is closing protection they no longer need. Translation: The big players are feeling confident enough to remove their insurance!
📊 Company Overview
Lam Research Corporation (LRCX) is a global leader in semiconductor manufacturing equipment, specializing in the critical "deposition and etch" technologies that build and selectively remove layers during chip fabrication:
- Market Cap: $220.1 Billion (4th largest in semiconductor equipment)
- Industry: Special Industry Machinery / Semiconductor Equipment
- Current Price: $175.19 (near all-time high of $176.00)
- Headquarters: Fremont, California
- Employees: 19,400
- Primary Business: Leading market position in etch equipment, second-largest share in deposition systems. Serves major chipmakers including TSMC, Samsung, Intel, and Micron with particular exposure to memory chip production (DRAM and NAND).
💰 The Option Flow Breakdown
The Tape (December 23, 2025 @ 10:14:56):
| Time | Symbol | Side | Buy/Sell | Type | Expiration | Premium | Strike | Volume | Spot | Option Price | Strategy |
|---|---|---|---|---|---|---|---|---|---|---|---|
| 10:14:56 | LRCX | BID | BUY | PUT $160 | 2026-03-20 | $4.9M | $160 | 5,000 | $175.19 | $9.80 | BTC (Buy to Close) |
🤓 What This Actually Means
This is closing out downside protection on a massive long position! Here's the breakdown:
- 💸 Premium to close: $4.9M ($9.80 per contract × 5,000 contracts)
- 🔒 Protection level: $160 strike was 8.7% below current price when originally purchased
- ⏰ Timing insight: 87 days to March 20 expiration - closing with plenty of time remaining
- 📊 Size matters: 5,000 contracts represents 500,000 shares worth ~$87.6M
- 🏦 Institutional confidence: Smart money removing insurance = bullish signal
- 🎯 Z-Score: 1.57 (Above Average) - significant but not extreme positioning
What's really happening here: This trader originally bought these March $160 puts when LRCX was probably trading in the $160-170 range (likely in late November/early December) as protection against a pullback. Now with LRCX at $175+ and holding strong near all-time highs, they're closing the hedge early rather than letting it expire worthless. This is smart trade management - recapture whatever premium is left ($9.80/contract) instead of watching it decay to zero.
The bullish implication: When institutions close protective puts while the underlying is still rallying, it signals confidence that the uptrend has legs. They're essentially saying "we don't need this insurance anymore - the downside risk we were worried about hasn't materialized and we're comfortable staying long without protection."
Why close now instead of letting it expire?
- 💰 Recapture $4.9M in premium rather than letting it decay to zero
- 📈 Redeploy capital into new positions or roll protection higher
- 🎯 Risk management: if LRCX continues rallying, these puts become increasingly worthless
- ⏰ Time decay accelerates as expiration approaches - better to close now with 87 days left
📈 Technical Setup / Chart Check-Up
YTD Performance Chart
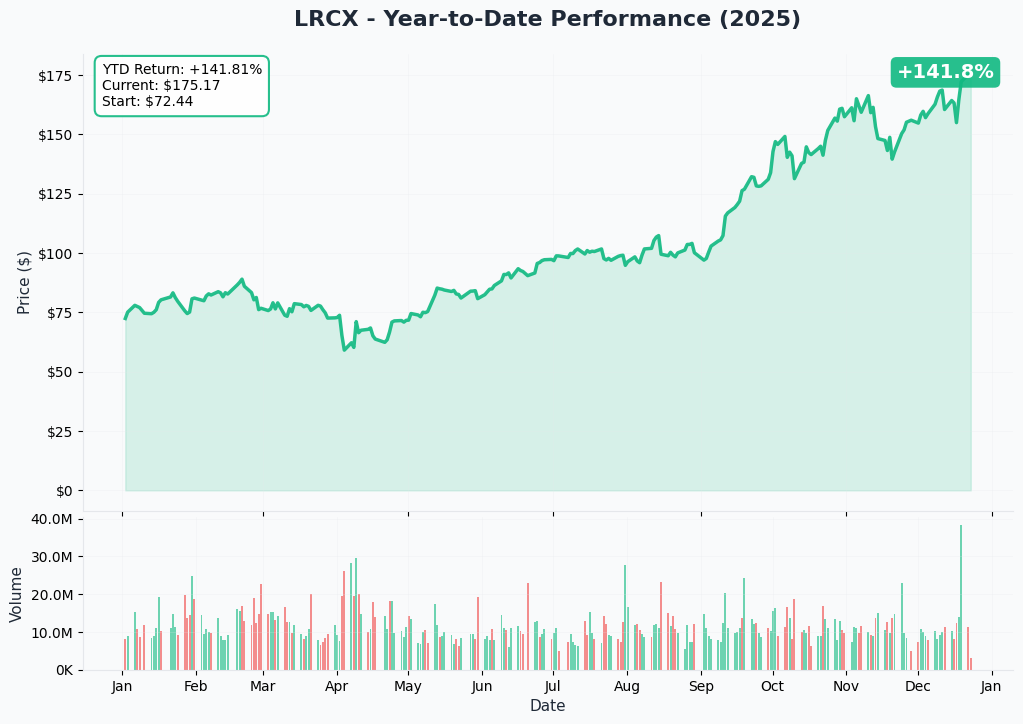
LRCX has absolutely dominated - up +114.8% YTD with current price of $175.19, approaching the all-time high of $176.00 set in December. The chart tells a powerful semiconductor equipment growth story driven by the AI infrastructure buildout and record WFE (Wafer Fab Equipment) spending.
Key observations:
- 🚀 Monster rally: Explosive move from $90-100 in Q2 to $175+ in December on AI/HBM demand
- 📈 Breakout confirmed: Smashed through $140 resistance in late summer, never looked back
- 💪 Strong momentum: Making new all-time highs heading into year-end
- 📊 Institutional accumulation: Consistent higher lows throughout the year show confidence
- 🎯 Trend intact: Trading above all major moving averages with positive slope
Gamma-Based Support & Resistance Analysis
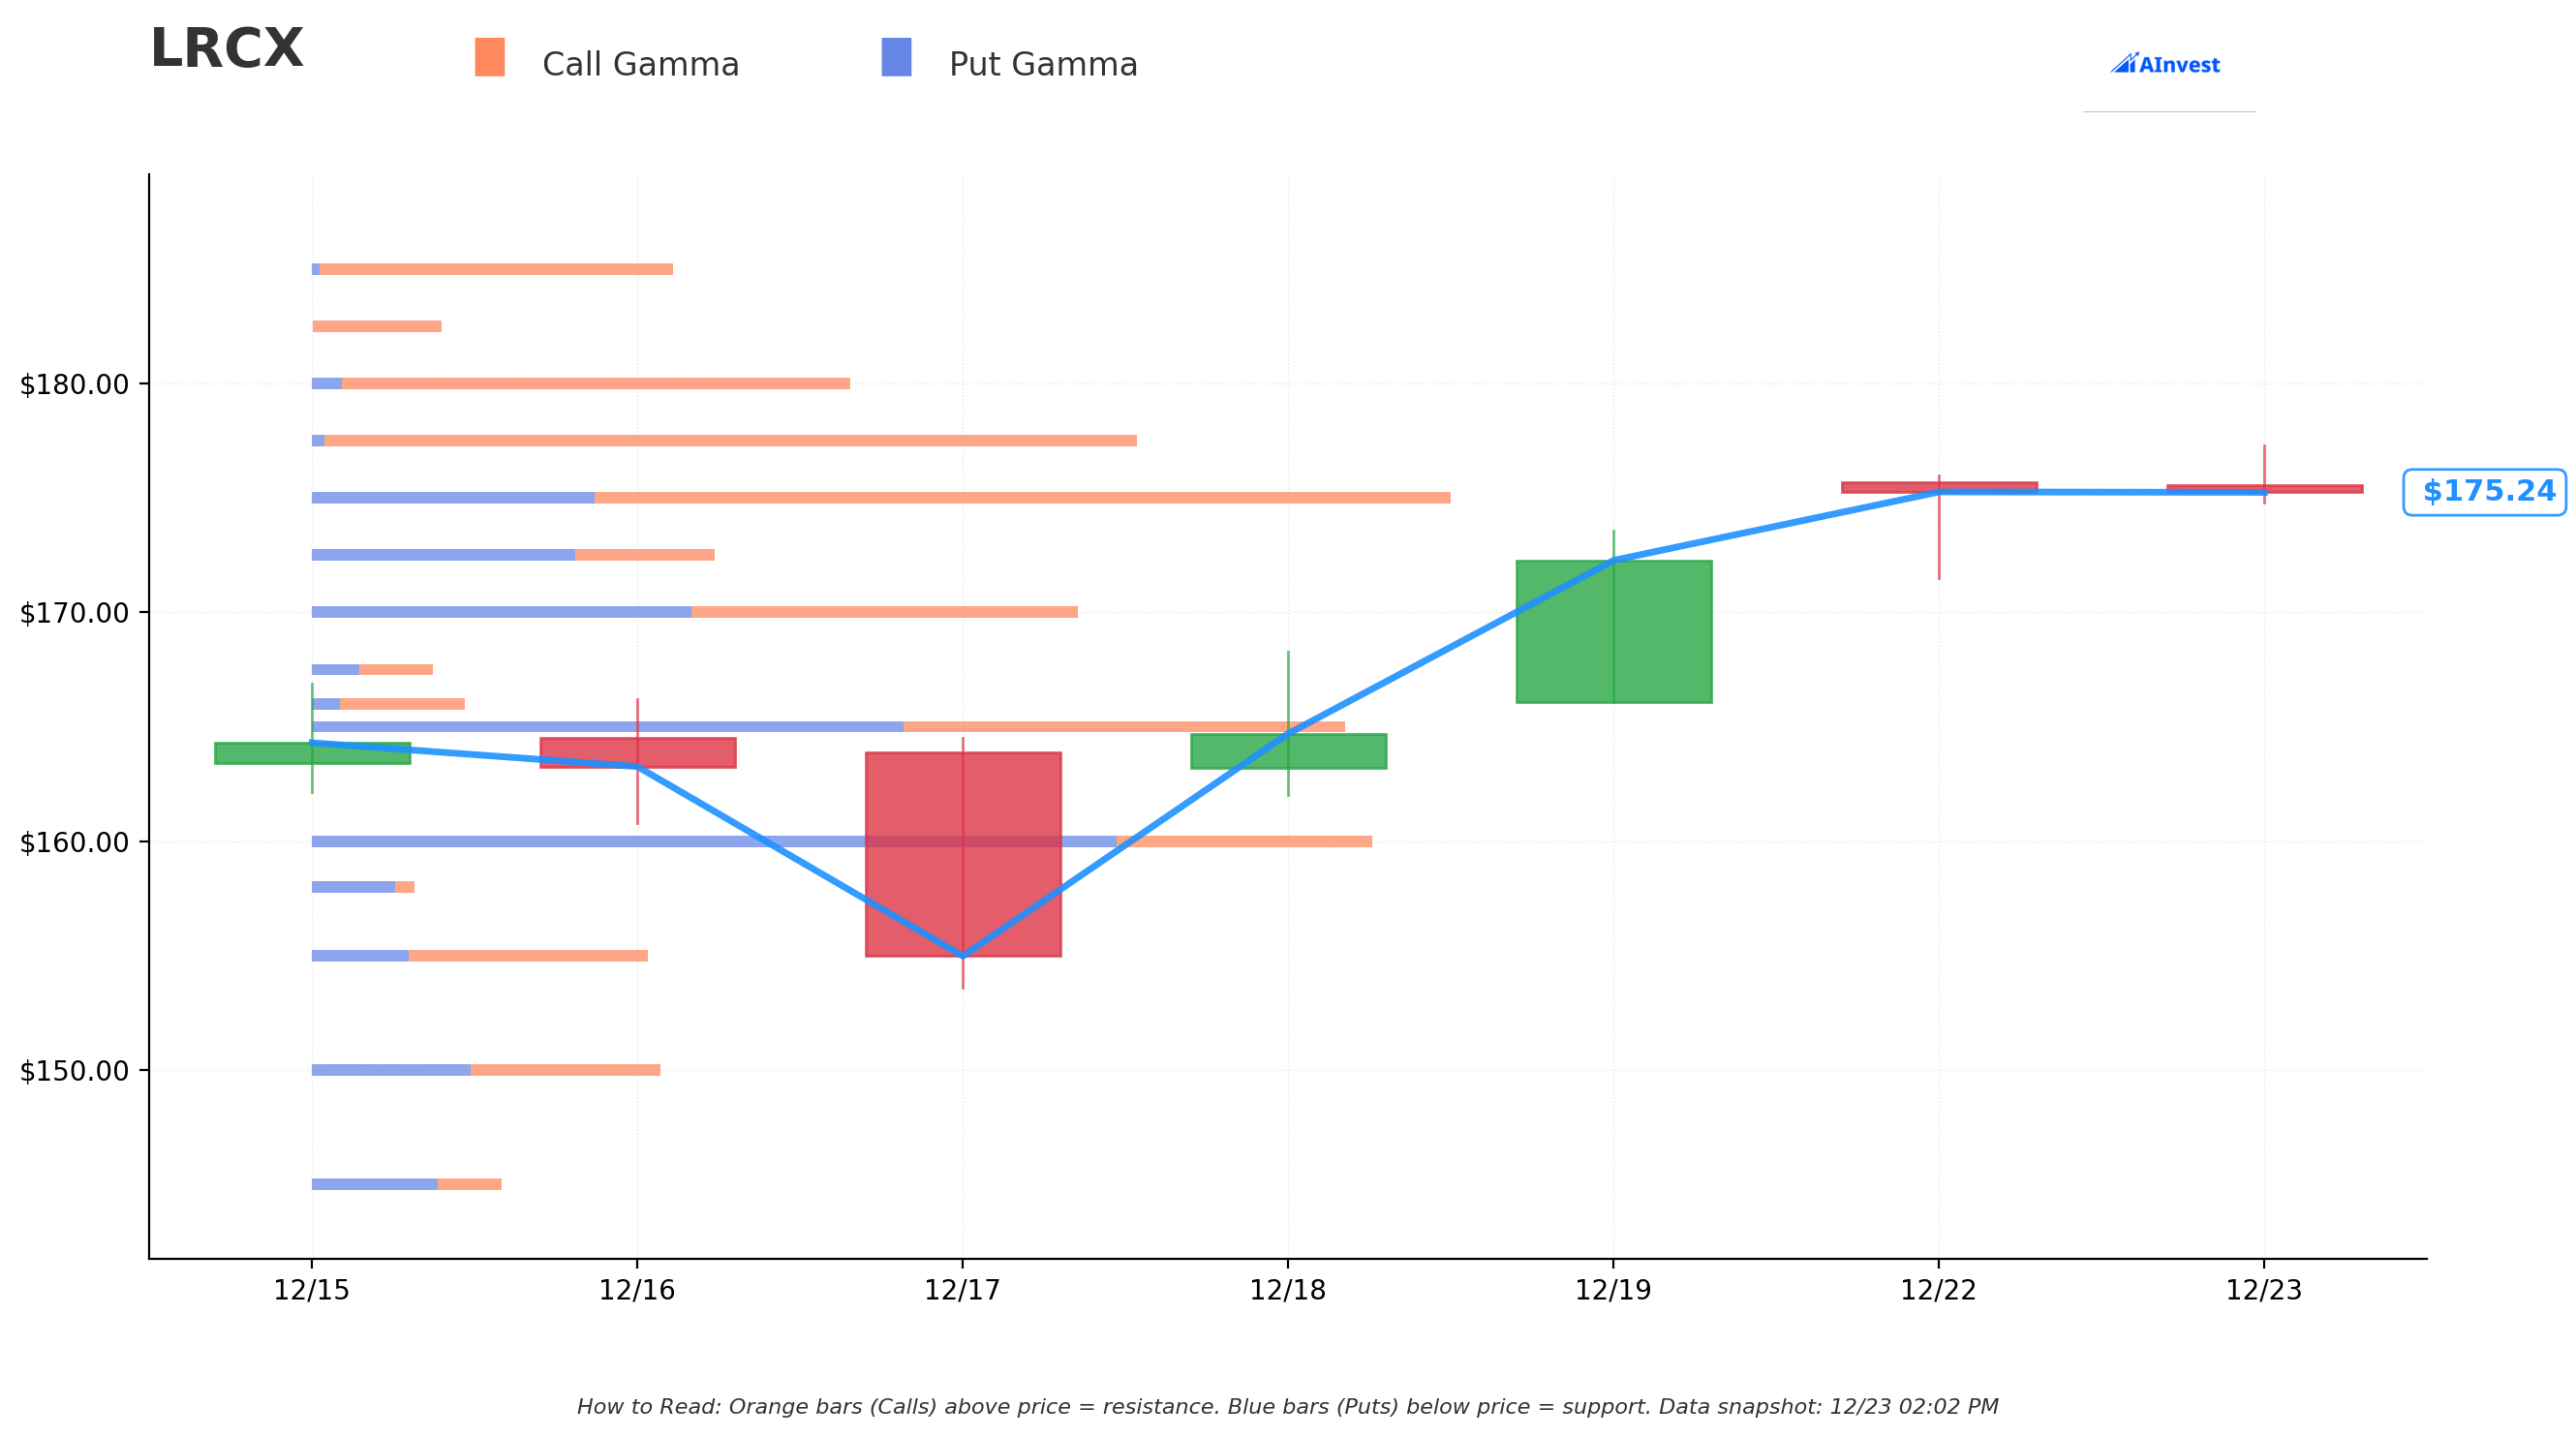
Current Price: $175.19
The gamma exposure map reveals critical price magnets and barriers for near-term trading:
🔵 Support Levels (Put Gamma Below Price):
- $172.50 - Put Wall with significant gamma concentration (strongest nearby floor!)
- $170 - Secondary support zone where dealers will defend
- $165 - Major structural floor if $170 breaks
- $160 - Deep support (exactly where this put was struck! Not coincidental)
- $155 - Extended support zone if selloff accelerates
🟠 Resistance Levels (Call Gamma Above Price):
- $180 - HVL (High Volatility Level) and Call Wall with 0.213B call gamma (MASSIVE RESISTANCE)
- $182.50 - Secondary ceiling with 0.140B call gamma
- $185 - Major resistance zone with 0.158B gamma
- $187.50 - Extended resistance at 0.099B gamma
- $190 - Big barrier with 0.131B call gamma (psychological $200 next)
- $195 - Upper range resistance
- $205 - Extended upside target with 0.050B gamma
What this means for traders: LRCX is approaching the $180 level which represents the single largest gamma concentration (0.213B call gamma). This is both the HVL and Call Wall - meaning market makers have HUGE positions here and will create natural selling pressure as price approaches. Think of $180 as a "gamma magnet" that could pull price higher but also act as a lid preventing easy breakouts.
The $172.50 Put Wall below current price provides strong downside support. The fact that institutions are closing $160 puts suggests they're comfortable with the $172.50 floor holding - they don't see a realistic path back to $160 in the near term.
Net GEX Bias: Bullish (positive net gamma at key levels) - Call gamma exceeds put gamma at most strikes, indicating overall bullish positioning. The setup favors continued grind higher toward $180, then consolidation before attempting $185-190.
Implied Move Analysis
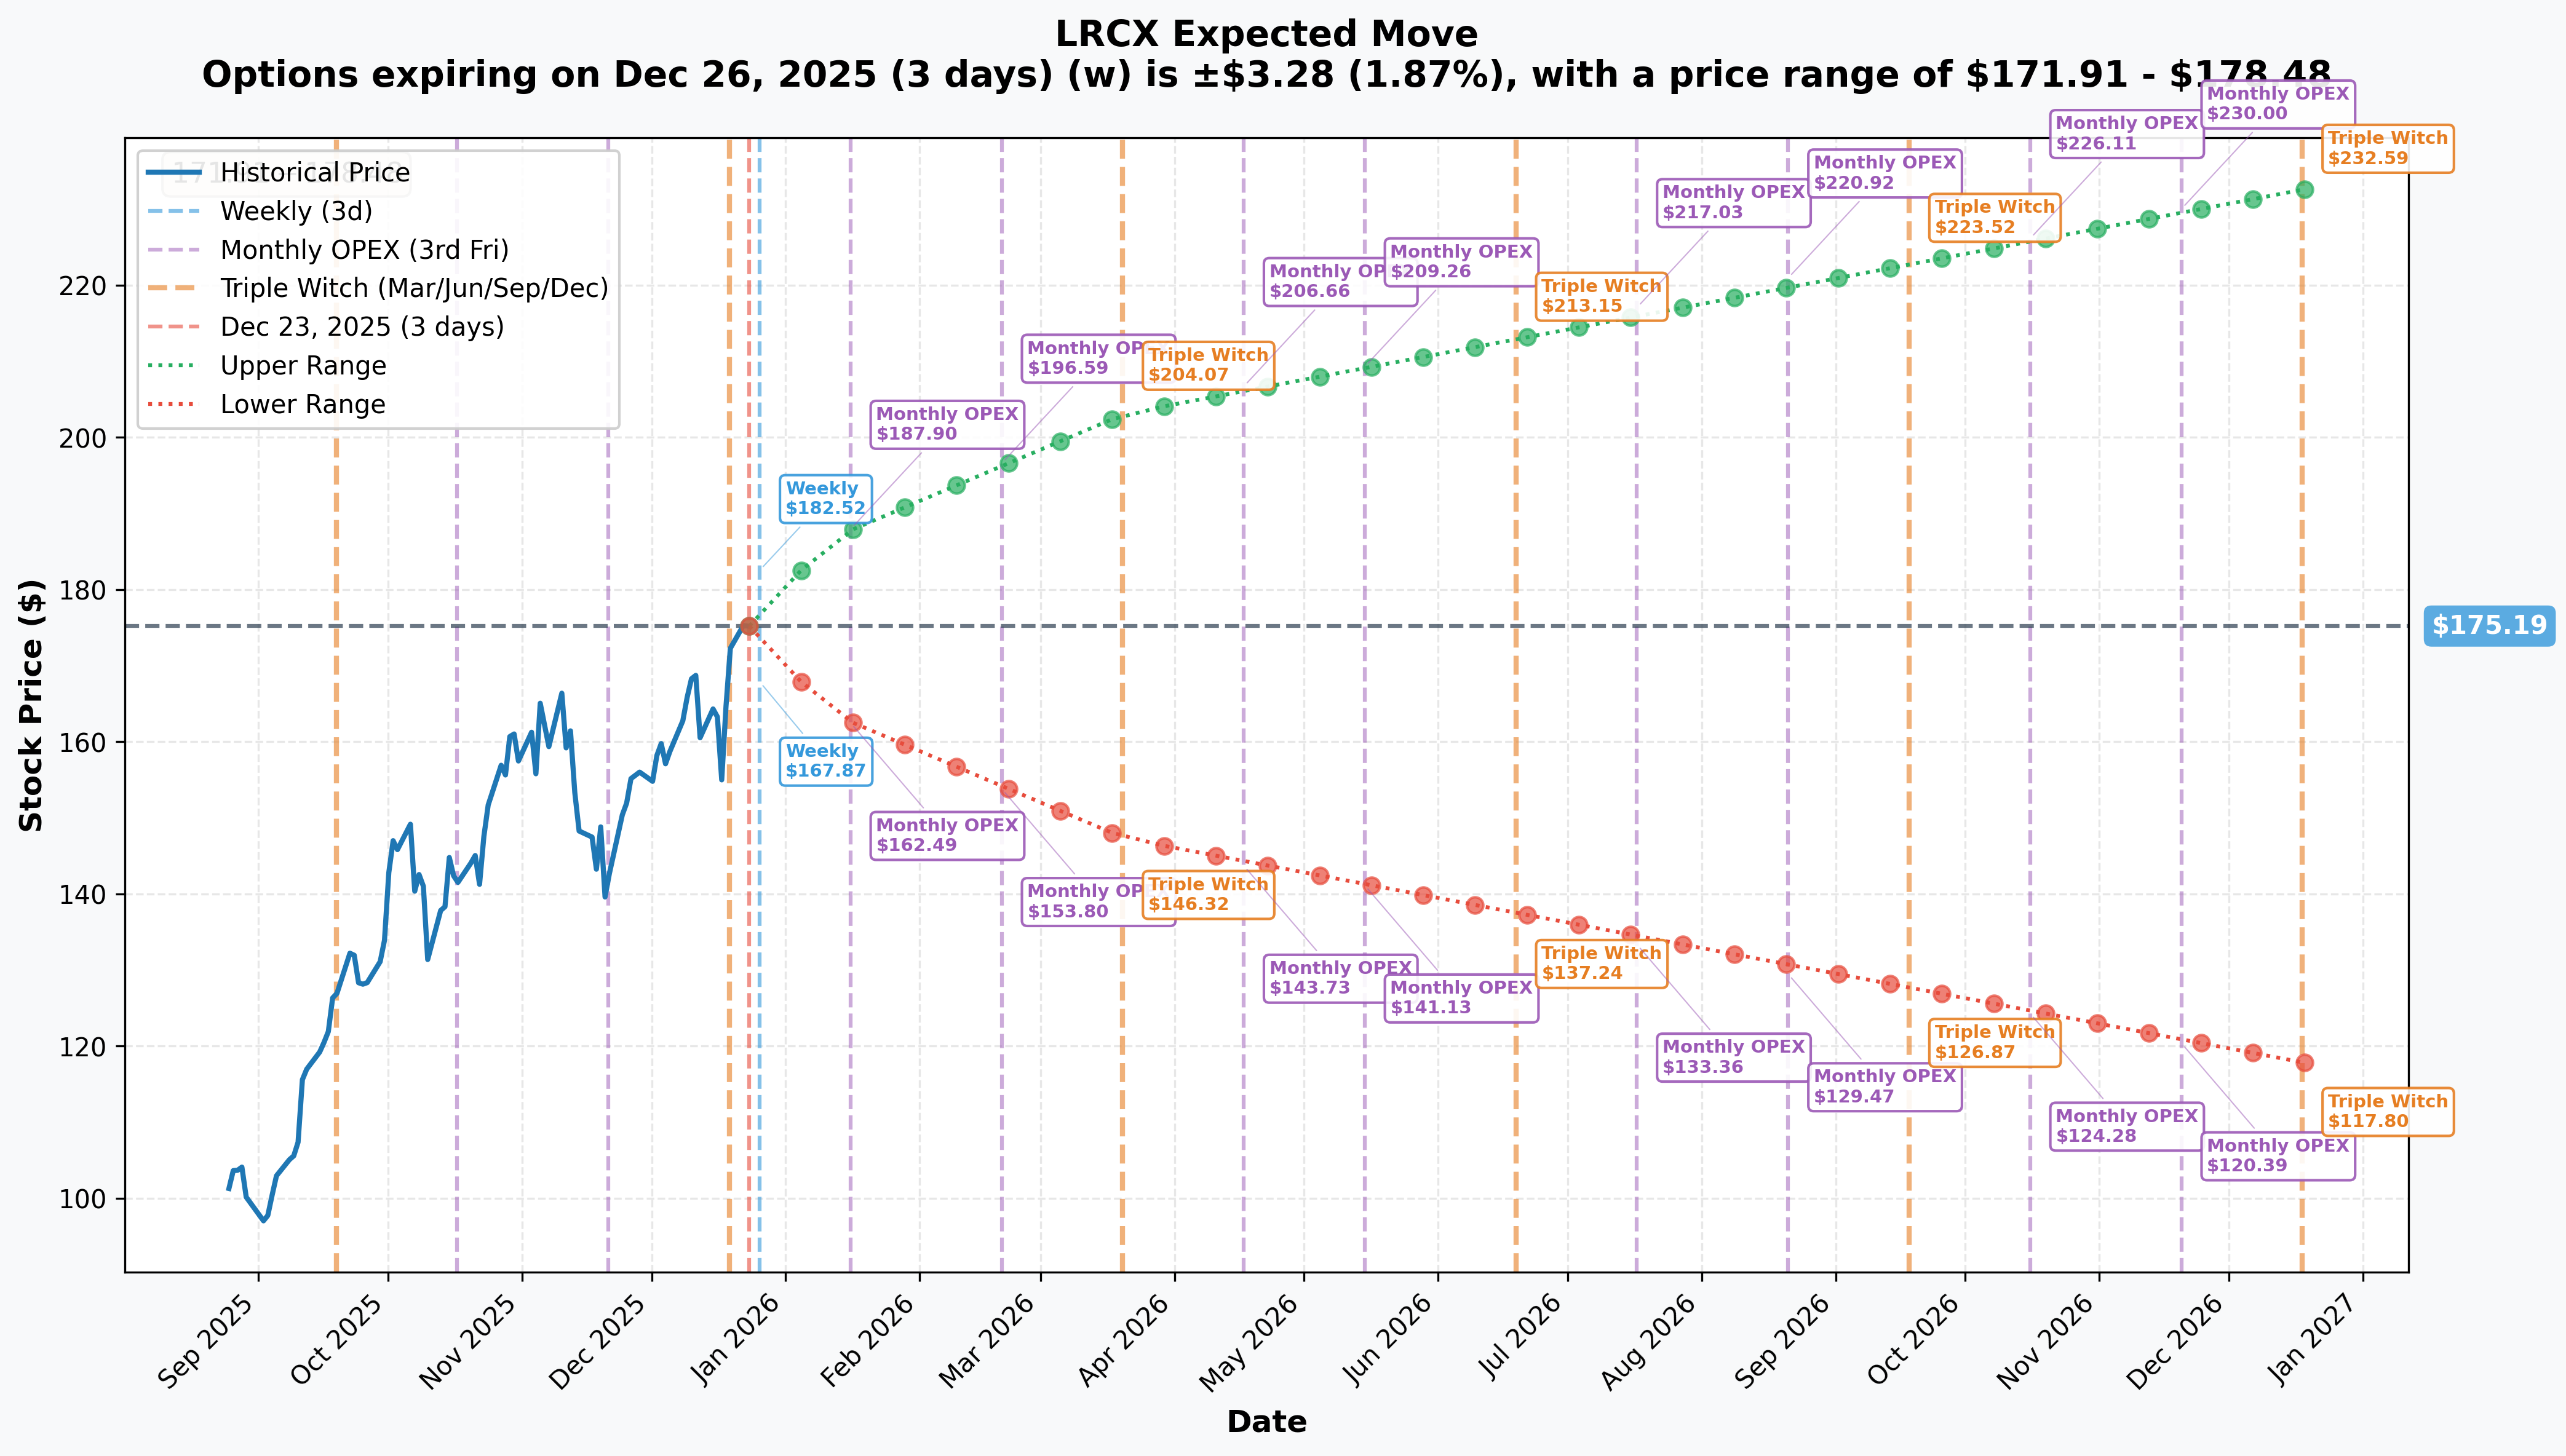
Options market pricing for upcoming expirations:
- 📅 Weekly (Dec 26 - 3 days): ±$3.28 (±1.87%) → Range: $171.91 - $178.48
- 📅 Monthly OPEX (Jan 16 - 24 days): ±$12.71 (±7.25%) → Range: $162.49 - $187.90
- 📅 Quarterly Triple Witch (Mar 20 - 87 days - THIS TRADE!): ±$27.90 (±15.93%) → Range: $147.29 - $203.10
Translation for regular folks: Options traders are pricing in a modest 1.9% move ($3) through this week as markets wind down for the holidays, but a much larger 7.3% move ($13) through January OPEX which likely captures Q4 earnings expectations. The quarterly expiration in March (when these puts expire) shows an even bigger 15.9% expected range ($28) - acknowledging significant uncertainty around the full semiconductor cycle.
The March 20th range of $147-$203 tells us the market sees real two-way risk over the next 3 months. The fact that traders are closing $160 protection when the lower bound is $147 suggests they believe the downside case ($147-160) is much less likely than when they originally bought the hedge.
Key insight: The relatively low weekly implied move (1.87%) reflects the quiet holiday period, while the expansion to 7.25% monthly and 15.93% quarterly shows increasing uncertainty around earnings, WFE spending forecasts, and China exposure as we move into 2026.
🎪 Catalysts
🔥 Immediate Catalysts (Already Happened)
Q1 FY2026 Earnings - October 22, 2025 (BEAT EXPECTATIONS!) 📊
Lam Research crushed quarterly results that exceeded analyst expectations, as detailed in the earnings call:
- 📊 Revenue: $5.32 billion (up 27.7% YoY vs estimate of $5.23 billion)
- 💰 EPS: $1.26 (beat consensus of $1.22 by $0.04)
- 🎯 Gross Margin: 50.6% (record level - expanding profitability!)
- 📈 Operating Margin: 35% (record level)
- 🤖 Systems Revenue: +48.3% YoY driven by AI-related demand and HBM investments
The company delivered record performance despite a $200 million revenue impact from export restrictions on shipments to certain Chinese customers. Management emphasized that AI-driven semiconductor demand has fueled exceptional results and continues to drive order momentum.
Advanced Packaging Revenue Milestone
The company crossed $1 billion in advanced packaging-related revenues in calendar year 2024, with management projecting this segment to triple to more than $3 billion in 2025. This explosive growth reflects increasing demand for high-bandwidth memory (HBM) and advanced logic applications critical to AI infrastructure.
Analyst Upgrades Wave (November-December 2025)
LRCX received multiple price target increases following strong fundamentals:
- Citigroup: Raised target to $190 from $175 (November 12)
- UBS: Lifted target from $165 to $175 (November 25)
- Jefferies: Reaffirmed "buy" with $200 target, up from $175 (December 15)
- Mizuho: Set price target of $200 (December 17)
- Cantor Fitzgerald: Raised target to $210 from $170 (highest on Street!)
- Bank of America: Raised target to $195 from $165
Consensus: Strong Buy based on 17 buy ratings, 5 hold ratings, 0 sell ratings. Average price target of $172.95 implies modest upside from current levels, but highest targets at $200-210 suggest 14-20% potential if execution continues.
Building G Facility Expansion - November 21, 2025
Lam Research held a ribbon-cutting ceremony for "Building G", a new $65 million, four-story, 120,000-square-foot facility at its Tualatin, Oregon campus. This expansion demonstrates commitment to scaling production capacity to meet surging demand for semiconductor manufacturing equipment.
🚀 Upcoming Catalysts (Next 6 Months)
Q2 FY2026 Earnings - January 28, 2026 (35 DAYS AWAY!) 📊
Lam Research will release next earnings report after market close on January 28, 2026. This is THE near-term catalyst that will validate whether AI-driven momentum continues.
Consensus Estimates:
- Revenue: $5.21 billion (guidance: $5.2 billion ± $300 million)
- Gross Margin: 48.5% ± 1 percentage point
- Expected Impact: $200 million revenue impact in December quarter from export restrictions on certain Chinese customers
Key Metrics to Watch:
- 🤖 Data center AI equipment demand trends
- 💾 HBM-related system sales progression toward $3 billion annual target
- 🇨🇳 China revenue composition (guidance shifting below 30% for 2026)
- 🏭 Foundry segment revenue growth (expected at least 30% in 2025)
- 📊 Etch and deposition intensity trends (moving from low 30% to high 30% of WFE)
Investor Significance: This report will be critical for validating management's outlook for 2026 amid China headwinds and confirming whether AI-driven demand can sustain record revenue growth trajectory.
Akara Conductor Etch System Ramp (2025-2026)
Lam Research unveiled Akara on February 19, 2025, positioning it as "the most advanced conductor etch tool available":
Key Features:
- ⚡ Leverages proprietary DirectDrive technology delivering plasma responses 100x faster than previous generation
- 🎯 Enables angstrom-level precision for atomic-scale features
- 🏭 Selected by leading device manufacturers as production tool of record for multiple advanced planar DRAM and foundry GAA applications
- 🤖 Integrated on Lam's high-productivity Sense.i platform with Equipment Intelligence solutions
Applications: Scaling of gate-all-around (GAA) transistors, 6F2 DRAM, 3D NAND devices, extendible for 4F2 DRAM and 3D DRAM
Revenue Impact: Akara represents a major competitive advantage in conductor etch, a segment where Lam holds 35% market share. As customers transition to 2nm/GAA nodes in 2026, Akara adoption should drive incremental systems revenue.
2nm/Gate-All-Around (GAA) Technology Ramp
The foundry segment is expected to see robust growth in 2026 as chipmakers transition to 2nm process nodes:
- 🏭 TSMC: Expected to ramp 2nm production in second half of 2025, migrating to GAA technology using nanosheet field-effect transistors
- 🌐 Samsung: Multiple fabless firms evaluating Samsung's 3nm and 2nm nodes
- 💻 Intel: Intel 18A achieved production status in July 2025
Impact on Lam Research: Well-positioned to benefit from expansion in foundry revenue as 2nm/GAA technology scales. The company expects foundry segment revenue growth of at least 30% in 2025, driven primarily by TSMC spending. GAA transitions require more complex etch and deposition processes, driving higher equipment intensity.
High Bandwidth Memory (HBM) Expansion
HBM demand represents one of the strongest secular growth drivers for Lam through 2026:
Market Dynamics:
- 💾 HBM manufacturing requires 2-3 times more process steps than conventional memory
- 📊 Industry transitioning from 8-high to 12-high and even 16-high stacks
- 🚀 Micron signaled that HBM supply tightness could persist beyond 2026
Revenue Projections:
- 💰 LRCX's revenue could grow at CAGR of 15-20% through 2026, supported by booming HBM demand
- 📈 NAND WFE segment expected to grow at about 28% annually to roughly $14 billion by 2026
- 🎯 Advanced packaging revenues expected to triple to more than $3 billion in 2025
📊 2026 WFE Market Forecasts
Record Spending Projected:
According to SEMI's latest forecasts:
- 💰 2025 Total Equipment Sales: $133 billion (+13.7% YoY)
- 🚀 2026 Total Equipment Sales: $145 billion (+9.0% YoY)
- 📈 2027 Total Equipment Sales: $156 billion (record high)
Segment Breakdown for 2026:
- 🏭 Foundry/Logic Equipment: $69.3 billion (+15% YoY) driven by AI and HPC capacity builds
- 💾 NAND Equipment: $15.7 billion (+12.7% YoY)
- 🎯 DRAM Equipment: Continued growth (+15.1% YoY) as suppliers ramp HBM
- 📊 Assembly & Packaging: +9.2% growth from advanced packaging adoption
Lam's Market Position: The company is expected to outperform overall WFE growth because "etch-and-dep intensity is growing" from the low 30% to the high 30% over several years, with 2026 being "just a guidepost along that journey."
⚠️ Risk Catalysts (Watch Carefully)
China Export Restrictions & Tariff Uncertainty 🇨🇳
LRCX faces significant China exposure challenges:
- 📊 China accounted for 35% of revenue in fiscal Q4 2025 ($1.84B of $5.17B total)
- 🚨 Management expects $600 million revenue impact in calendar year 2026 from new restrictions
- 🇨🇳 WFE spending in China projected to drop -20% to -25% YoY in 2025
- ⚖️ Lam's China revenue guidance shifts below 30% for 2026
Potential margin pressure: "If credible tools arrive 20-30% cheaper, incumbents may face margin pressure" from Chinese-linked toolmakers, highlighting structural concern about low-cost competition.
Competitive Threats from Broader Portfolio Players
Market share challenges:
- 📊 LRCX holds 7.52% market share vs Applied Materials (13.55%) and ASML (15.57%)
- 🌐 Applied Materials has broader product range as "one-stop-shop"
- ⚡ ASML dominates EUV lithography with 100% market share
- 🛡️ Lam's differentiation: 43% service revenue (vs 23% peers average), technology innovation leadership
🎲 Price Targets & Probabilities
Using gamma levels, implied move data, upcoming catalysts, and analyst consensus, here are scenarios through March 20th expiration:
📈 Bull Case (35% probability)
Target: $195-$210
How we get there:
- 💪 January 28 earnings BEAT expectations with revenue toward $5.5B high-end and gross margins expanding to 51%+
- 🚀 HBM/advanced packaging revenue tracking ahead of $3B 2025 target
- 🤖 WFE spending forecasts raised for 2026 beyond current $145B consensus
- 🌐 China headwinds prove manageable - no additional export restrictions announced
- 📈 Akara etch system wins at multiple leading-edge customers validate technology leadership
- 💰 Analysts raise targets toward Cantor Fitzgerald's $210 high-end
- 🎯 Breakout above $180 gamma resistance triggers technical rally to $190-195, then $205
Key metrics needed:
- Data center/AI equipment demand accelerating beyond expectations
- Gross margins sustaining at 50%+ levels (pricing power intact)
- Foundry segment revenue growth exceeding 30% guidance
- Market share gains in etch/deposition versus Applied Materials
Gamma pathway: Clear path through $180 (0.213B), $185 (0.158B), $190 (0.131B), toward $195 (0.113B) and $205 (0.050B) if momentum sustains.
Probability assessment: 35% requires strong execution across multiple fronts with stock already up 115% YTD. However, the institutional closing of downside protection signals confidence this scenario is realistic. WFE market tailwinds and HBM growth provide fundamental support.
🎯 Base Case (50% probability)
Target: $170-$185 range (STEADY GRIND HIGHER)
Most likely scenario:
- ✅ Solid January earnings meeting consensus ($5.2B revenue, maintaining 48-50% gross margins)
- 📱 Advanced packaging/HBM ramp progressing as expected toward $3B target
- ⚖️ China revenue declining as guided but offset by strength in Taiwan/Korea/US
- 🤖 WFE spending for 2026 confirmed at $145B with LRCX capturing share gains
- 🇨🇳 No major new export restrictions, but overhang remains
- 🔄 Trading within support ($172.50) and resistance ($180-185) bands through Q1
- 📊 Consolidation after 115% YTD run - market digesting gains, waiting for next catalyst
- 💤 Modest volatility as options repricing post-March earnings
This scenario explains the put closing: Stock consolidates in healthy range above $170, puts that were struck at $160 become clearly unnecessary. Better to take the $4.9M off the table and redeploy. Downside protection served its purpose during the rally but no longer needed.
Gamma dynamics: Price gravitates toward $180 HVL/Call Wall (strongest gamma magnet), tests it multiple times but struggles to break convincingly. $172.50 Put Wall holds on any dips. Range-bound chop for weeks.
Why 50% probability: Most realistic outcome given strong fundamentals, supportive WFE outlook, but stock at elevated levels after monster run. Institutions comfortable removing hedges but not aggressively adding at current prices. Wait-and-see mode.
📉 Bear Case (15% probability)
Target: $155-$165 (TEST THE PUT STRIKE!)
What could go wrong:
- 😰 January earnings miss or conservative guidance disappoints at current valuation
- 🚨 China export restrictions expanded to additional products/customers beyond current $600M impact
- ⏰ WFE spending forecasts for 2026 lowered from $145B due to macro uncertainty
- 💸 Gross margins compress below 48% from competitive pricing pressure
- 🇨🇳 China WFE spending declines more than -25% expected, removing 35% revenue source
- 📊 Memory market correction as HBM supply tightness eases faster than expected
- 🌍 Broader semiconductor equipment downturn drags sector lower
- 💰 Applied Materials or ASML weakness creates sector headwinds
- 🔨 Break below $172.50 Put Wall triggers cascade to $165, then $160
Critical support levels:
- 🛡️ $172.50: Put Wall - MUST HOLD or momentum shifts bearish
- 🛡️ $165: Major gamma floor - heavy buying likely here
- 🛡️ $160: Deep support + this put strike - ultimate floor for March timeframe
Probability assessment: Only 15% because fundamentals remain strong (record margins, AI/HBM tailwinds, WFE growth), and China headwinds already priced in at current $600M estimate. The fact institutions are CLOSING puts rather than adding them signals low probability of significant downside. Would require multiple negative surprises to reach $160.
Put P&L context (for original seller):
- If stock at $160 on Mar 20: Puts worth $0 (at-the-money), closed at $9.80 saved max loss scenario
- If stock at $155 on Mar 20: Puts would be worth $5.00, closed at $9.80 = lost potential $4.80 gain but avoided max loss
- Current scenario at $175: Puts worth ~$0.50, closed at $9.80 = captured $9.30 of time value before decay
💡 Trading Ideas
🛡️ Conservative: Follow The Smart Money - Stay Long, No Hedges Needed
Play: If you own LRCX shares, remove protective puts like the institutions are doing
Why this works:
- 🎯 The $4.9M put close signals institutional confidence in $170+ floor holding
- 💪 Stock at all-time highs after record earnings with WFE tailwinds intact
- 📊 $172.50 Put Wall provides strong technical support
- 🚀 HBM/advanced packaging revenue tripling to $3B creates multi-year growth visibility
- ⏰ January 28 earnings likely to confirm momentum (consensus at $5.2B revenue)
- 🌐 China headwinds ($600M impact) already priced in and guided for
Action plan:
- ✅ If holding protective puts similar to this trade, consider closing them and pocketing remaining time value
- 💰 Reallocate the premium saved (~$5-10/contract) into buying more shares on any dip to $172-173
- 🎯 Set mental stop at $170 (below Put Wall support) if you need downside discipline
- 📈 Let position run toward $180-185 resistance through Q1 2026
- ⏰ Re-evaluate after January 28 earnings - if beat, could leg into calls for $190-200 targets
Position sizing: This is for existing LRCX shareholders looking to reduce hedging costs
Risk level: Low-moderate (unhedged long stock, but strong fundamentals) | Skill level: Beginner-friendly
Expected outcome: Save premium on puts that would expire worthless, stay positioned for continued uptrend toward $180-190. If earnings disappoint, $172.50 support should limit downside to 3-4%.
⚖️ Balanced: Bullish Call Spread Into Earnings
Play: Buy call spread targeting $180-185 resistance into January earnings catalyst
Structure: Buy $180 calls, Sell $190 calls (March 20 expiration - SAME as the put trade)
Why this works:
- 🎯 Targets gamma resistance levels at $180 (HVL/Call Wall) and $190 where institutions are positioned
- 📊 Defined risk spread ($10 wide = $1,000 max risk per spread)
- ⏰ March expiration gives 87 days for earnings catalyst and WFE updates to play out
- 💪 Institutions closing puts signals they expect upside - align with smart money
- 🎢 Spread is cheaper than outright calls, reducing IV cost
- 🚀 If earnings beat and stock breaks $180, spread captures move to $190
Estimated P&L (current pricing):
- 💰 Pay ~$3.50-4.50 net debit per spread
- 📈 Max profit: $5.50-6.50 if LRCX above $190 at March expiration (125-180% ROI)
- 📉 Max loss: $3.50-4.50 if LRCX below $180 (defined and limited)
- 🎯 Breakeven: ~$183.50-184.50
- 📊 Risk/Reward: ~1.5:1 which is solid for bullish directional play
Entry timing:
- ⏰ Enter NOW through year-end if you want full earnings exposure
- 🎯 Alternative: Wait until Jan 2-3 if you prefer to enter after holiday lull
- ❌ Don't wait until week of earnings (Jan 27) - IV will spike and premium gets expensive
Position sizing: Risk only 3-5% of portfolio per spread (can do 2-3 spreads for bigger position)
Risk level: Moderate (defined risk, directional bullish bet) | Skill level: Intermediate
Exit strategy:
- 📈 Close at 75-80% max profit if reached early (don't wait for expiration)
- 📊 After earnings, if stock below $177, close to salvage remaining value
- ⏰ If holding to March, start managing at $185+ to lock gains
🚀 Aggressive: Earnings Long Straddle - Bet on BIG MOVEMENT (ADVANCED!)
Play: Buy straddle betting January earnings creates volatility exceeding implied move
Structure: Buy $175 calls + Buy $175 puts (January 16 expiration to capture earnings)
Why this could work:
- 💥 Implied move "only" 7.25% ($12.71) but LRCX has beaten that in past
- 🎰 Stock at all-time highs - could EXPLODE either direction on earnings
- 📊 China uncertainty ($600M impact) creates binary risk - guidance could surprise up OR down
- 🚀 HBM revenue update could significantly beat or miss the $3B trajectory
- ⚡ Need stock to move >8-10% either way to profit after IV crush
- 🎯 Recent volatility and 115% YTD gain suggests potential for outsized moves
Why this could blow up (SERIOUS RISKS):
- 💸 EXPENSIVE: January straddle costs ~$14-16 ($1,400-1,600 per straddle)
- ⏰ TIME DECAY KILLER: Theta burns heavily as earnings approaches
- 😱 IV CRUSH: Even if stock moves 6-8%, IV collapse could still cause LOSS on both legs
- 📊 Two-way risk: Stock could stay in $170-180 range and you lose entire premium
- 🎢 Need 9-10% move just to breakeven after IV crush
- ⚠️ Earnings could be "good but boring" - stock gaps to $180 (only 3% move) and straddle loses 40-60%
Estimated P&L:
- 💰 Cost: ~$14-16 per straddle (using Jan 16 expiration)
- 📈 Profit scenario: Stock moves to $190 or $160 (8-10% move) = $9-11 gain (60-70% ROI)
- 🚀 Home run: Stock moves to $200 or $150 (14-15% move) = $25+ gain (150%+ ROI)
- 📉 Loss scenario: Stock ends $172-178 range = lose $8-14 (50-90% loss)
- 💀 Total loss: Stock flat at $175 = lose entire $14-16 (100% loss)
Breakeven points:
- 📈 Upside breakeven: ~$189-191 (need 8-9% rally)
- 📉 Downside breakeven: ~$159-161 (need 9-10% drop)
CRITICAL WARNING - DO NOT attempt unless you:
- ✅ Have traded straddles through earnings before and understand IV mechanics
- ✅ Can afford to lose ENTIRE premium (very realistic possibility!)
- ✅ Understand you're betting AGAINST the market's 7.25% implied move
- ✅ Can monitor position day-after earnings and take profits/losses quickly
- ✅ Accept that even if you're RIGHT on direction, timing of IV crush could cause loss
- ⏰ Plan to close within 24-48 hours post-earnings (don't hold to expiration!)
Risk level: EXTREME (can lose 100% of premium) | Skill level: Advanced only
Probability of profit: ~35-40% (lower than 50/50 due to IV crush dynamics)
⚠️ Risk Factors
Don't get blindsided by these potential landmines:
-
⏰ January 28 Earnings Binary Event: Results in 35 days create volatility risk. Stock could gap 5-10% either direction based on revenue ($5.0B vs $5.5B makes huge difference), margins (48% vs 51% changes narrative), and HBM traction commentary. LRCX expects $200M impact from China restrictions - any increase to that number would be negative surprise.
-
🇨🇳 China Exposure Still Massive Despite Guidance Cut: 35% of revenue from China in Q4 FY2025 even with restrictions. $600M revenue impact expected in 2026 is just current estimate - geopolitical tensions could trigger additional export controls without warning. China WFE spending projected to decline -20% to -25% removes major growth driver. Tariff escalation under new administration adds wildcard risk.
-
⚖️ Valuation at Premium Levels After 115% Run: Trading at elevated multiples versus historical averages near all-time highs. Stock priced for PERFECT execution on HBM ramp, Akara adoption, and WFE share gains. Zero margin of safety. Any disappointment magnified at current levels. Analog: 2018 peak when LRCX hit $220+ then crashed to $115 during 2019 memory downturn.
-
💰 Memory Market Cyclicality Risk: While HBM is structural growth story, broader NAND/DRAM remains cyclical. Micron's supply tightness comments suggest strength now, but what if capacity additions in H2 2026 flip to oversupply? Memory equipment orders are notoriously volatile - can drop 30-50% in down cycles.
-
🏭 Competitive Pressure from Applied Materials: Applied holds 13.55% market share vs LRCX 7.52% with broader product portfolio as "one-stop-shop." If customers consolidate suppliers to reduce complexity, could hurt LRCX's position. CFO warned about potential margin pressures from low-cost competition.
-
📊 Gamma Ceiling at $180 Creates Technical Resistance: Massive 0.213B call gamma at $180 HVL/Call Wall means market makers will systematically SELL into rallies to hedge exposure. This creates mechanical selling pressure making breakouts difficult. Multiple tests of $180 likely before clean break. Could frustrate bulls expecting easy move to $190-200.
-
🎯 HBM Revenue Target Aggressive: Tripling advanced packaging from $1B in 2024 to $3B in 2025 requires near-perfect execution. What if HBM transitions from 8-high to 12-high stacks happen slower than expected? What if customers qualify alternative suppliers? Any shortfall versus $3B target would hurt credibility.
-
🌐 WFE Forecasts Could Disappoint: Current $145B 2026 WFE estimate assumes macro stability. If recession emerges or AI infrastructure spending slows, could be revised down 10-15%. Enterprise IT budgets get cut first in downturn. LRCX's 2026 revenue expectations would need reset lower.
-
💸 Institutional Put Closing Could Be Profit-Taking, Not Confidence: Alternative interpretation of this trade: smart money took profits on hedge after massive rally, but ALSO taking profits on underlying shares. The put close could signal "we're out" rather than "we're staying fully long." Watch for unusual selling activity in coming weeks as confirmation.
-
🎢 Insider Selling Warning Sign: CEO Timothy Archer sold $18.6M worth (10.8% of holdings) on December 17. Over past 6 months, insiders conducted 8 sales totaling substantial amounts (Timothy Archer $26.76M, Vahid Vahedi $7.25M, Doug Bettinger $6.04M) with ZERO purchases. While programmatic selling is normal, the magnitude and lack of ANY buying raises questions about management's confidence at current valuation.
-
📉 Sector Rotation Risk: If market rotates out of semiconductors into other sectors (financials, energy, etc), LRCX could underperform even with good fundamentals. YTD outperformance means profit-taking could be severe. Technical damage if breaks below $170 support.
🎯 The Bottom Line
Real talk: Someone just closed $4.9M of downside protection on LRCX with the stock sitting near all-time highs after an incredible 115% YTD rally. This isn't a bearish signal - it's actually BULLISH. When sophisticated institutions close protective puts with 87 days still remaining until expiration, they're telling you: "We no longer see the downside scenario we were hedging against as realistic."
What this trade tells us:
- 🎯 Smart money comfortable with current levels - they believe $170-172.50 support will hold
- 💰 They'd rather pocket the remaining $9.80/contract time value than watch it decay to zero
- ⚖️ Risk/reward has shifted - the insurance policy that made sense at $165-170 is no longer necessary at $175
- 📊 They're confident enough in upcoming catalysts (Jan 28 earnings, WFE forecasts, HBM ramp) to stay unhedged
- ⏰ Timing signal: removing protection BEFORE January earnings suggests expectations are positive
This is a "stay long, remove hedges" signal - not a "sell everything" signal.
If you own LRCX:
- ✅ Consider removing protective puts if you're holding them - follow institutional lead
- 💰 Pocket the remaining time value before it decays completely
- 📊 Set mental stop at $170 (below $172.50 Put Wall) for discipline
- 🎯 Let position run toward $180-185 resistance through Q1 2026
- 🛡️ If you MUST hedge, consider rolling puts down to $165 or $160 (way cheaper, protects against true disaster)
- ⏰ Re-evaluate after January 28 earnings - strong report could open path to $190-200
If you're watching from sidelines:
- 🎯 Entry opportunity: Any pullback to $172-173 (Put Wall support) would be excellent buy point
- 📈 Looking for confirmation: January 28 earnings beat with $5.3B+ revenue, 50%+ gross margins, HBM tracking to $3B
- 🚀 Longer-term (6-12 months): WFE market growing to $145B in 2026 and $156B in 2027 with LRCX gaining share (etch-dep intensity expanding) creates multi-year growth runway
- ⚠️ Current valuation requires flawless execution - wait for minor dip rather than chasing at $175+
If you're bearish:
- 🎯 Hard to make bearish case when institutions closing puts, fundamentals strong, WFE growing
- 📊 If you insist: wait for break below $172.50 Put Wall to confirm weakness
- ⚠️ Better risk/reward to wait for earnings - don't fight 115% momentum into all-time highs
- 📉 China exposure (35% revenue) remains legitimate risk if export restrictions expand
Mark your calendar - Key dates:
- 📅 January 28, 2026 (Wednesday) after market close - Q2 FY2026 earnings report (35 DAYS!)
- 📅 January 29 (Thursday) - Post-earnings price action and analyst reactions
- 📅 February 11-13, 2026 - SEMICON Korea conference
- 📅 March 20, 2026 - Quarterly expiration (this put's expiration date)
- 📅 Mid-2025 - Akara conductor etch system production ramp accelerates
- 📅 H2 2026 - 2nm/GAA technology transitions at TSMC drive etch/deposition intensity higher
Final verdict: LRCX's semiconductor equipment story remains INCREDIBLY compelling - record WFE spending of $145B in 2026 growing to $156B in 2027, HBM advanced packaging tripling to $3B, Akara technology wins, and etch-dep intensity expanding all create multi-year tailwinds. The $4.9M institutional put close is a CLEAR signal: smart money is comfortable staying long unhedged at current levels.
The message: Trust the fundamentals. Follow smart money. Remove unnecessary hedges. Let this position ride toward $180-190. 💪
This is a marathon, not a sprint. The AI/HBM infrastructure buildout will take years, and LRCX is positioned at the center of it.
Disclaimer: Options trading involves substantial risk of loss and is not suitable for all investors. This analysis is for educational purposes only and not financial advice. Past performance doesn't guarantee future results. The Z-score of 1.57 reflects this trade's size relative to recent LRCX history - it does not imply you should follow it. Always do your own research and consider consulting a licensed financial advisor before trading. Earnings create binary event risk with potential for 5-10% gaps either direction. The put closer may have complex portfolio hedging needs not applicable to retail traders.
About Lam Research Corporation: Lam Research ranks among the world's largest semiconductor equipment manufacturers, focusing on "deposition and etch" technologies that build and selectively remove layers during chip fabrication. The company maintains the leading market position in etch equipment and the second-largest share in deposition systems, with a market cap of $220.1 billion serving major chipmakers including TSMC, Samsung, Intel, and Micron.