🎯 $13M LRCX Put Close Signals Bullish Conviction: Whale Exits Downside Protection at All-Time Highs
🎯 Quick Take
A sophisticated institutional trader just paid $13 million to close 6,500 LRCX March $170 puts with the stock trading at $177.17—just 1.5% below all-time highs. This isn't your typical options flow. This is a buy-to-close (BTC) transaction on previously sold puts, meaning someone who was collecting premium while betting LRCX would stay above $170 is now paying to exit that position 81 days before expiration. With Q2 earnings dropping January 28 (MarketBeat earnings calendar) and LRCX up 138% year-to-date on AI-driven semiconductor equipment demand, this trade signals bullish conviction—but with a healthy respect for near-term volatility. Let's decode what this $13M position close tells us about the next 12 weeks.
📊 Option Flow Breakdown
The Trade:
The Tape (December 29, 2025):
| Time | Symbol | Side | Buy/Sell | Type | Expiration | Premium | Strike | Volume | OI | Size | Spot | Option Price |
|---|---|---|---|---|---|---|---|---|---|---|---|---|
| 10:39:03 | LRCX | ASK | BUY | PUT $170 | 2026-03-20 | $13M | $170 | 10,000 | 25,000 | 10,000 | $177.17 | $12.60 |
Trade Details:
| Field | Value |
|---|---|
| Date/Time | December 29, 2025 at 10:54:55 AM ET |
| Trade | 6,500 contracts BUY TO CLOSE |
| Strike | $170 puts (4.0% out-of-the-money) |
| Expiration | March 20, 2026 (81 days out / quarterly triple witch) |
| Premium | $13,000,000 ($201.30 per contract) |
| Current Spot | $177.17 |
| Open Interest | 25,000 contracts (pre-trade) |
| Strategy | Close Short Put (bullish de-risking) |
What This Means: This is a buy-to-close transaction, not a new bearish bet. The trader originally SOLD these 6,500 puts weeks or months ago, collecting premium and betting LRCX would stay above $170. Now they're paying $13M ($201.30 per contract) to exit the position early, 81 days before March expiration. This structure is fundamentally bullish—it removes downside protection, suggesting confidence in LRCX's support levels.
Why This Structure?
- Profit-Taking at ATH: With LRCX trading just 1.5% below its all-time high of $179.80 (set December 26), the trader is locking in gains from the original put sale
- Earnings Catalyst Ahead: Q2 FY2026 earnings on January 28 creates binary volatility risk the trader wants to avoid
- Margin Capital Release: Freeing up ~$34-40M in margin requirements (assuming 20-25% margin on $170M notional) for redeployment
- Risk Management: Eliminating tail risk from China export license decisions (temporary licenses expire end of 2025) and memory cycle uncertainty
Estimated Original Transaction: If the trader sold these puts at $15.00 (when LRCX was lower or volatility higher), they collected $9.75M initially and are now buying back at $13M—a $3.25M loss. However, if sold at $18-20, this close represents profit-taking of $5-6M while avoiding earnings volatility.
Most Likely Scenario: Given LRCX's 138% YTD surge, this appears to be profit-taking where the trader sold puts at higher premiums when LRCX was $160-165, and is now closing at $201.30 to bank gains before January 28 earnings introduces new risk.
📈 Technical Setup
Key Technical Levels:
- All-Time High: $179.80 (December 26, 2025 intraday) (Yahoo Finance stock history)
- All-Time Closing High: $178.07 (December 26, 2025)
- Current Price: $177.17
- Distance from ATH: -1.46%
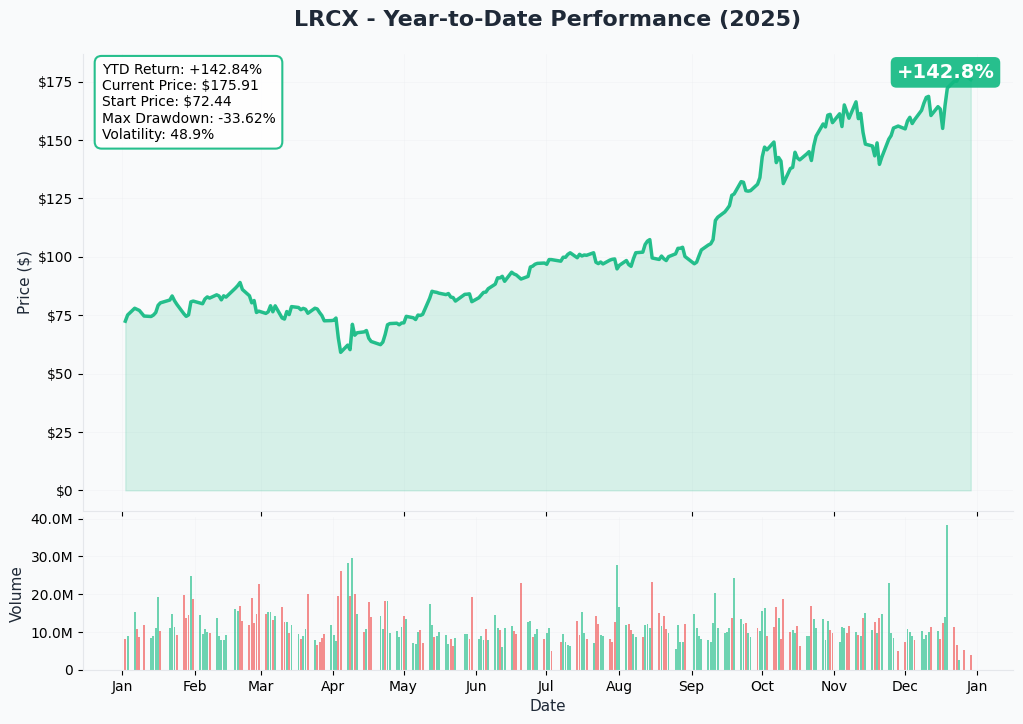
- 52-Week Low: $56.32 (+214% from lows)
- YTD Performance: +138.5% (Yahoo Finance/Zacks)
Recent Price Action: LRCX has been on a relentless uptrend throughout 2025, significantly outperforming semiconductor equipment peers: KLA Corporation +97.7%, Applied Materials +57.6%, and ASML Holding +52.3%. The stock peaked at $179.80 on December 26, then consolidated in the $175-178 range as traders digest the recent analyst target increases (TipRanks forecasts) and await Q2 earnings catalysts.
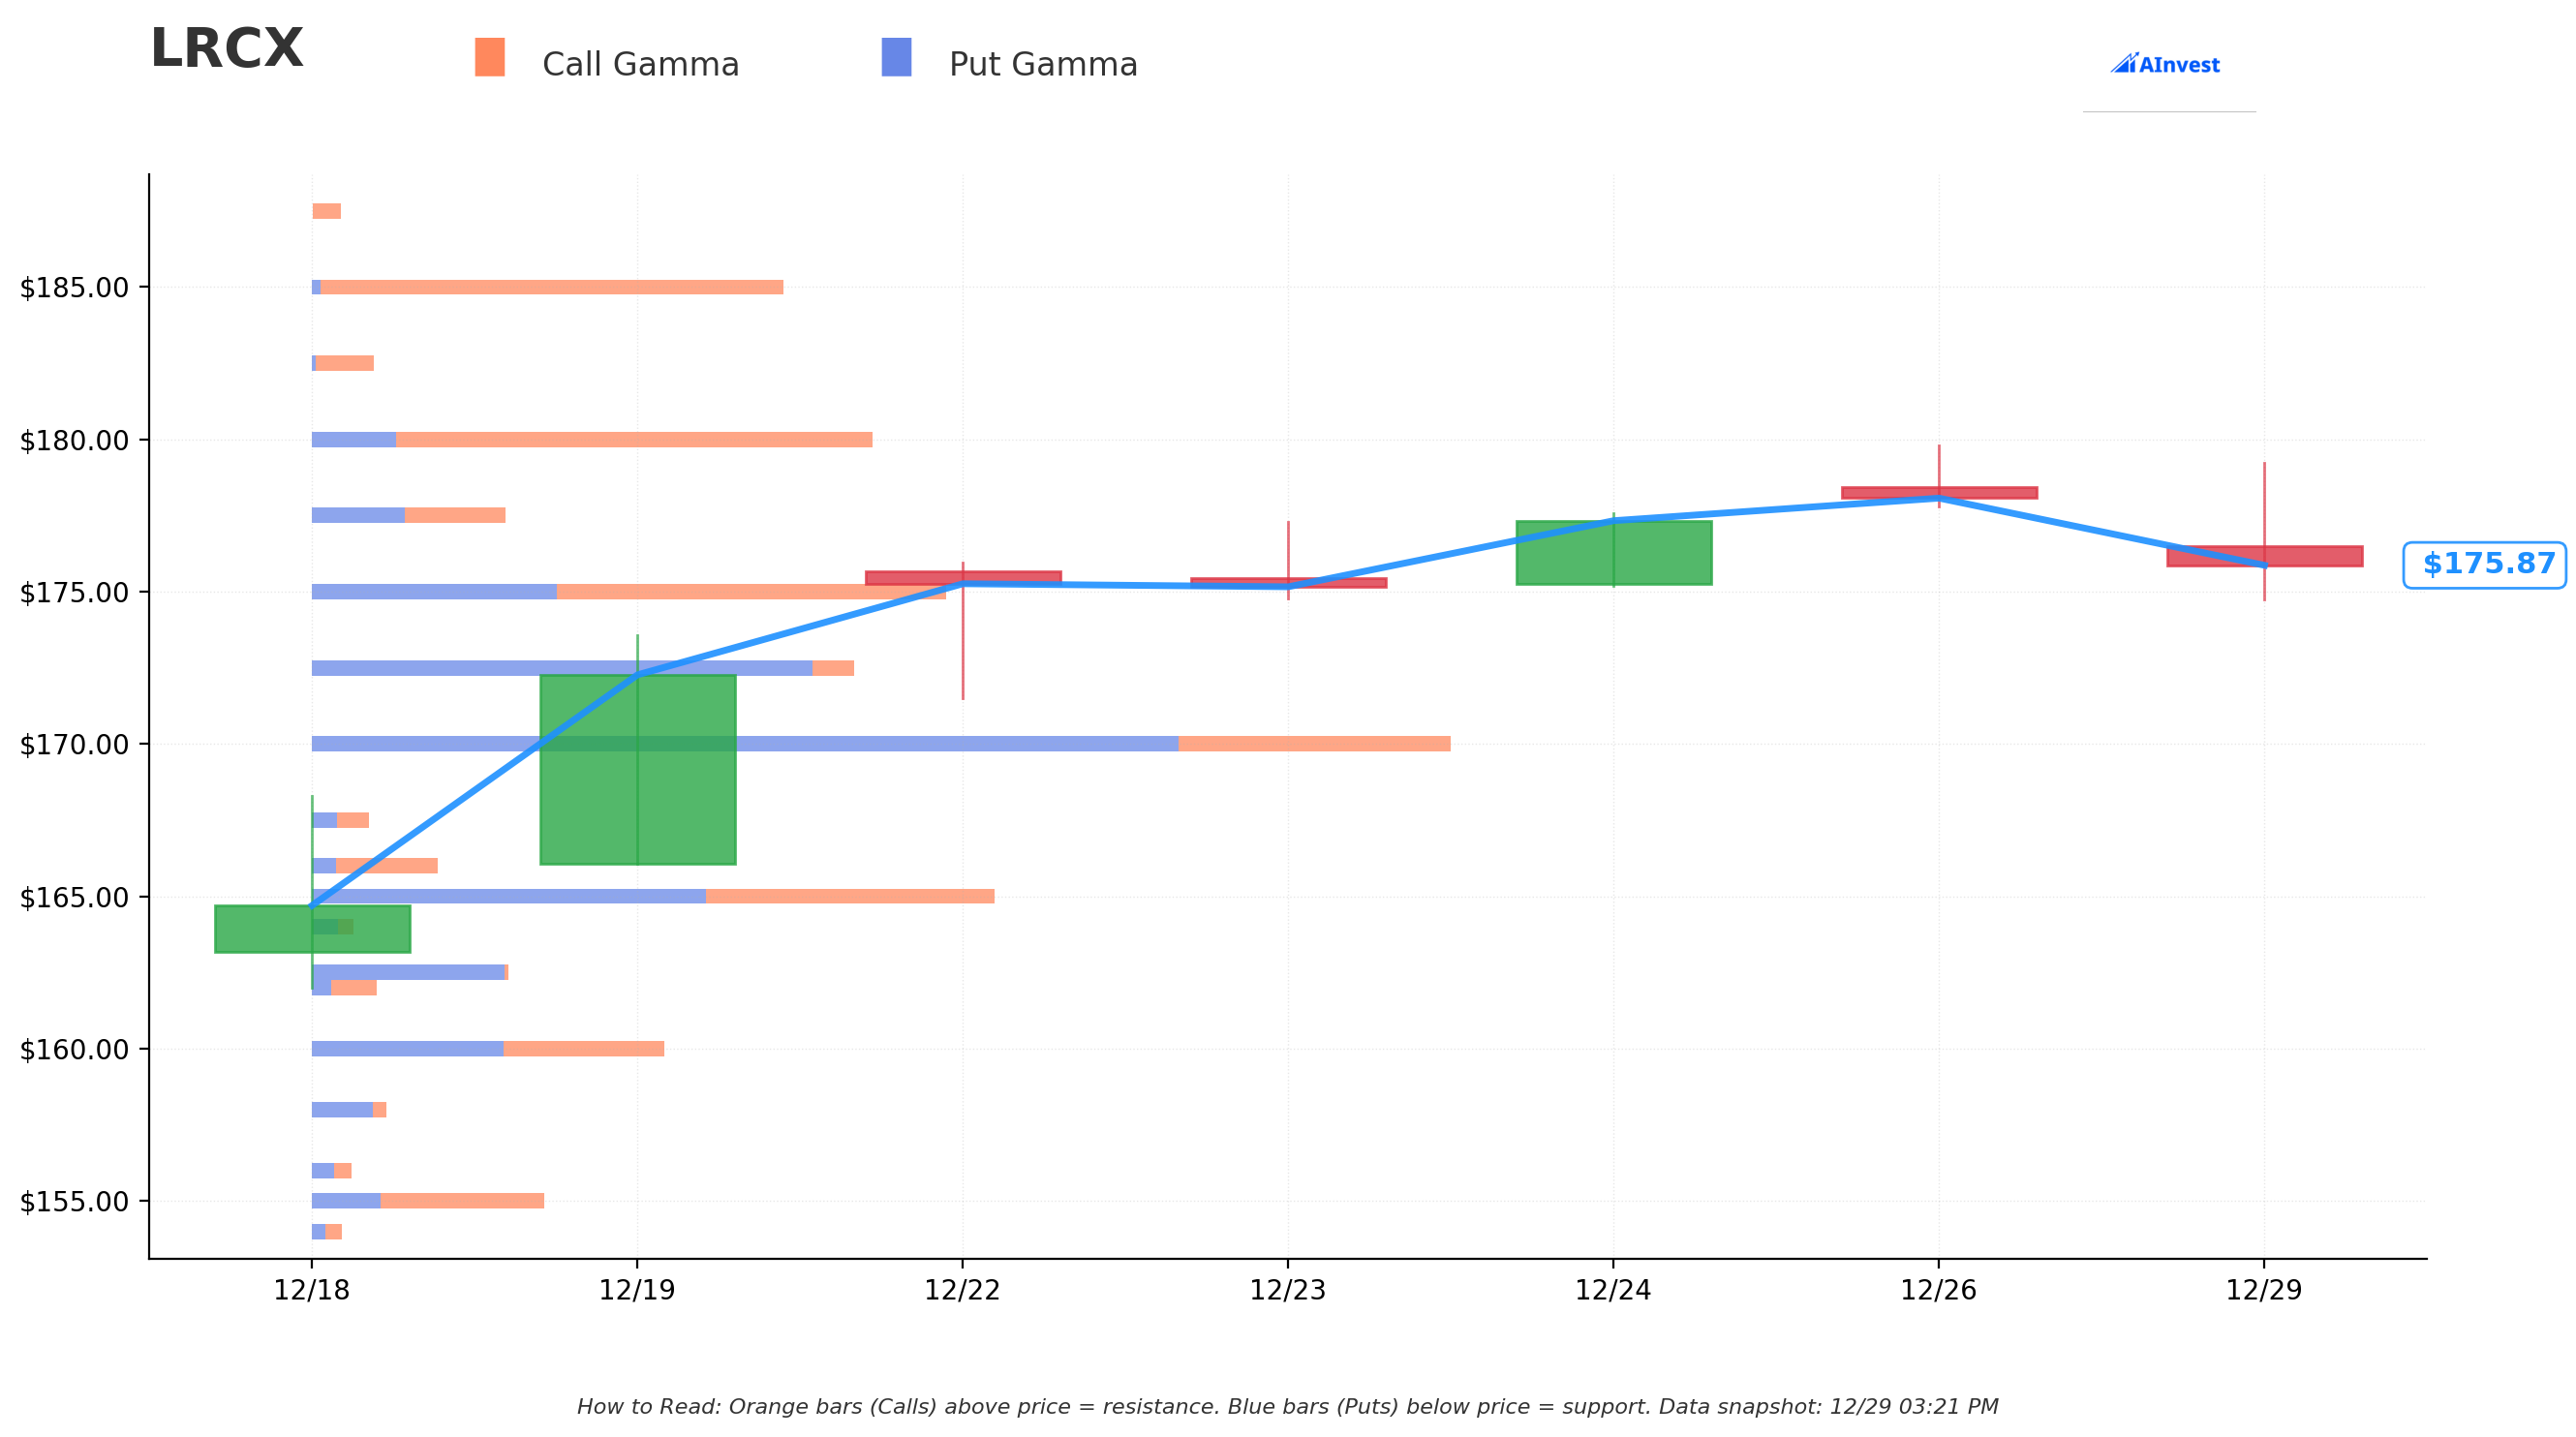
Gamma Exposure Levels (from live GEX data):
The gamma exposure data for LRCX shows a notably flat profile with empty support and resistance levels. This is significant:
| Observation | Interpretation |
|---|---|
| No Gamma Walls | Dealers hold minimal gamma positioning—no mechanical hedging creating support/resistance |
| Higher Volatility Potential | Without gamma-based support, LRCX is more susceptible to directional moves from fundamental news |
| Post-Rally Reset | After 138% YTD surge, many options positions closed/rolled/expired, leaving a cleaner slate |
| Dispersed Liquidity | Options liquidity spread across strikes rather than concentrated |
What This Means for the Trade: The $170 strike is not anchored by dealer gamma positioning. This put close removes a source of downside hedging pressure, but without gamma support underneath, LRCX will rely on fundamental bid from equity investors and technical chart levels ($170-172 psychological support, $165 prior resistance turned support, $160 50-day MA) to maintain stability.
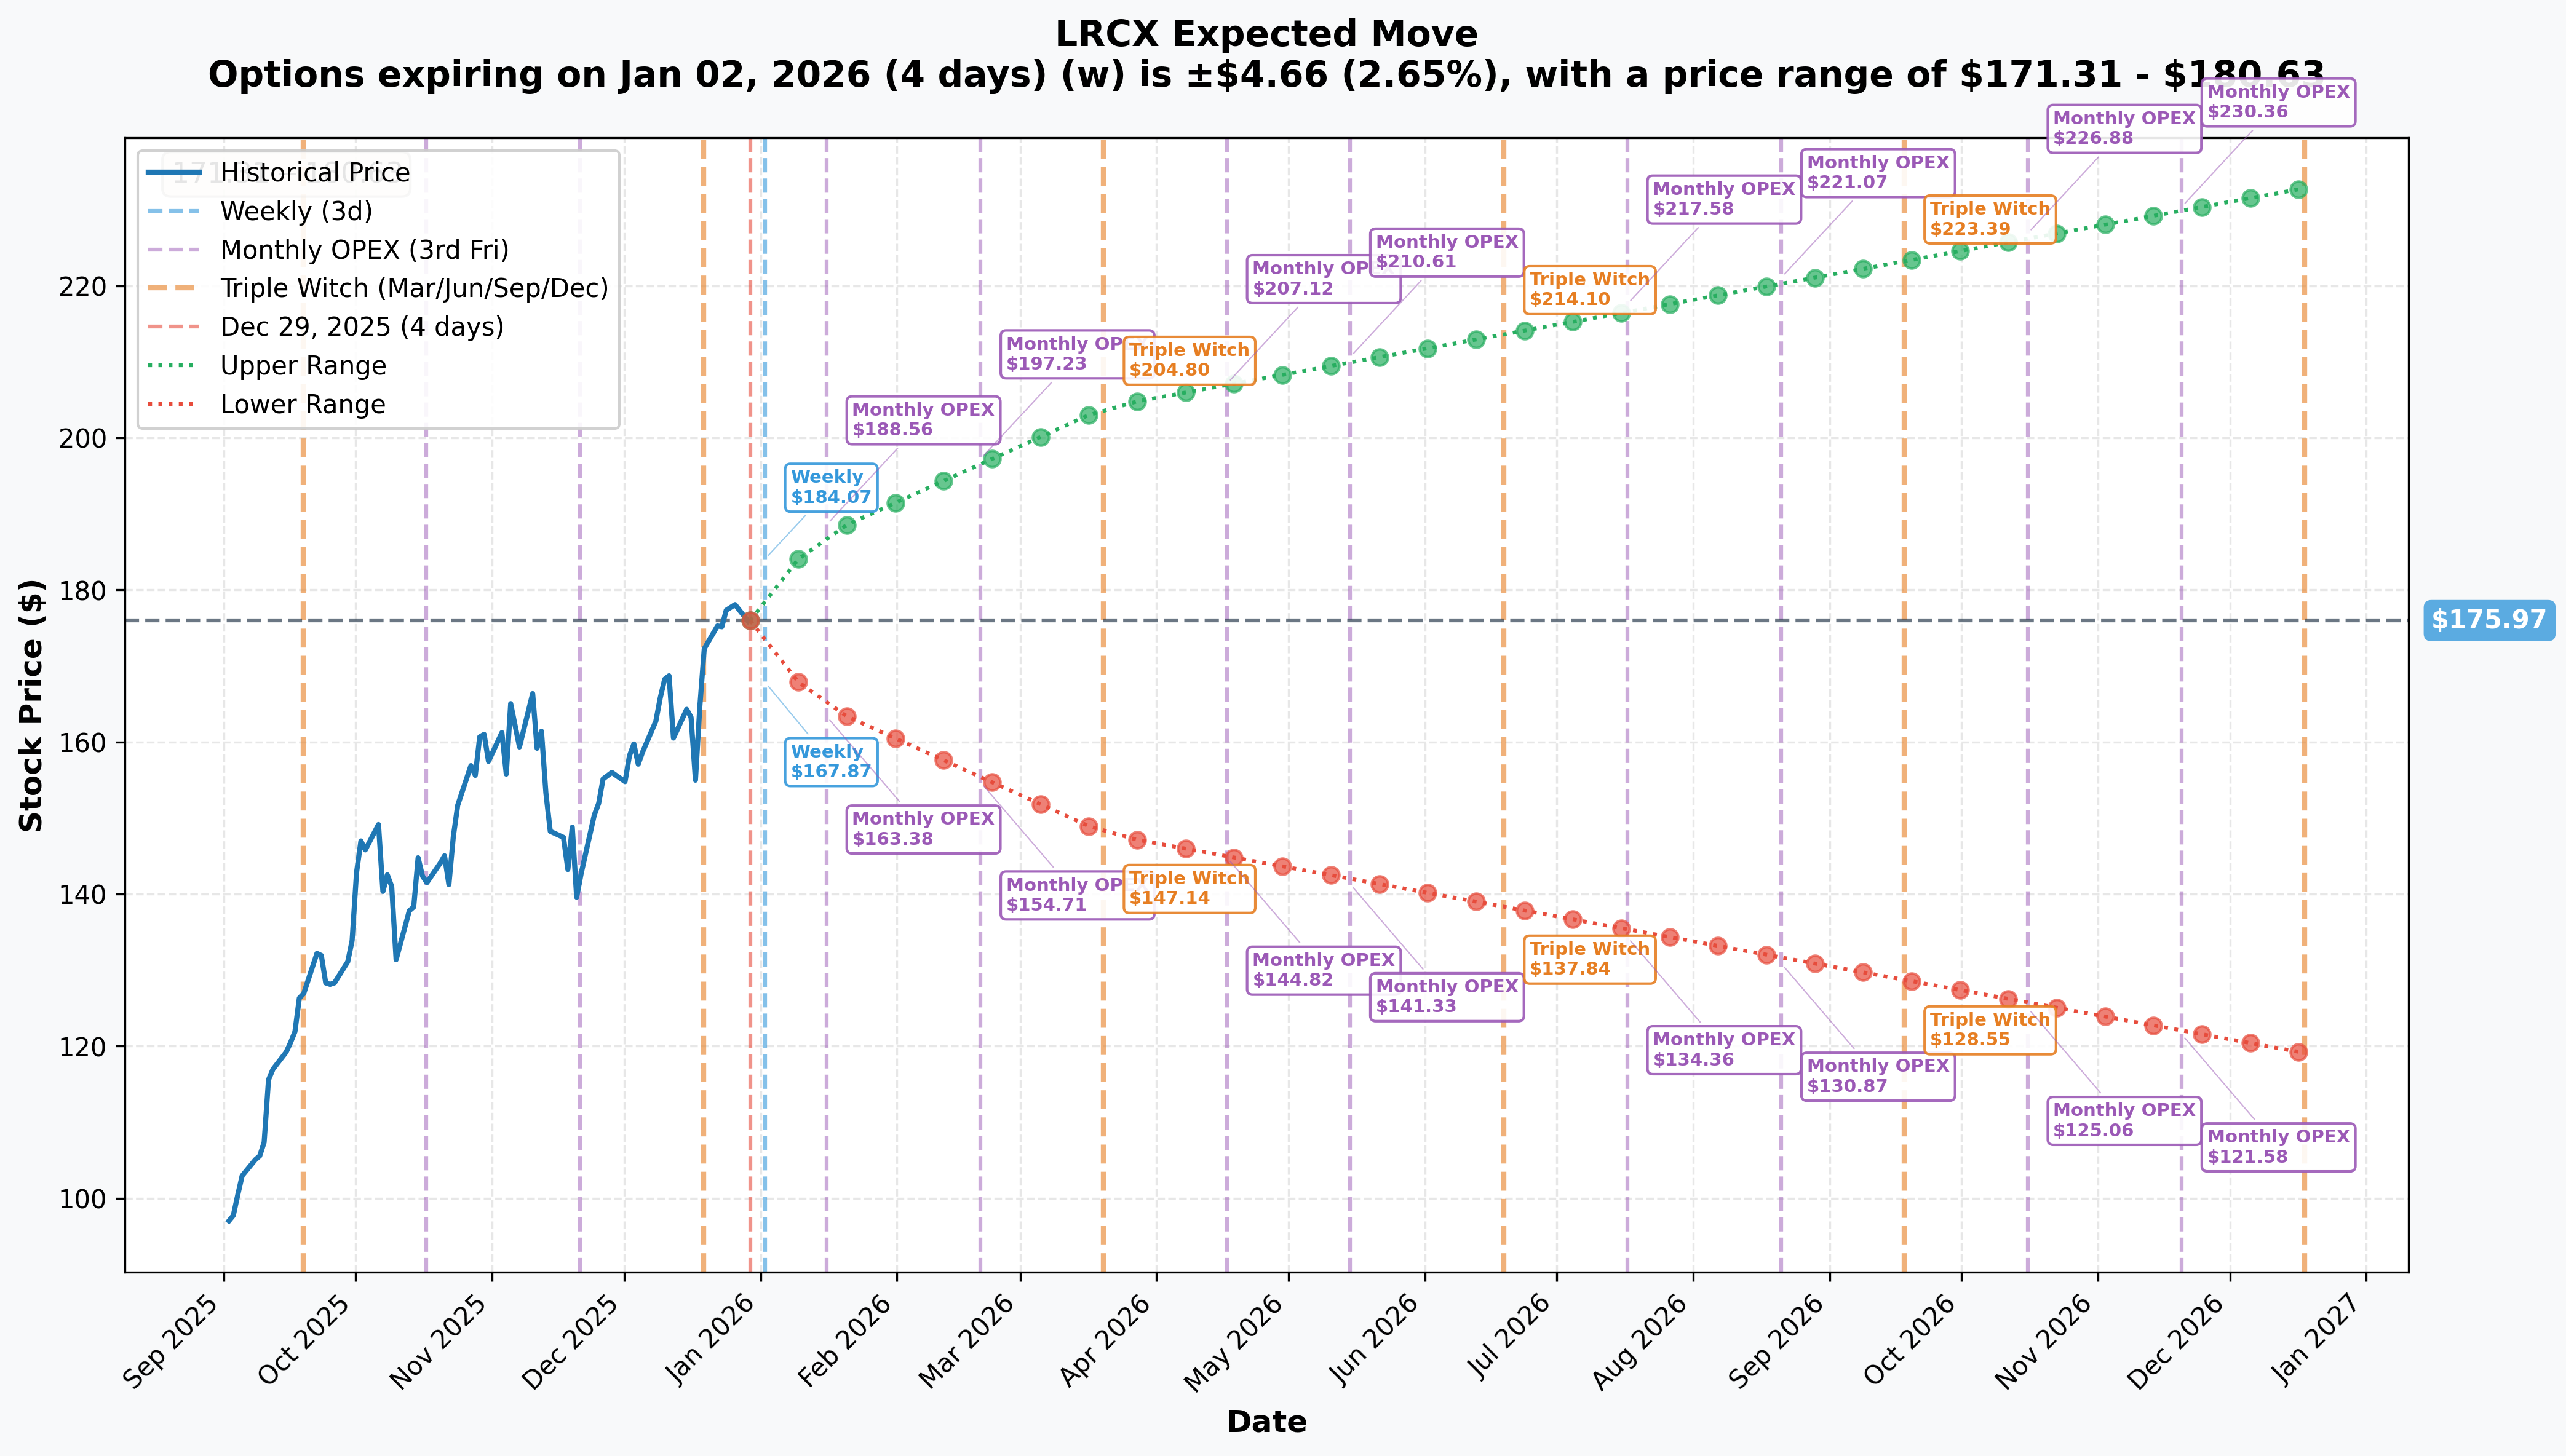
Implied Volatility & Expected Moves:
| Timeframe | Expiration | Implied Move | Price Range | Events |
|---|---|---|---|---|
| Weekly | Jan 2, 2026 | ±2.65% | $171.31 - $180.63 | New Year consolidation |
| Monthly | Jan 16, 2026 | ±6.56% | $164.43 - $187.51 | Pre-earnings positioning |
| Quarterly | Mar 20, 2026 | ±15.96% | $147.88 - $204.06 | Post-Q2 earnings, Triple Witch |
| Yearly | Dec 2026 | ±32.35% | $119.04 - $232.90 | Full cycle outlook |
March Expiration Math: The quarterly implied move of ±15.96% puts the expected range at $147.88 (downside) to $204.06 (upside) by March 20th. The $170 strike sits 4.0% below current price and would be within the lower portion of this range. Critically, this expiration is 51 days AFTER the January 28 Q2 earnings release—the trader closing this position is avoiding the binary earnings catalyst that drives approximately 9-10% of the total implied volatility.
🔥 Catalysts: What's Driving This Trade
🗓️ IMMEDIATE: Q2 FY2026 Earnings (January 28, 2026)
Confirmed Date: Tuesday, January 28, 2026 after market close (MarketBeat earnings calendar)
Consensus Expectations:
- Revenue: $5.21 billion (±$300M guidance range) (Investing.com earnings transcript)
- EPS: $1.16 non-GAAP
- Gross Margin: 48.5% (±1%)—down from Q1's record 50.6%
Key Metrics to Watch:
- China Revenue Trajectory: Expected below 30% of total (down from 31% in Q1) as export controls continue to bite (StockStory Q3 analysis)
- HBM and Advanced Packaging Shipments: HBM manufacturing requires 2-3x more process steps than conventional memory, playing directly to Lam's etch/deposition strengths (Seeking Alpha HBM analysis)
- Memory vs. Logic/Foundry Mix: DRAM equipment +15.1% and NAND equipment +12.7% forecasted for 2026 (SEMI forecast December 2024)
- Updated WFE Spending Outlook: Management raised 2025 outlook to ~$105B; 2026 guidance critical
- Tariff Impact on Margins: Q2 gross margin guidance of 48.5% (vs. 50.6% in Q1) explicitly cites tariff pressures
Historical Earnings Moves:
- Q1 FY2026 (October 2025): +2.1%
- Q4 FY2025 (July 2025): +5.3%
- Q3 FY2025 (April 2025): -3.2%
Recent earnings reactions have been muted, suggesting the market has priced in positive results. However, a surprise miss on revenue, margins, or China commentary could trigger a 10-15% correction that would send the $170 puts deeply in-the-money.
📈 MAJOR: WFE Market Expansion Through 2027
Industry Outlook: SEMI projects global semiconductor equipment sales reaching $156 billion in 2027 (surpassing $150B for the first time), with wafer fab equipment specifically at $135.2 billion in 2027 (+7.3% YoY) following $126.2 billion in 2026 (+9% YoY) (SEMI December 2025 forecast).
Memory Equipment Surge:
- DRAM Equipment: +15.1% in 2026 to $25.9 billion (SEMI forecast)
- NAND Equipment: +12.7% in 2026 to $15.7 billion
LRCX Positioning: Lam holds ~15% of the global WFE market and 30%+ market share in specialized etch applications (TS2 Tech WFE outlook). The company is particularly strong in memory chip production (DRAM and NAND), making it a direct beneficiary of the memory equipment spending acceleration.
Americas Spending Surge: U.S. semiconductor equipment spending forecast to jump +56.4% in 2026, driven by CHIPS Act investments (SEMI forecast).
💰 STRATEGIC: HBM Capacity Expansion
Catalyst: Bank of America highlights Micron's HBM roadmap as a major catalyst for equipment names including LRCX (TheStreet Micron impact).
Why This Matters: HBM (High-Bandwidth Memory) manufacturing requires 2-3x more process steps than conventional memory—directly benefiting Lam's core etch and deposition technologies (Seeking Alpha HBM analysis). This isn't just incremental growth—it's a structural increase in Lam's serviceable addressable market (SAM) and wallet share per wafer.
Advanced Packaging Tailwind: TSMC's CoWoS capacity expansion and broader advanced packaging adoption at leading-edge foundries create incremental demand for Lam's specialized deposition and etch tools (Investing.com SWOT analysis).
GAA Transistor Adoption: Lam's February 2025 launch of Akara conductor etch technology positions the company to capture outsized share of gate-all-around (GAA) transistor scaling at 2nm-class and beyond nodes (Lam Research newsroom). Management expects GAA and advanced packaging shipments to triple from $1B+ in 2024 to over $3B in 2025 (AInvest Q4 analysis).
🌏 RISK CATALYST: China Export Controls
Current Status (End of 2025):
- China revenue dropped from 40%+ to ~31% of total revenue due to tightening export restrictions (StockStory analysis)
- Commerce Department temporary license for Chinese suppliers expires end of 2025—just days away (PR Newswire Lam statement)
- Congressional scrutiny ongoing regarding China sales compliance (TrendForce lawmakers probe)
- $700 million revenue headwind expected in H2 2025 from China restrictions (Captide Q4 analysis)
Downside Scenario: Any non-renewal or stricter enforcement of export licenses could immediately pressure LRCX shares, potentially triggering a 10-15% correction that would make the $170 put strike very relevant.
Upside Scenario: If license renewals proceed smoothly or restrictions ease, it removes a major overhang and could add $2-4B quarterly revenue upside.
Why the Trader is Exiting: This China policy uncertainty creates significant tail risk in the next 81 days. The trader closing this position is essentially saying: "I don't want to remain short volatility through this binary catalyst, even though LRCX has been trending higher."
🏗️ Recent Performance: Record Q1 FY2026 Results
October 22, 2025 Earnings Beat:
- Revenue: $5.32 billion (+28% YoY, +2% beat vs. $5.22B consensus) (Nasdaq earnings report)
- EPS: $1.26 non-GAAP (beat consensus of $1.22 by 4.1%) (ChartMill earnings analysis)
- Gross Margin: Record 50.6% non-GAAP
- Operating Margin: Record 35%
Segment Performance:
- Systems Revenue: $3.55 billion (+48% YoY)
- Customer Support: $1.77 billion
CEO Commentary: Tim Archer stated: "The technology requirements of AI play extremely well to Lam's product strengths" (Fintool Q1 summary). Management expects fiscal 2026 to be second-half weighted as AI infrastructure investments accelerate.
Memory Strength:
- DRAM Revenue: +26.7% YoY, driven by HBM and DDR5 demand (Nasdaq DRAM analysis)
- NAND Revenue: +21% YoY, driven by 256-layer class conversions
🎯 Price Targets & Probabilities
Analyst Consensus
Street Targets:
- Average Price Target: $173.27 (TipRanks forecast, MarketBeat forecast)
- Implied Upside: -2.2% from current $177.17 (suggests valuation catching up to fundamentals)
- Range: $117.48 (bear case) to $220.50 (Cantor Fitzgerald bull case)
- Rating: Strong Buy (17 Buy, 5 Hold, 0 Sell)
Recent December 2025 Target Increases:
- Cantor Fitzgerald: Raised to $210 (from $170)
- UBS: Raised to $200 (from $175)
- Mizuho: Raised to $200 (from $170)
- Bank of America: Raised to $195 (from $165)
- Citi: Raised to $190 (from $175)
Technical Price Targets (Based on Gamma + Implied Move)
Bullish Scenario (40% probability):
- Near-Term Target: $185-190 (breakout above ATH + psychological resistance)
- Post-Earnings Target: $195-200 (if Q2 beats and guidance raises)
- March OPEX Target: $204-210 (upper end of quarterly implied move)
- Catalyst Path: Strong Q2 earnings → China license renewals → WFE outlook raised to $115-125B for 2026
Base Scenario (45% probability):
- Range: $170-180 (current consolidation zone around ATH)
- March OPEX: $175-185 (modest post-earnings drift higher)
- Catalyst Path: In-line Q2 earnings, China status quo, WFE outlook confirmed
Bearish Scenario (15% probability):
- Downside Target: $150-165 (quarterly implied move lower bound)
- Support Levels: $170 (put strike), $165 (prior resistance), $160 (50-day MA), $150 (200-day MA)
- Catalyst Path: Earnings miss on margins/China, export licenses not renewed, memory cycle weakness signals
March 20, 2026 Probabilities (Options-Implied)
Using the implied volatility surface and delta approximations:
| Price Level | Probability | Strike Relevance |
|---|---|---|
| Above $195 | ~20% | Analyst target zone |
| $185-$195 | ~25% | Breakout scenario |
| $175-$185 | ~30% | Consolidation (base case) |
| $165-$175 | ~15% | Modest pullback |
| Below $165 | ~10% | Downside surprise / correction |
Put Close Breakeven: The trader closing at $201.30 per contract needs LRCX to stay above ~$170 to avoid the puts going in-the-money. With a 35-40% implied probability of LRCX below $170 by March 20, the trader is accepting that risk in exchange for eliminating earnings volatility and freeing capital.
💡 Trading Ideas
🛡️ CONSERVATIVE: Cash-Secured Put Sale (Income Strategy)
Sell $165 Put (March 20, 2026 expiration)
- Sell: 1x $165 put @ ~$9-10
- Net Credit: $900-1,000 per contract
- Cash Required: $16,500 (to secure put obligation)
- Yield: 5.5-6.1% in 81 days (25-27% annualized)
- Breakeven: $165 - $9.50 = $155.50
- Buffer: 6.9% downside cushion from current $177.17
Why This Works:
- Greater Safety Margin: $165 strike is 6.9% below current price vs. $170 (4.0% below)
- Technical Support: $165 represents prior resistance turned support from November 2025
- Reduced Earnings Risk: Lower strike provides more cushion if Q2 disappoints
- Income Generation: 25%+ annualized return if LRCX stays above $165
Ideal For: Conservative income investors who want exposure to LRCX at lower entry points while generating substantial premium income.
⚖️ BALANCED: Bull Call Spread (Defined-Risk Bullish)
Bull Call Spread (March 20, 2026 expiration)
- Buy: 1x $175 call @ ~$16.50
- Sell: 1x $190 call @ ~$9.20
- Net Debit: $7.30 ($730 per spread)
- Max Profit: $7.70 ($770 per spread) if LRCX ≥ $190 at expiration
- Max Loss: $730 (debit paid)
- Breakeven: $182.30
- Return on Risk: 105% if max profit achieved
Why This Works:
- Limited Downside: Risk capped at $730 per spread vs. buying stock
- Earnings Upside Capture: Profits from move to analyst price target zone ($185-195)
- Time Decay Friendly: Short $190 call offsets time decay on long $175 call
- Near-ATM Entry: Long $175 call is just 1.1% below current price with high delta
Scenario Analysis:
- LRCX at $195 by March 20: Max profit of $770 (+105% return)
- LRCX at $182.30: Breakeven (3% upside from current)
- LRCX at $170: Loss of $730 (but defines max risk)
Ideal For: Traders who want bullish exposure with defined risk and believe LRCX can break out to $185-195 post-earnings.
🔥 AGGRESSIVE: Long Call Butterfly (Lottery Ticket)
Call Butterfly (March 20, 2026 expiration)
- Buy: 1x $180 call @ ~$13.50
- Sell: 2x $190 call @ ~$9.20 each
- Buy: 1x $200 call @ ~$6.00
- Net Debit: $1.10 ($110 per butterfly)
- Max Profit: $8.90 ($890 per butterfly) if LRCX = $190 at expiration
- Max Loss: $110 (debit paid)
- Profit Range: $181.10 - $198.90
- Return on Risk: 809% at max profit
Why This Works:
- Asymmetric Payoff: Massive upside for minimal capital outlay
- Analyst Target Alignment: Max profit at $190 aligns with recent analyst target increases
- Defined Risk: Can only lose $110 per butterfly vs. buying stock or naked calls
- Range-Bound Edge: Profits if LRCX consolidates in the $185-195 analyst target zone
Scenario Analysis:
- LRCX at $190 by March 20: Max profit of $890 (+809% return)
- LRCX at $185: Profit of ~$400 (+364% return)
- LRCX at $180 or $200: Breakeven
- LRCX outside $175-205: Max loss of $110
Ideal For: High-conviction traders who believe LRCX will break out to the $185-195 zone post-earnings and want lottery-ticket upside with limited capital at risk.
🐋 WHALE REPLICATION: Sell Cash-Secured Put (For Income)
Replicate the Original Position (before the close)
- Sell: 10x $170 puts @ $20.13 (current market)
- Total Premium Collected: $20,130 per 10-lot
- Cash/Margin Required: ~$170,000 (cash-secured) or ~$34-40K (margin)
- Yield: 11.8% in 81 days (53% annualized) if LRCX stays above $170
- Breakeven at Expiry: $170 - $20.13 = $149.87
- Max Loss: $149,870 if LRCX goes to zero (theoretical)
Why This Structure:
- High Income Generation: 53% annualized return if LRCX stays above $170
- Bullish Conviction: Express view that LRCX will maintain support above $170
- Obligation to Buy: If assigned, acquire LRCX at effective price of $149.87 (15.4% below current)
Exit Strategy:
- Target 1: Buy to close if premium decays to $10-12 (50-60% profit capture)
- Target 2: Hold through expiration if LRCX stays above $170 for full premium
- Stop Loss: Buy to close if LRCX breaks below $165 to limit further losses
Ideal For: Accounts $50K+ comfortable with the obligation to buy LRCX at $170 if assigned, seeking high income generation with bullish market view.
IMPORTANT NOTE: This is the OPPOSITE of what the whale did (they closed/bought back their short puts). Selling puts now means taking on the risk the whale just paid $13M to eliminate.
⚠️ Risk Factors
🌍 Geopolitical & Regulatory Risks
China Export Controls:
- China revenue dropped from 40%+ to 31% of total (StockStory analysis)
- Commerce Department temporary license expires end of 2025—immediate binary catalyst (PR Newswire statement)
- Congressional scrutiny for noncompliance (TrendForce probe)
- $700M revenue headwind from restrictions (Captide analysis)
Impact on This Trade: Any negative China policy development before March expiration could trigger a 10-15% correction, sending the $170 strike in-the-money. The trader closing this position is explicitly avoiding this tail risk.
📊 Valuation & Margin Compression
Stretched Metrics:
- Forward P/E: 33.84x vs. 18.6x 10-year historical average (MacroTrends P/E data)
- Current P/E: Approximately double the historical norm—limited room for multiple expansion
- PEG Ratio: 1.77 (reasonable but assumes continued earnings growth)
Margin Trajectory:
- Q1 Gross Margin: Record 50.6%
- Q2 Gross Margin Guidance: 48.5% (±1%)—210 basis point decline
- Margin Pressure: Explicitly cited tariff impacts (Investing.com earnings transcript)
Why Margins Matter: LRCX's $228B market cap implies continued 48%+ gross margins. If Q2 guidance shows margins below 47% or full-year trajectory concerns emerge, the multiple could contract even with revenue beats.
Impact on This Trade: Earnings margin disappointment could trigger -8% to -12% gap down, testing the $160-165 support zone. The $170 strike provides only 4% downside buffer from current levels.
🥊 Competitive Landscape Risks
Peer Competition:
- ASML: EUV lithography monopoly and High-NA EUV introduction (PatentPC market data)
- Applied Materials: Broader product portfolio with 13.55% market share vs. LRCX's 7.52%
- Chinese Domestic Equipment Makers: Emerging players reducing addressable market in China
LRCX's Moat:
- Etch Leadership: 30%+ market share with specialized conductor etch for GAA (Nasdaq AMAT vs LRCX)
- HBM Process Intensity: 2-3x more process steps creates structural wallet share gains
- "4 Horsemen" Innovation: GAA, Backside Power, Advanced Packaging, Dry Resist differentiation
Impact on This Trade: Competition risk is longer-term structural, but any major customer win by AMAT or ASML could pressure sentiment. March expiration is too short for major competitive shifts.
📉 Cyclical Memory Risk
Historical Cyclicality:
- Memory equipment spending has historically been cyclical with sharp downturns (Insider Monkey memory recovery analysis)
- Any sign of oversupply in DRAM/NAND could trigger equipment order cuts
- NAND pricing recovery timing remains uncertain
Counterpoint - AI Structural Demand:
- Unlike prior cycles driven by smartphone/PC markets, current buildout is AI infrastructure-driven
- Multi-year durability vs. consumer electronics cyclicality
- HBM and DDR5 have different demand drivers than legacy memory
Impact on This Trade: Memory cycle turning negative is a 6-12 month risk, likely beyond March expiration. However, early warning signs in Q2 earnings commentary could pressure the stock.
📆 Earnings Volatility & Time Decay
Binary Earnings Risk (January 28, 2026):
- Historical LRCX earnings moves: +2.1% (Q1), +5.3% (Q4), -3.2% (Q3)
- Options pricing ~8-10% potential move for Q2 earnings
- Surprise miss could trigger -10% to -15% gap down
Time Decay Profile:
- Current Theta: ~-$0.08 to -$0.12 per contract per day
- Total Theta Loss: Approximately $6.50-$10 per contract over 81 days if LRCX stays flat
- Post-Earnings Volatility Crush: IV typically drops 30-40% the day after earnings
Why the Trader is Closing: By paying $201.30 to close now, the trader eliminates exposure to the January 28 earnings binary event and subsequent volatility crush. If LRCX stays flat post-earnings, the puts would decay significantly, making this close look expensive in hindsight. However, if LRCX gaps down 10%+ on an earnings miss, this close saves millions in losses.
🎯 Bottom Line
What This Trade Signals: This $13M LRCX put close isn't a bearish reversal—it's a sophisticated bullish de-risking move by an institutional trader locking in profits from a previously sold put position at the stock's all-time highs. The willingness to pay $13M ($201.30 per contract) to exit 81 days early signals:
- Bullish Confidence: Implicit belief that LRCX will maintain support above $170
- Earnings Risk Aversion: Eliminating binary exposure to January 28 Q2 results
- China Policy Uncertainty: Avoiding tail risk from export license decisions
- Profit-Taking Discipline: Banking gains after 138% YTD rally rather than risking reversal
The Bull Case: If LRCX continues its upward trajectory driven by AI-driven WFE spending reaching $135B by 2027 (SEMI forecast), HBM capacity expansion creating 2-3x process intensity, and strong Q2 earnings, this trade represents prudent risk management. The trader sacrifices $13M in remaining time value to eliminate catastrophic downside risk from unexpected negative catalysts.
The Bear Case: If LRCX consolidates or grinds higher through March, the puts would decay to near-zero, meaning the trader left $13M on the table by exiting early. The 35-40% implied probability of LRCX below $170 by March suggests this was a risk-averse decision—possibly overly cautious if fundamentals remain strong and China licenses renew smoothly.
Retail Takeaway: You don't need $13M to express similar views. The $165 cash-secured put offers 25%+ annualized income with greater safety margin. The $175/$190 bull call spread provides 105% upside with defined $730 risk for bullish traders. The $180/$190/$200 call butterfly offers 809% lottery-ticket returns for $110 risk if you believe the analyst target breakout thesis.
Final Verdict: LRCX's fundamental outlook is exceptionally strong—record margins, HBM tailwinds, $156B WFE market by 2027, and "4 Horsemen" innovation positioning. However, the stock's 138% YTD surge to ATH, elevated 34x P/E valuation (vs. 18.6x historical average), and near-term binary risks (Q2 earnings, China export licenses) warrant a measured approach. This $13M put close exemplifies that balance: bullish on the business, but respectful of near-term volatility and valuation risks. Investors should align position sizing and risk management strategies with their conviction levels and time horizons.
Risk Disclosure: Options trading involves substantial risk and is not suitable for all investors. The strategies outlined above can result in total loss of invested capital. This analysis is for informational purposes only and does not constitute investment advice. Past performance of similar trades is not indicative of future results. Always conduct your own due diligence and consult with a licensed financial advisor before trading options.
🔗 Additional Resources
Option Analysis: Chart Analysis - $170 Put, Mar 2026 Expiry
Full Stock Analysis: LRCX Deep Dive
Data Sources:
- Trade Data: Proprietary options flow scanner
- Gamma Exposure: Real-time GEX aggregation from OPRA feed
- Implied Volatility: Options chain data from exchange APIs
- Catalyst Research: Inline citations throughout with direct source links
- Technical Data: Yahoo Finance, Stock Analysis, MarketBeat
- Analyst Data: TipRanks, MarketBeat consensus
Analysis completed: December 29, 2025 | LRCX Spot: $177.17 | Market Cap: $228B