🔴 MCHP Massive $36M Short Call - Institutional Bear Bet on Chip Recovery! 🛡️
📅 December 12, 2025 | 🔥 Unusual Activity Detected
🎯 The Quick Take
Someone just sold $36 MILLION worth of MCHP calls this morning at 11:02 AM! This monster institutional play sold 28,000 contracts of March 2026 $57.50 strike calls - a sophisticated bearish bet or covered call strategy positioning for limited upside despite the recent semiconductor recovery narrative. With MCHP trading at $67.95 and the company just raising December quarter guidance on strong bookings, smart money is capping upside potential at $57.50 by March. Translation: Institutional investors are betting MCHP's rally runs out of steam or they're protecting massive long positions with covered calls!
📊 Company Overview
Microchip Technology (MCHP) is a global semiconductor leader in microcontrollers and embedded control solutions:
- Market Cap: $37.3 Billion
- Industry: Semiconductors & Related Devices
- Current Price: $67.95 (recovering from 52-week low of $64.13)
- Primary Business: Microchip became an independent company in 1989 after spinning off from General Instrument. The firm specializes in microcontrollers, particularly 8-bit MCUs for consumer electronics, though it has expanded into higher-end processors and analog components for automotive, industrial, and communication applications.
💰 The Option Flow Breakdown
The Tape (December 12, 2025 @ 11:02:39):
| Time | Symbol | Side | Buy/Sell | Type | Expiration | Premium | Strike | Volume | OI | Size | Spot | Option Price |
|---|---|---|---|---|---|---|---|---|---|---|---|---|
| 11:02:39 | MCHP | BID | SELL | CALL $57.5 | 2026-03-20 | $36M | $57.5 | 28,000 | 343 | 28,000 | $67.95 | $12.82 |
🤓 What This Actually Means
This is a massive bearish or neutral covered call position that fundamentally limits upside! Here's the breakdown:
- 💸 Huge premium collected: $36M ($12.82 per contract × 28,000 contracts)
- 🎯 Strike selection: $57.50 is 15.4% BELOW current price ($67.95) - deeply in-the-money!
- ⏰ Strategic timing: 98 days to expiration captures Q3 FY2026 earnings (early Feb), Q4 earnings guidance, and the entire recovery cycle narrative
- 📊 Size matters: 28,000 contracts represents 2.8 million shares worth ~$190M at current price
- 🏦 Two possible scenarios:
- Covered call: Institution owns 2.8M shares, willing to cap upside at $57.50 to collect $36M premium
- Naked short call: Pure bearish bet that MCHP drops below $57.50 by March 20th
What's really happening here: The deeply in-the-money nature ($67.95 current price vs $57.50 strike) suggests this is likely a covered call strategy on an existing long position. The seller is essentially saying: "I own millions of MCHP shares bought much lower, and I'm willing to sell them at $57.50 by March to lock in $36M cash today." This could mean they expect MCHP to struggle breaking above current levels, or they're taking profits after the recent rally from $64 lows.
Unusual Score: 🔥 EXTREMELY UNUSUAL (862x average size, Z-Score: 862.44) - This trade happens maybe a few times per year for MCHP! The volume-to-OI ratio of 81.6x shows this opened an entirely new position, not closing existing trades. This is FRESH institutional positioning with high conviction.
📈 Technical Setup / Chart Check-Up
YTD Performance Chart
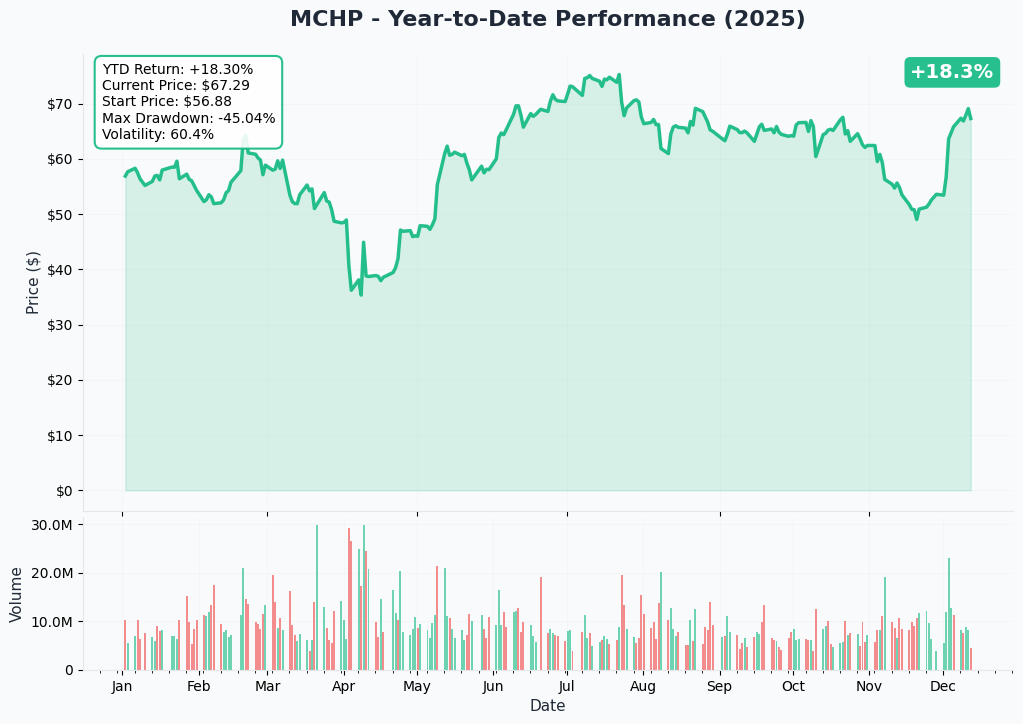
MCHP has endured a brutal year down from its May 2024 peak of $95.26, now trading at $67.12 (as of December 10). The chart tells a painful inventory correction story - the stock crashed 48% from peak to the October low of $64.13 before showing recent signs of bottoming.
Key observations:
- 📉 Severe correction: Down 48% from May 2024 highs, reflecting the inventory destocking cycle
- 🔄 Recent stabilization: Found support around $64-65 in October/November as bookings hit 3.5-year highs
- 📊 December guidance raise: December 2nd guidance bump from strong November bookings triggered minor rally to $67-68 range
- ⚠️ Still down 3-month: Despite recent bounce, still -2.5% over past 3 months (range: $66.14-$77.20)
- 🎢 High volatility: Beta of 1.46 shows this stock moves MORE than the broader market
The critical question: Is the October low of $64.13 the cyclical bottom, or just a bounce in an ongoing downtrend?
Gamma-Based Support & Resistance Analysis
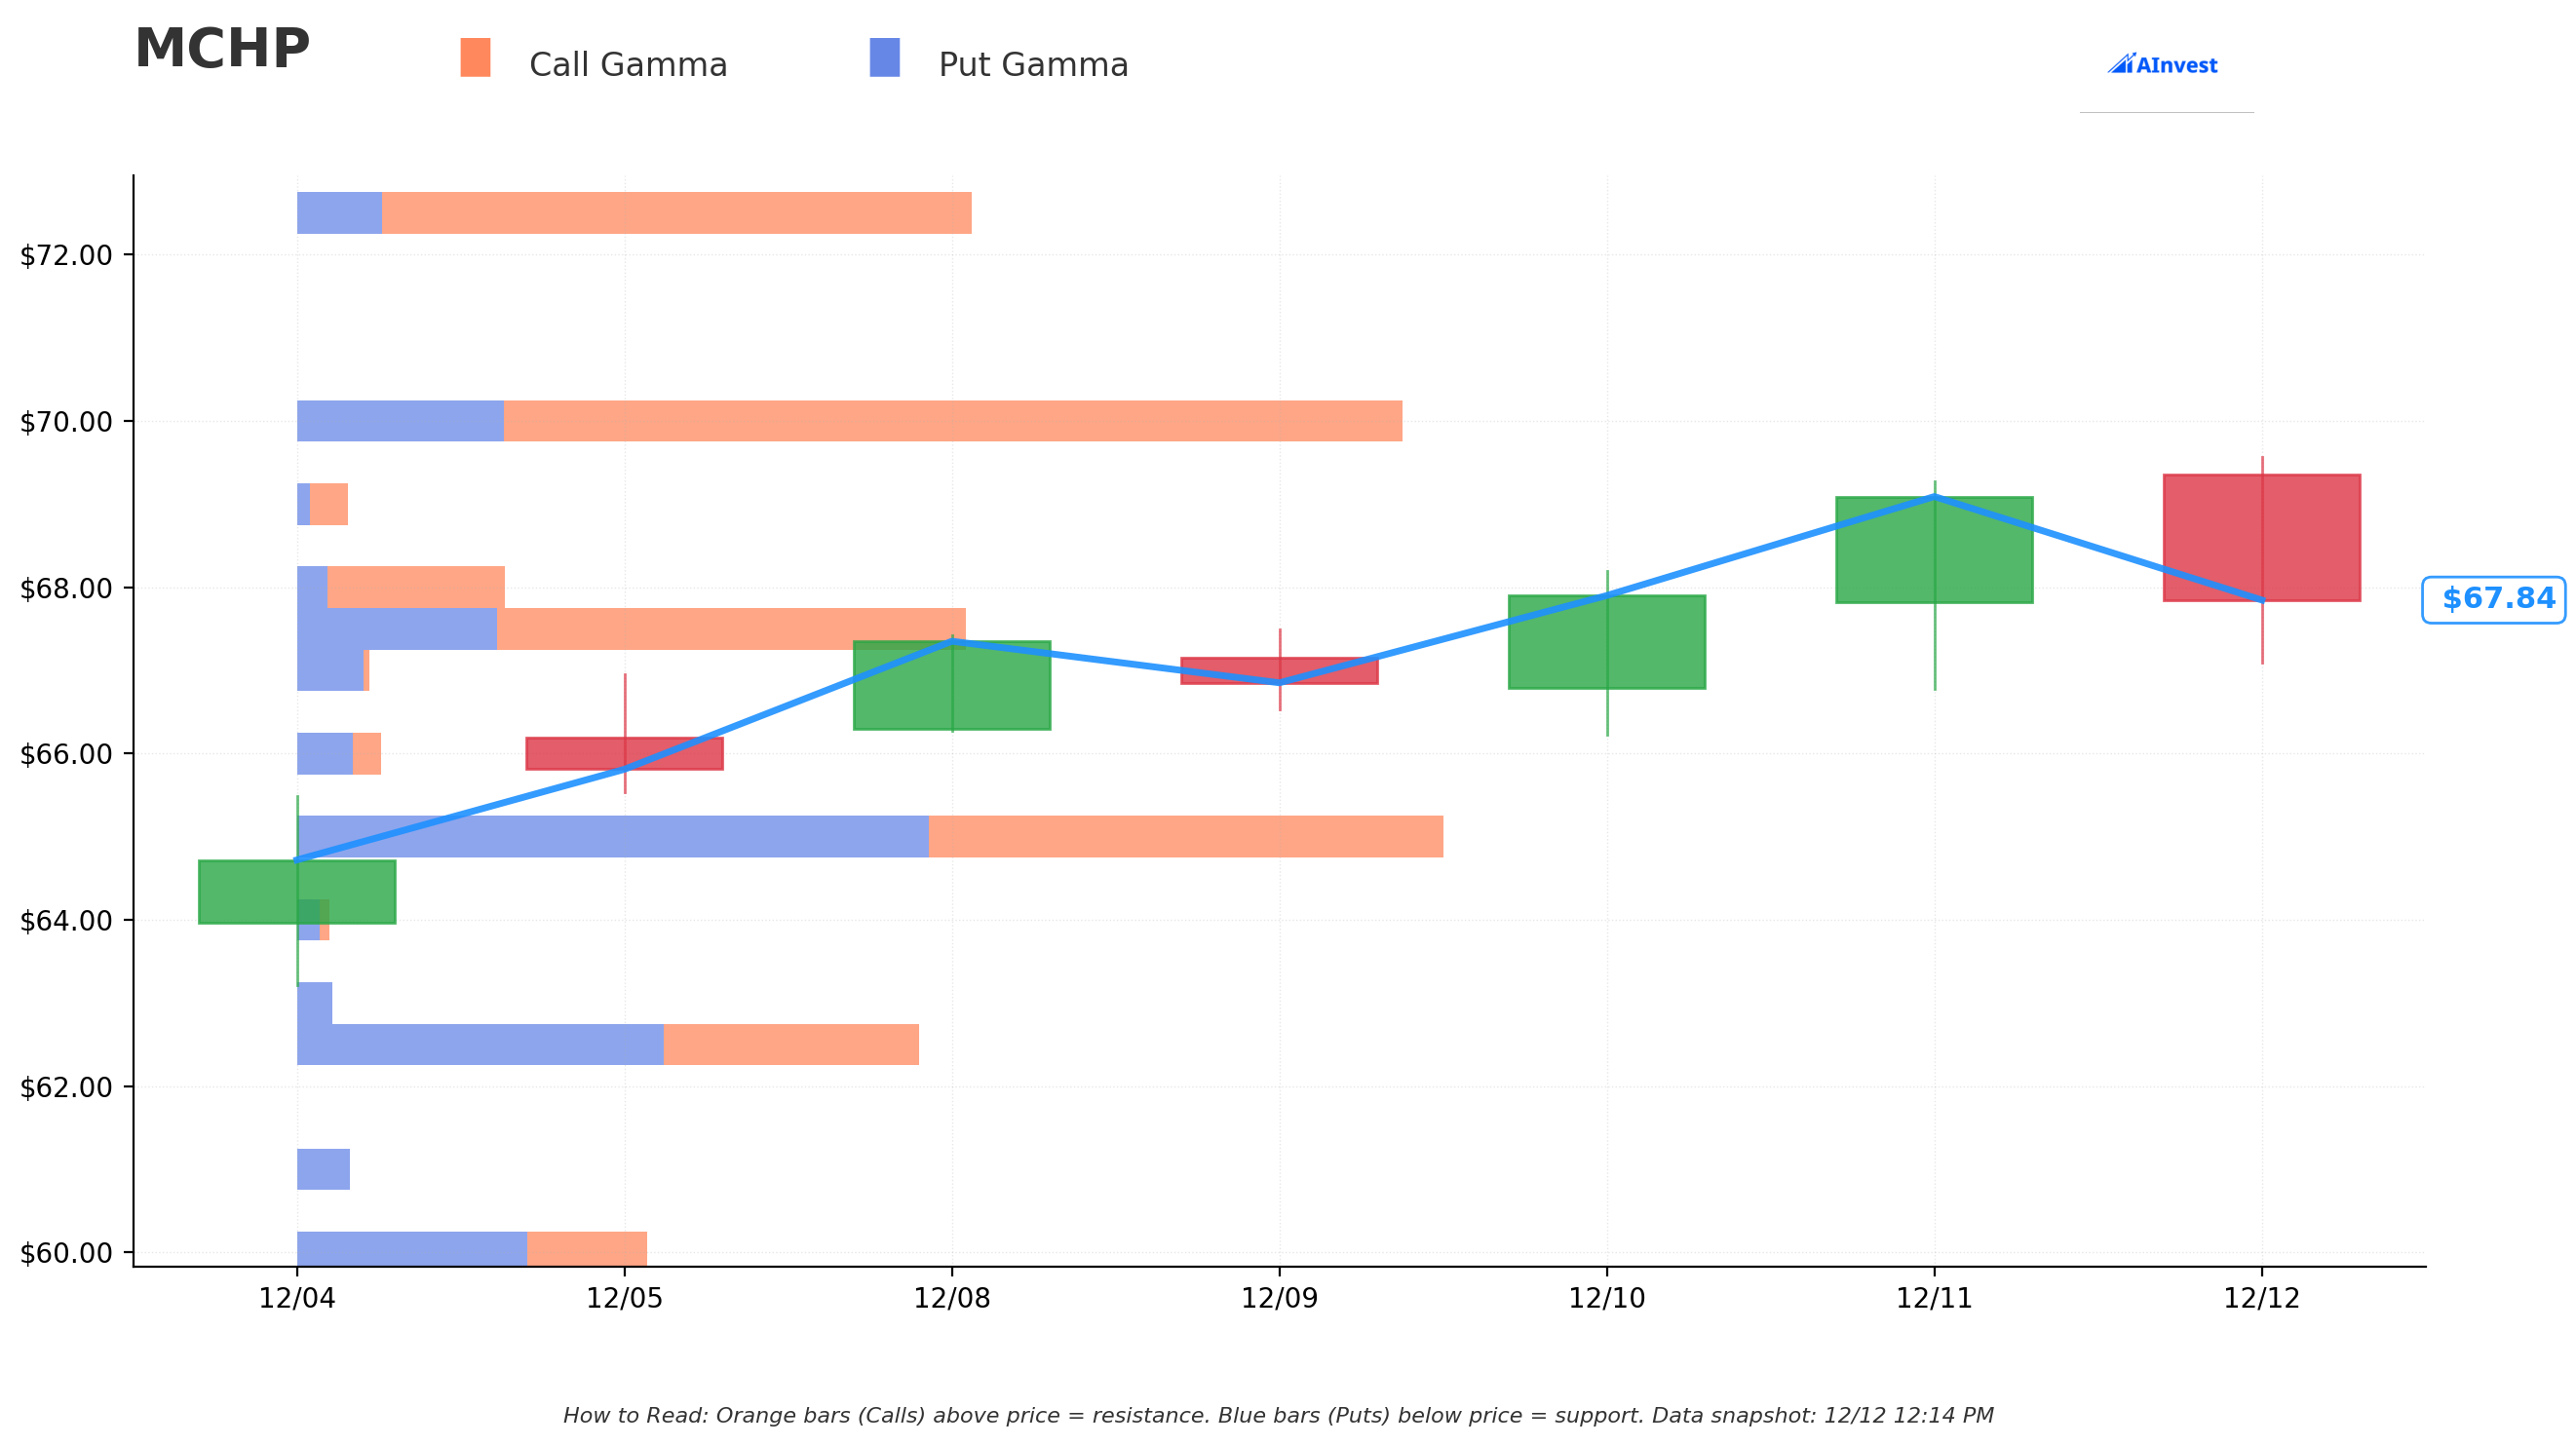
Current Price: $67.87
The gamma exposure map reveals where options positioning creates natural price magnets:
🔵 Support Levels (Put Gamma Below Price):
- $67.50 - Immediate support with 2.08B total gamma exposure (0.5% below current price - CRITICAL FLOOR!)
- $65.00 - Major support at 3.55B gamma (4.2% below - this is the REAL battleground)
- $62.50 - Secondary support at 1.93B gamma (7.9% below current)
- $60.00 - Significant floor with 1.08B gamma (11.6% below)
- $57.50 - Deep support at 0.70B gamma (15.3% below - EXACTLY where this call was sold! Not coincidental)
🟠 Resistance Levels (Call Gamma Above Price):
- $70.00 - Immediate ceiling with 3.47B gamma exposure (3.1% overhead - STRONGEST RESISTANCE ZONE)
- $72.50 - Secondary resistance at 2.10B gamma (6.8% above current)
- $75.00 - Major ceiling zone with 3.10B gamma (10.5% above - significant barrier)
- $77.50 - Extended resistance at 0.81B gamma (14.2% rally required)
- $80.00 - Heavy ceiling with 1.28B gamma (17.9% above current)
What this means for traders: MCHP is trapped in a tight range between $67.50 immediate support and $70.00 crushing resistance. The gamma data shows the $70 level has MASSIVE call gamma (3.47B) creating natural selling pressure as price approaches - market makers will actively hedge by selling stock. Meanwhile, strong put support at $65 (3.55B gamma - the single largest level) suggests that's where big money is positioned to defend.
Notice anything critical? The call seller struck EXACTLY at $57.50 where there's 0.70B gamma support. They're positioning 15% below current price, essentially betting MCHP can't sustain above that level through March. This is DEEP in-the-money positioning suggesting they own the underlying stock.
Net GEX Bias: Bullish (18.4B call gamma vs 8.9B put gamma) - Overall positioning tilts bullish with call gamma dominance, but immediate price action constrained by overhead $70 resistance.
Implied Move Analysis
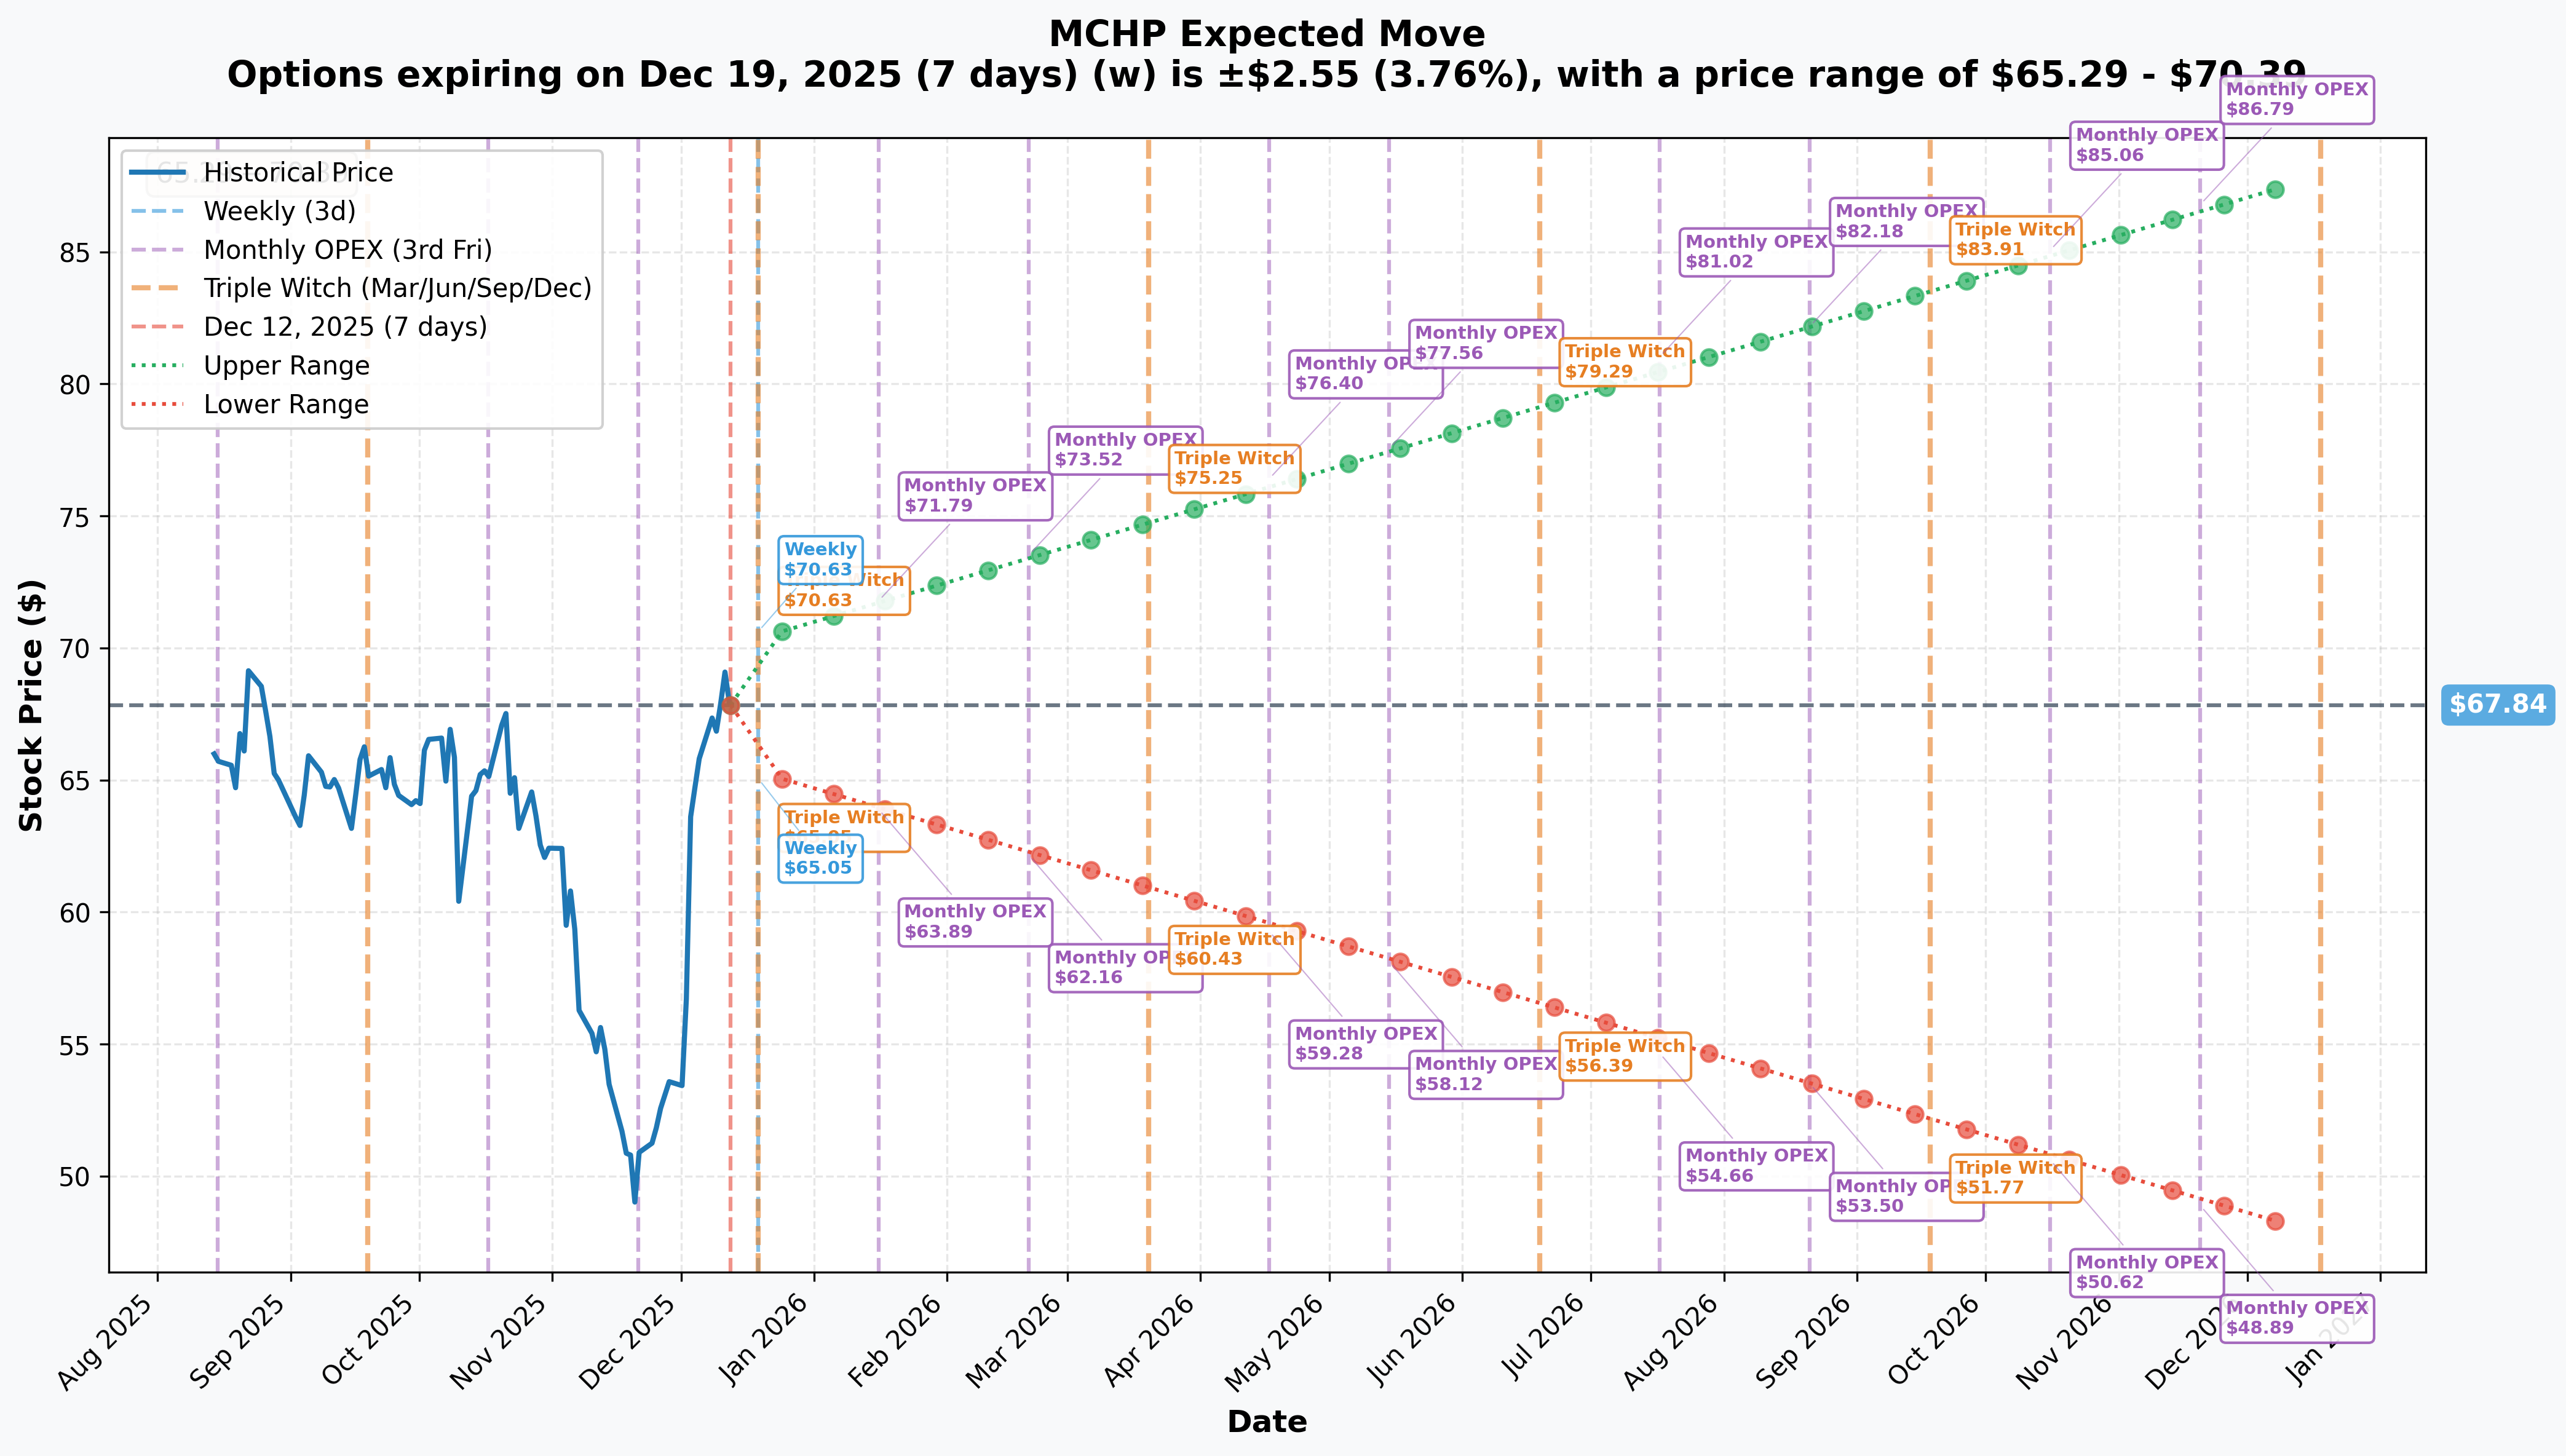
Options market pricing for upcoming expirations:
- 📅 Weekly (Dec 19 - 7 days): ±$2.55 (±3.76%) → Range: $65.29 - $70.39
- 📅 Monthly OPEX (Jan 16 - 35 days): ±$3.95 (±5.82%) → Range: $63.89 - $71.79
- 📅 March OPEX (Mar 20 - 98 days - THIS TRADE!): ±$7.59 (±11.18%) → Range: $60.25 - $75.43
- 📅 Yearly LEAPS (Dec 18, 2026 - 371 days): ±$20.06 (±29.57%) → Range: $47.78 - $87.90
Translation for regular folks: Options traders are pricing in a 3.8% move ($2.55) by December 19th for weekly expiration, moderately tame action. But looking out to the March 20th expiration (when this $36M call expires), the market expects an 11% move ($7.59) which puts the upper range at $75.43 and lower range at $60.25.
Critical insight: The call seller positioned at $57.50 strike is BELOW even the bearish end of the March implied move range ($60.25). This suggests extreme confidence that MCHP won't sustain current levels, OR they're running a covered call collecting premium on shares they're willing to sell at a loss if assigned.
The relatively modest implied volatility reflects the semiconductor sector's stabilization narrative - but also suggests potential for a surprise move if recovery thesis proves wrong.
🎪 Catalysts
🔥 Already Happened (Recent Past)
Q3 FY2026 December Quarter Guidance Raised - December 2, 2025 💪
MCHP surprised markets by raising financial guidance on December 2nd based on exceptional November bookings:
- 📊 Updated Revenue: ~$1.149B (raised from prior range, +1% sequential, +12% YoY)
- 💰 Updated Non-GAAP EPS: ~$0.40 (raised from $0.34-$0.40 range)
- 🔥 Key Driver: November bookings hit 3.5-year highs with December strengthening as orders pulled forward from January
- 📈 Analyst Reaction: B of A Securities raised price target from $67 to $72 on December 5th, citing cyclical recovery
This was THE catalyst that sparked the recent mini-rally from $65 to $68 range. However, the fact that institutions are selling $36M worth of calls just 10 days AFTER this positive news suggests skepticism about sustainability.
Q3 FY2025 Earnings Miss - February 6, 2025 😰
The most recent earnings report showed the depth of MCHP's challenges:
- 📊 Revenue: $1.026B (down 41.9% YoY)
- 💔 GAAP Net Loss: $53.6M (-$0.10 per share) vs prior year income of $419.2M
- 💰 Non-GAAP EPS: $0.20 vs $0.25 updated guidance (MISS)
- 📉 Gross Margin: 54.7% GAAP, 55.4% non-GAAP (down from prior year)
- ⚠️ CEO Commentary: Steve Sanghi acknowledged need for "decisive steps to realign the business"
This earnings disaster in February showed how severe the inventory correction had become, explaining the stock's 48% decline from peak.
Restructuring Actions Throughout 2025 🏭
MCHP implemented aggressive cost-cutting to survive the downturn:
- 🏭 Fab Closures (March 2025): Closure of Fab2 in Tempe, Arizona; downsizing of Fabs 4 and 5
- 💰 Expected Savings: $90M annually from Fab2 closure, $25M from Fabs 4 & 5 downsizing = $115M total
- 👷 Employee Furloughs: Announced February 10, 2025 - intermittent furloughs throughout year
- 🇺🇸 CHIPS Act: Suspended application for CHIPS funding in December 2024
These actions should boost margins as revenue recovers, but also signal management conservatism.
🚀 Upcoming Catalysts (Next 3 Months - Through March Call Expiration)
Q3 FY2026 Earnings - Early February 2026 (60 DAYS AWAY!) 📊
MCHP will report December quarter results in early February 2026 (historically first week of February). This is THE major catalyst for the March call expiration:
- 📊 Updated Revenue Guidance: ~$1.149B (raised December 2nd), representing +1% sequential and +12% YoY growth
- 💰 Updated Non-GAAP EPS: ~$0.40 (raised from $0.34-$0.40 range)
- 📈 Updated GAAP EPS: ~$0.02 (return to profitability from prior loss)
- 🎯 Key Metrics to Watch:
- Whether November 3.5-year high bookings momentum extended into December/January
- Gross margin trajectory (targeting return to 55%+ from 54.7% low)
- Q4 March quarter guidance - management expects "stronger than seasonal low single digit up sequentially"
- Inventory levels and customer destocking status
Upside surprise potential: If bookings momentum extended through December/January and management guides Q4 aggressively (>5% sequential growth), stock could rally toward $75-80 analyst targets.
Downside risk: Any indication November bookings were one-time pull-forward from January (channel stuffing) or weak Q4 guidance could send stock back toward $60-65 lows. Management has history of conservative guidance.
Q4 FY2026 Earnings Preview - Within Call Expiration Window 🎯
While Q4 earnings won't be reported until early May 2026, management's Q4 guidance during the February earnings call falls WITHIN the March 20th call expiration window. This is critical:
- 📊 Management Expectation: "March quarter backlog is currently strong" with "stronger than seasonal low single digit up sequentially"
- 📈 Seasonal Pattern: March, June, September 2026 expected to be three strong quarters; December seasonally weakest
- 🔥 Bookings Trend: Backlog "filling in better than expected" and "growing nicely into March 2026 quarter"
- ⚠️ Risk Factor: Q1 FY2026 (Sept quarter) showed 10.8% sequential growth - can they maintain momentum?
If management guides Q4 conservatively (flat to +3%), the stock will struggle. If they guide +5-7% sequential, recovery narrative accelerates.
Semiconductor Cycle Recovery Timeline ⏰
The broader semiconductor cycle is THE macro catalyst:
- 🔄 Current Status: Inventory correction showing signs of completion in Q4 2025
- 📈 Industry View: Analysts project modest recovery beginning September 2025 quarter, driven by inventory completion and demand pickup
- 💪 MCHP Positioning: May 2025 bookings tracked as "highest in two years," suggesting industrial and automotive stabilizing
- ⚠️ Bear Case: Recovery could stall if demand proves to be inventory replenishment rather than genuine end-market consumption
The March call expiration will reveal whether Q4 2025 / Q1 2026 recovery is real or just a head-fake.
Analyst Price Target Updates 📊
Following the December 2nd guidance raise, several analysts updated targets:
- 🟢 B of A Securities: Raised to $72 from $67 on Dec 5 (Neutral rating) - Vivek Arya citing cyclical improvement
- 🟢 Needham: Raised to $75 from $73 (Buy rating) - N. Quinn Bolton expecting continued bookings strength
- 🟢 Rosenblatt: Maintained $80 Buy rating (Dec 3) - Kevin Cassidy most bullish on recovery
- 🔴 Truist Securities: Maintained $60 Hold (Dec 3) - Most bearish, sees limited upside
Consensus: $73.52 average target (37% upside from current $67) across 21 analysts. However, wide range from $58 low to $88 high shows major disagreement on recovery sustainability.
The $36M call seller at $57.50 is effectively disagreeing with ALL analyst targets, betting stock doesn't even hold current $67 level by March!
🎲 Price Targets & Probabilities
Using gamma levels, implied move data, and catalyst timeline through March 20th expiration:
📈 Bull Case (30% probability)
Target: $75-$80
How we get there:
- 💪 February earnings CRUSH with revenue $1.16B+ (above $1.149B guidance) and gross margins expanding to 56%+
- 🔥 March quarter guidance STRONG - management calls for +6-8% sequential (vs typical +3-5% seasonal)
- 📊 Bookings momentum continues - January/February tracking at or above November's 3.5-year highs
- 🏭 Restructuring savings ($115M annually) start flowing through to expand margins faster than expected
- 🌍 End markets accelerating: automotive and industrial orders strengthen in Europe/Americas (not just Asia)
- 📈 Analyst upgrades accelerate - KeyBanc's $85 target and Rosenblatt's $80 get validated
- 🚀 Breakout above $70 gamma resistance triggers technical rally to $75+ (implied move upper range)
Key metrics needed:
- Gross margins >55.5% (proving operational leverage)
- Q4 guidance sequential growth >+5%
- Return to GAAP profitability sustained
- Customer inventory normalized (no more destocking headwinds)
Probability assessment: Only 30% because requires near-perfect execution. The $70 gamma resistance (3.47B) is MASSIVE and semiconductor recovery remains unproven. Stock already rallied from $64 to $68 on December guidance raise - "good news is priced in."
Impact on call seller: Major loss scenario. $57.50 calls would be worth $17.50-22.50 (stock at $75-80), loss of $4.68 to $9.68 per share × 28,000 = -$13M to -$27M loss if naked short, or opportunity cost if covered call (shares called away at $57.50 when worth $75-80).
🎯 Base Case (45% probability)
Target: $62-$72 range (CHOPPY AROUND CURRENT)
Most likely scenario:
- ✅ February earnings meet guidance (~$1.15B revenue, $0.38-0.42 EPS)
- 📱 Bookings solid but not spectacular - some December/January strength but not repeating November's 3.5-year highs
- ⚖️ Q4 guidance conservative - management sticks to "low single digit sequential" (+2-4%), not blowing out
- 🤖 Recovery narrative progressing but SLOWLY - no sudden acceleration in end markets
- 🇨🇳 China/macro remains uncertain - no major positive or catastrophic negative
- 🔄 Trading within $62.50-$72.50 gamma support/resistance bands
- 📊 Market remains cautious - too early to declare "all clear" on semiconductor cycle
- 💤 Volatility moderate - implied vol stays 30-40% range (typical for MCHP)
This is the covered call scenario: Stock consolidates in $60-70 range, $57.50 calls expire worthless or assigned. If covered call, seller keeps entire $36M premium (~19% return on $190M stock position in just 3 months). If naked short, they close at minimal loss or profit.
Why 45% probability: Stock at inflection point - sentiment improving but fundamentals still challenged. Revenue still down 42% YoY in recent quarter despite guidance raise. Most institutions will adopt "wait and see" approach.
📉 Bear Case (25% probability)
Target: $55-$62 (BREAK THE STRIKE!)
What could go wrong:
- 😰 February earnings disappoint - revenue misses $1.149B guidance or EPS below $0.40 due to margin pressure
- 🚨 November bookings proved to be ONE-TIME pull-forward - December/January tracking much weaker
- ⏰ Q4 guidance weak - management guides flat to +2% sequential, citing continued customer caution
- 🇨🇳 Renewed macro concerns - recession fears, China weakness, tariff impacts on automotive/industrial
- 💸 Gross margins compress further (below 54%) from competitive pricing pressure and underutilization
- 📊 Competitors (TI, STM, Infineon) reporting weak results, suggesting sector-wide demand issues
- 🔨 Break below $65 gamma support triggers cascade to $60, then $57.50
- 💔 Dividend sustainability concerns emerge - 100.9% cash payout ratio while still unprofitable
Critical support levels:
- 🛡️ $65.00: Major gamma floor (3.55B - THE LINE IN SAND) - break here and momentum shifts bearish
- 🛡️ $62.50: Secondary support (1.93B gamma) - likely bounce attempt here
- 🛡️ $60.00: Deep floor (1.08B gamma) - psychological level
- 🛡️ $57.50: This call strike! (0.70B gamma) - if we hit here, sellers WIN BIG
Probability assessment: 25% because requires multiple negative catalysts or major macro deterioration. MCHP's fundamentals show early stabilization signs, and management already guided conservatively. However, the call seller betting $36M clearly thinks this scenario has >25% odds.
Call P&L in Bear Case:
- Stock at $55 by Mar 20: $57.50 calls worth $0 (out-of-money), keep entire $36M premium = 100% profit if naked short
- Stock at $60 by Mar 20: Calls worth $2.50, profit = $10.32 per share × 28,000 = $28.9M gain (80% profit)
- Stock at $57.50 by Mar 20: Calls worth $0.01 (at-the-money), profit = ~$12.82/share × 28,000 = ~$35.9M gain (99% profit!)
💡 Trading Ideas
🛡️ Conservative: Dividend Collector With Caution
Play: IF you own MCHP for the 2.7% dividend, hold but set tight risk management
Why this works:
- 💰 Dividend yield: $1.82 annual dividend provides 2.7% yield - attractive in low-rate environment
- 🏦 Long-term compounder: Company survived 50+ years, multiple cycles - unlikely to disappear
- 📊 Recovery optionality: If semiconductor cycle recovers as expected, upside to $80-90 over 12-24 months
- 🎯 December guidance raise shows early signs of stabilization
- ✅ Value territory: Trading near 52-week lows, down 48% from peak
HOWEVER - Major risk:
- ⚠️ Dividend sustainability: Cash payout ratio of 100.9% while company unprofitable on GAAP basis
- 💔 If earnings don't recover in Q3/Q4, dividend CUT risk increases significantly
- 🚨 The $36M institutional call sale suggests big money is NOT confident in recovery
Action plan:
- 👀 Hold existing shares ONLY if position size is small (<5% of portfolio)
- 🎯 Set mental stop at $62 (below $65 major gamma support) - if breached, exit immediately
- ✅ Watch February earnings for margin expansion and Q4 guidance quality
- 📊 Monitor quarterly dividend announcements - any cut would trigger -15-20% gap down
- ⏰ Revisit allocation after Q3 earnings validates or invalidates recovery thesis
Expected outcome: Collect 0.7% dividend (~3 months to March expiration), possibly see small +5-10% capital gain if earnings strong, but protect against -15-20% downside if cycle thesis breaks.
Risk level: Moderate (dividend risk, capital depreciation) | Skill level: Beginner-friendly
⚖️ Balanced: Bull Put Spread Around Support
Play: Sell put spread targeting major $65 gamma support zone
Structure: Sell $65 puts, Buy $60 puts (January 16 expiration - 35 days)
Why this works:
- 🎯 Strong gamma support: $65 has 3.55B total gamma (biggest single level) - institutions defending this price
- 📊 Recent range: Stock found support $64-65 in October/November twice already
- 🤝 Defined risk: $5 wide spread = $500 max risk per spread, profit potential $150-200
- ⏰ Pre-earnings expiration: January 16 expires BEFORE February earnings (avoid binary event risk)
- 💰 Probability edge: Stock at $67.95 gives 4.3% cushion to $65 strike (43% out-of-money)
- 🛡️ Implied move support: Even bearish January implied move only goes to $63.89 (below your $60 long put)
Estimated P&L:
- 💰 Collect ~$1.50-2.00 credit per spread
- 📈 Max profit: $150-200 if MCHP above $65 at Jan 16 expiration (keep full credit)
- 📉 Max loss: $300-350 if MCHP below $60 (defined risk)
- 🎯 Breakeven: ~$63.00-63.50
- 📊 Win probability: ~65-70% based on delta (stock stays above $65)
Entry requirements:
- ✅ Only enter if stock trading $67+ (maintains cushion to short strike)
- ✅ Collect at least $1.50 credit (30% return on risk)
- ❌ Skip if implied volatility spikes >45% (wait for IV to settle)
Position sizing: Risk only 3-5% of portfolio per spread, max 3-5 spreads
Exit plan:
- 🎯 Take profit at 50-60% max gain ($0.60-0.80 credit remaining) rather than holding to expiration
- 🚨 Close immediately if stock breaks below $66 (approaching short strike)
- ⏰ Roll down to $62.50/$57.50 spread if stock rallies above $70 by late December
Risk level: Moderate (defined risk, high win probability) | Skill level: Intermediate
🚀 Aggressive: Naked Put Sale at Support (ADVANCED - MARGIN REQUIRED!)
Play: Sell naked March $57.50 puts - mirror the institution's strike!
Structure: Sell March 20, 2026 $57.50 puts naked (same expiration as the $36M call trade!)
Why this could work:
- 🎯 Institutions positioned here: Someone sold $36M calls at this exact strike - they clearly see support
- 📊 Deep downside protection: Current price $67.95, strike $57.50 = 15.4% cushion (would need to fall BELOW October lows)
- 💰 Fat premium: Collect ~$3-4 per put (5-7% return for 3 months if expires worthless)
- 🏦 Willingness to own: At $57.50, you're buying MCHP at prices not seen since 2020 Covid crash
- 📈 Recovery thesis: If cycle turns, stock worth $80-90+ making $57.50 entry SPECTACULAR long-term
- 🛡️ Gamma support: 0.70B gamma at exactly this strike creates natural floor
Why this could blow up (SERIOUS RISKS):
- 💸 MASSIVE margin requirement: Broker will hold $5,750+ margin per put contract (or 20% of stock value)
- ⏰ THREE MONTHS exposure: Earnings in February, Q4 guidance, macro events - lots can go wrong
- 😱 Unlimited downside BELOW strike: If MCHP crashes to $40 (possible if dividend cut or recession), you're obligated to buy at $57.50 = $17.50 loss per share!
- 📊 Assignment risk: If stock falls below $57.50 before expiration, could be assigned early
- 🎢 Sector-wide selloff: One bad print from TI, NVDA, or AMD could drag entire semiconductor sector down 15-20%
- ⚠️ Dividend cut scenario: Company already unprofitable - any dividend reduction triggers -20% gap down overnight
Estimated P&L:
- 💰 Collect: ~$3-4 premium per put
- 📈 Max profit: $300-400 if MCHP above $57.50 at March 20 expiration (100% profit on collected premium)
- 🚀 Effective cost basis if assigned: $53.50-54.50 (strike minus premium collected)
- 📉 Loss scenario: Stock at $50 at expiration = forced to buy at $57.50, immediately down $7.50 per share minus $3-4 collected = -$3.50 to -$4.50 per share loss
- 💀 Disaster: Stock at $40 (dividend cut scenario) = -$17.50 per share loss, premium helps but still down -$13.50 to -$14.50
Margin requirement example:
- Selling 10 puts = controlling 1,000 shares
- Margin required: ~$57,500 (varies by broker)
- Premium collected: ~$3,000-4,000
- Net capital at risk: ~$53,500-54,500
CRITICAL WARNINGS - DO NOT attempt unless you:
- ✅ Have $50,000+ margin available per 10 contracts
- ✅ Are WILLING and ABLE to own MCHP stock at $57.50 (actually WANT to own it at this price)
- ✅ Understand you could be assigned BEFORE expiration if stock drops
- ✅ Have traded naked puts before and understand assignment mechanics
- ✅ Accept that one bad earnings print could result in 20-30% unrealized loss
- ✅ Can mentally handle seeing -$5,000 to -$10,000 paper losses without panic selling
Risk management:
- 🎯 Set hard stop: Buy back puts if MCHP breaks $62 (first sign cycle thesis breaking)
- 📊 Position sizing: No more than 2-3% of total portfolio in premium collected
- ⏰ Active monitoring: Check position daily, especially around earnings February 2026
- 🔄 Rolling strategy: If stock drops to $60-62 by February, consider rolling down to $55 strike and out to May/June
Risk level: EXTREME (unlimited downside, margin risk, assignment) | Skill level: Advanced only
Probability of profit: ~70% (stock staying above $57.50 by March 20), but unlimited loss potential below strike
⚠️ Risk Factors
Don't get blindsided by these potential landmines:
-
⏰ February earnings binary event: Q3 FY2026 results in early February (expected first week) create MASSIVE volatility catalyst. Stock could gap 10-15% either direction based on whether December quarter met $1.149B guidance, gross margins expanded above 54.7%, and Q4 guidance quality. Management has history of conservative guidance followed by small beats, but Q3 FY2025 miss in February 2025 showed they can disappoint badly.
-
💸 November bookings may be one-time pull-forward: Management raised December guidance citing "November bookings at 3.5-year highs" with "December strengthening as orders pulled in from January". This language suggests potential channel stuffing or timing games. What happens in January/February when those pulled-forward orders aren't repeated? Stock could crash back to $60-65 if bookings momentum proves temporary.
-
🇨🇳 End market demand remains uncertain: While bookings improved, actual END CUSTOMER demand (automotive, industrial) is still weak. European and Americas automotive particularly weak through 2025 with only gradual recovery expected H2 2025. Industrial segment muted with continued inventory challenges. Recovery dependent on "genuine demand rather than just inventory replenishment".
-
💔 Dividend cut risk is REAL: Cash payout ratio of 100.9% while company unprofitable on GAAP basis ($53.6M net loss in Q3 FY2025). If earnings recovery stalls, management may be FORCED to cut dividend to preserve cash. Any dividend reduction would trigger -15-20% immediate selloff as income investors flee. Company paid $1.82 annual dividend but can't sustain this if revenue doesn't recover.
-
⚖️ Competitive pressure intensifying: Texas Instruments, STMicroelectronics, and Infineon challenging market position in microcontroller space. MCHP commands "steady market share" but faces pricing pressure. 32-bit MCU segment (fastest growing) sees fierce competition from all major players. Company may need to cut prices to defend share, compressing margins further.
-
🌍 China domestic insourcing threat: Growing trend of Chinese companies developing local MCU and analog capabilities poses long-term threat to export-focused sales. While MCHP management says "exposure to domestic China market is very low", Chinese customers who BUY from MCHP could shift to domestic suppliers over time.
-
🔨 Gamma resistance at $70 creates ceiling: Massive 3.47B call gamma at $70 strike (strongest single level) means market makers will systematically SELL into rallies to hedge exposure. This creates mechanical selling pressure making breakouts difficult. Current price $67.95 sitting just below this concrete ceiling. Would require sustained institutional buying to overcome.
-
💰 Valuation offers little cushion: At 74.8x forward P/E... wait, that's AMD. MCHP actually trades at MORE REASONABLE valuation given challenges, but stock down 48% from peak means "value trap" risk if recovery doesn't materialize. Revenue still down 42% YoY in Q3 FY2025 - needs sustained multi-quarter recovery to justify current $37B market cap.
-
🏭 Restructuring execution risk: Fab closures and employee furloughs must deliver projected $115M in annual savings ($90M from Fab2, $25M from Fabs 4&5) without disrupting customer relationships or product quality. Any production issues, delivery delays, or quality problems during transition could lose key accounts to competitors.
-
🐋 Smart money selling $36M calls at current levels: The massive institutional call sale at $57.50 just 10 days after positive December guidance raise signals sophisticated players are NOT believers in sustained recovery. When institutions collect $36M by capping upside at $57.50 (15% BELOW current $68 price), they're essentially saying "we think stock goes DOWN from here, not up." This is a MAJOR red flag.
-
📉 Macro recession risk: If broader economy weakens in 2026, MCHP's cyclical exposure to automotive and industrial means revenue could fall FURTHER even from current depressed levels. Company already down 48% from peak - could fall another 20-30% in recession scenario to $45-55 range.
🎯 The Bottom Line
Real talk: Someone just bet $36 MILLION that MCHP can't stay above $57.50 through March 2026 - or they're running a massive covered call locking in gains on a position bought much lower. Either way, this is NOT bullish. Coming just 10 days after the December 2nd guidance raise that sparked optimism, this trade screams "sell the news."
What this trade tells us:
- 🎯 Sophisticated institution expects stock BELOW current $68 levels by March expiration, potentially back toward $57.50
- 💰 They're willing to collect $36M premium ($12.82/share) to cap upside - means they don't believe in $75-80 analyst targets
- ⚖️ The timing (10 days after positive guidance) shows they see December strength as TEMPORARY, not sustainable
- 📊 Strike at $57.50 sits just above major technical support - if stock breaks $60-62, path to $57.50 opens quickly
- ⏰ March 20th expiration captures Q3 earnings (Feb), Q4 guidance, and full cycle recovery test period
This is a "fade the rally" signal, NOT a "buy the dip" opportunity.
If you own MCHP for dividend income:
- ✅ Set TIGHT stops at $62-63 (below $65 major gamma support) to protect capital
- 📊 Watch February earnings like a hawk - any margin disappointment or weak Q4 guidance, exit immediately
- ⏰ Monitor quarterly dividend announcements - first sign of cut, sell before the gap down
- 🎯 If you're up >20% from lower entries ($50s), consider taking some profits now at $67-68
- 🛡️ Reduce position size to <5% of portfolio until recovery thesis PROVEN with 2-3 consecutive quarters of margin expansion
If you're considering new positions:
- ⏰ DO NOT chase at $67-68 - wait for February earnings clarity
- 🎯 Better entry opportunities likely at $60-65 IF earnings validate recovery (that's 10-12% lower)
- 📈 Need to see confirmation: December revenue met $1.149B, Q4 guidance >+5% sequential, gross margins expanding toward 56%
- 🚀 Long-term (12-24 months), IF cycle recovers, upside to $80-90 is possible - but timing is WRONG now
- ⚠️ Current risk/reward POOR: 5-10% upside to $70 resistance vs 15-20% downside to $57.50 strike
If you're bearish or neutral:
- 🎯 The $36M call sale at $57.50 validates bearish thesis - institutions see limited upside
- 📊 Consider bull put spreads around $65 support (sell premium while defining risk)
- ⚠️ Avoid aggressive bearish bets (naked shorts) - stock could bounce to $70-75 on strong earnings
- 📉 Watch for break below $65 - that's the trigger for cascade to $60, then $57.50
- ⏰ Post-February earnings offers clearer directional setup after binary event
Mark your calendar - Key dates:
- 📅 December 19, 2025 - Weekly/Triple Witch OPEX (implied range: $65.29-$70.39)
- 📅 January 16, 2026 - Monthly OPEX
- 📅 Early February 2026 (Week of Feb 2-6) - Q3 FY2026 earnings report (THE CATALYST!)
- 📅 March 20, 2026 - Expiration of this $36M call trade, Q4 guidance within window
- 📅 Early May 2026 - Q4 FY2026 earnings (full cycle recovery confirmation or failure)
Final verdict: MCHP's long-term cyclical recovery story may be intact - November bookings at 3.5-year highs, $115M restructuring savings, and eventual automotive/industrial stabilization are all real. BUT, at $67-68 after a bounce from $64 lows, the risk/reward is NOT favorable. The $36M institutional call sale positioning at $57.50 is a CLEAR warning: smart money expects stock LOWER or at best sideways, not higher.
Be patient. Wait for February earnings. Look for better entries at $60-65 if recovery validates. The semiconductor cycle will still be there in 3-4 months, and you'll sleep better paying $62 instead of $68.
This is a "show me" story - let management PROVE the recovery before committing capital. 💪
Disclaimer: Options trading involves substantial risk of loss and is not suitable for all investors. This analysis is for educational purposes only and not financial advice. Past performance doesn't guarantee future results. The 862x unusual score reflects this specific trade's size relative to recent MCHP history - it does not imply the trade will be profitable or that you should follow it blindly. Selling naked calls (especially on a stock you don't own) creates UNLIMITED loss potential if the stock rises significantly. Covered calls limit upside to the strike price. Always do your own research and consider consulting a licensed financial advisor before trading. Earnings create binary event risk with potential for 10-15% gaps either direction. The call seller may have complex portfolio hedging needs or cost basis not applicable to retail traders. Dividend cuts can result in immediate 15-20% stock price declines.
About Microchip Technology: Microchip Technology became an independent company in 1989 when it was spun off from General Instrument. The firm specializes in microcontrollers, particularly 8-bit MCUs for consumer electronics, though it has expanded into higher-end processors and analog components, with a market cap of $37.3 billion in the Semiconductors & Related Devices industry.