🔥 MCHP: $9.3M Bullish Bet Signals Institutional Confidence Post-Earnings Beat!
📅 February 9, 2026 | 🔥 Unusual Activity Detected
🎯 The Quick Take
Someone just loaded up on $9.3 MILLION worth of MCHP call options just 4 days after the company crushed Q3 earnings! This is institutional money doubling down on the semiconductor recovery story, betting the stock rallies to $67.50+ by June. With the first YoY revenue growth since 2024 already in the books and Q4 guidance pointing to nearly 30% YoY growth, big money sees more upside ahead.
🏢 Company Overview
Microchip Technology Inc (MCHP) is a leading semiconductor company specializing in microcontroller units (MCUs) and analog chips.
| Metric | Value |
|---|---|
| Market Cap | $41.13B |
| Exchange | NASDAQ |
| Industry | Semiconductors & Related Devices |
| Employees | 19,400 |
| Headquarters | Chandler, AZ |
What They Do: More than half of revenue comes from MCUs, which are used in everything from remote controls to garage door openers to power windows in cars. The company serves approximately 100,000-120,000 customers globally across automotive, industrial, data center, aerospace & defense, and consumer electronics markets.
💰 The Option Flow Breakdown
📊 What Just Happened
| Date | Time | Symbol | Direction | Type | Expiration | Strike | Volume | OI | Size | Spot | Premium | Option Symbol |
|---|---|---|---|---|---|---|---|---|---|---|---|---|
| 2026-02-09 | 09:55:41 | MCHP | BUY | CALL | 2026-06-18 | $67.50 | 7,500 | 46,000 | 7,500 | $74.28 | $9,300,000 | MCHP20260618C67.5 |
🤓 What This Actually Means
Let me break this down:
🐋 Whale Alert: Someone spent $9.3M on June 2026 calls - that's not your neighbor Bob trading on Robinhood. This is institutional-grade conviction.
📍 Deep ITM Calls: The $67.50 strike is already $6.78 in-the-money with the stock at $74.28. This isn't a lottery ticket - it's a leveraged long position with ~87% intrinsic value.
📆 Strategic Timing: Just 4 trading days after MCHP crushed Q3 earnings, posting the first YoY revenue growth since Q2 FY2024.
🎯 Strategy Detection: Long Call (BTO - Buy to Open)
Volume vs OI Analysis:
- Volume: 7,500 contracts
- Open Interest: 46,000 contracts
- Vol/OI Ratio: 16.3%
- Signal: This adds to an already substantial position
📈 Technical Setup / Chart Check-Up
YTD Performance
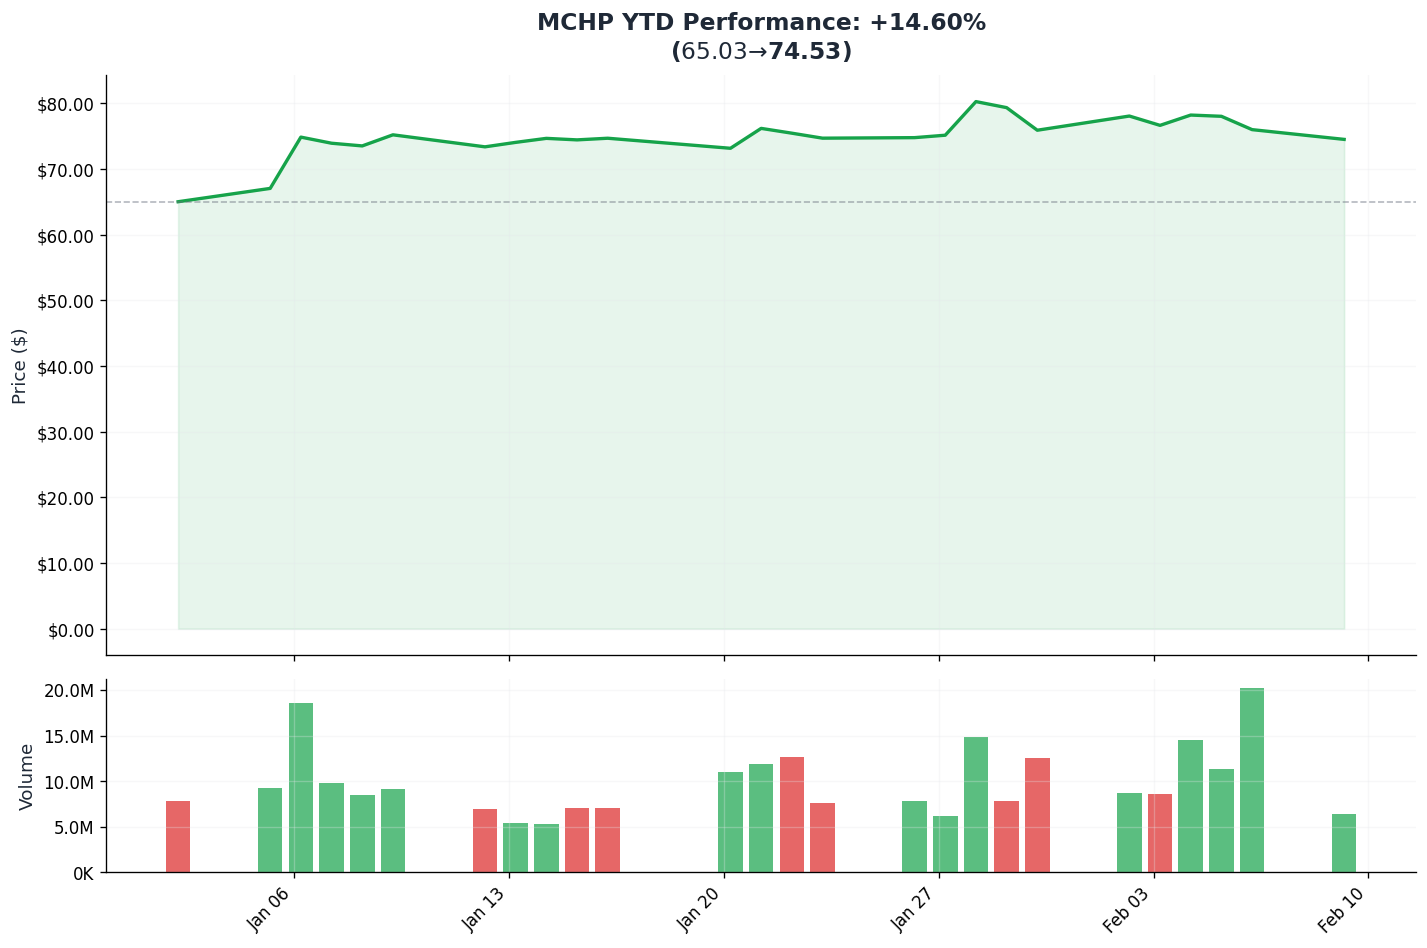
MCHP has been on a tear! According to Stock Invest, the stock is up +24.8% YTD and has rallied +52.7% since the November 20, 2025 buy signal. The stock recently traded between $73.38 and $78.77, with the 52-week high of $81.43 set just on January 28, 2026.
Key Price Levels:
- 🔹 Current Price: $74.28
- 🔹 52-Week High: $81.43 (Jan 28, 2026)
- 🔹 52-Week Low: $34.13 (April 7, 2025)
Gamma-Based Support & Resistance Analysis
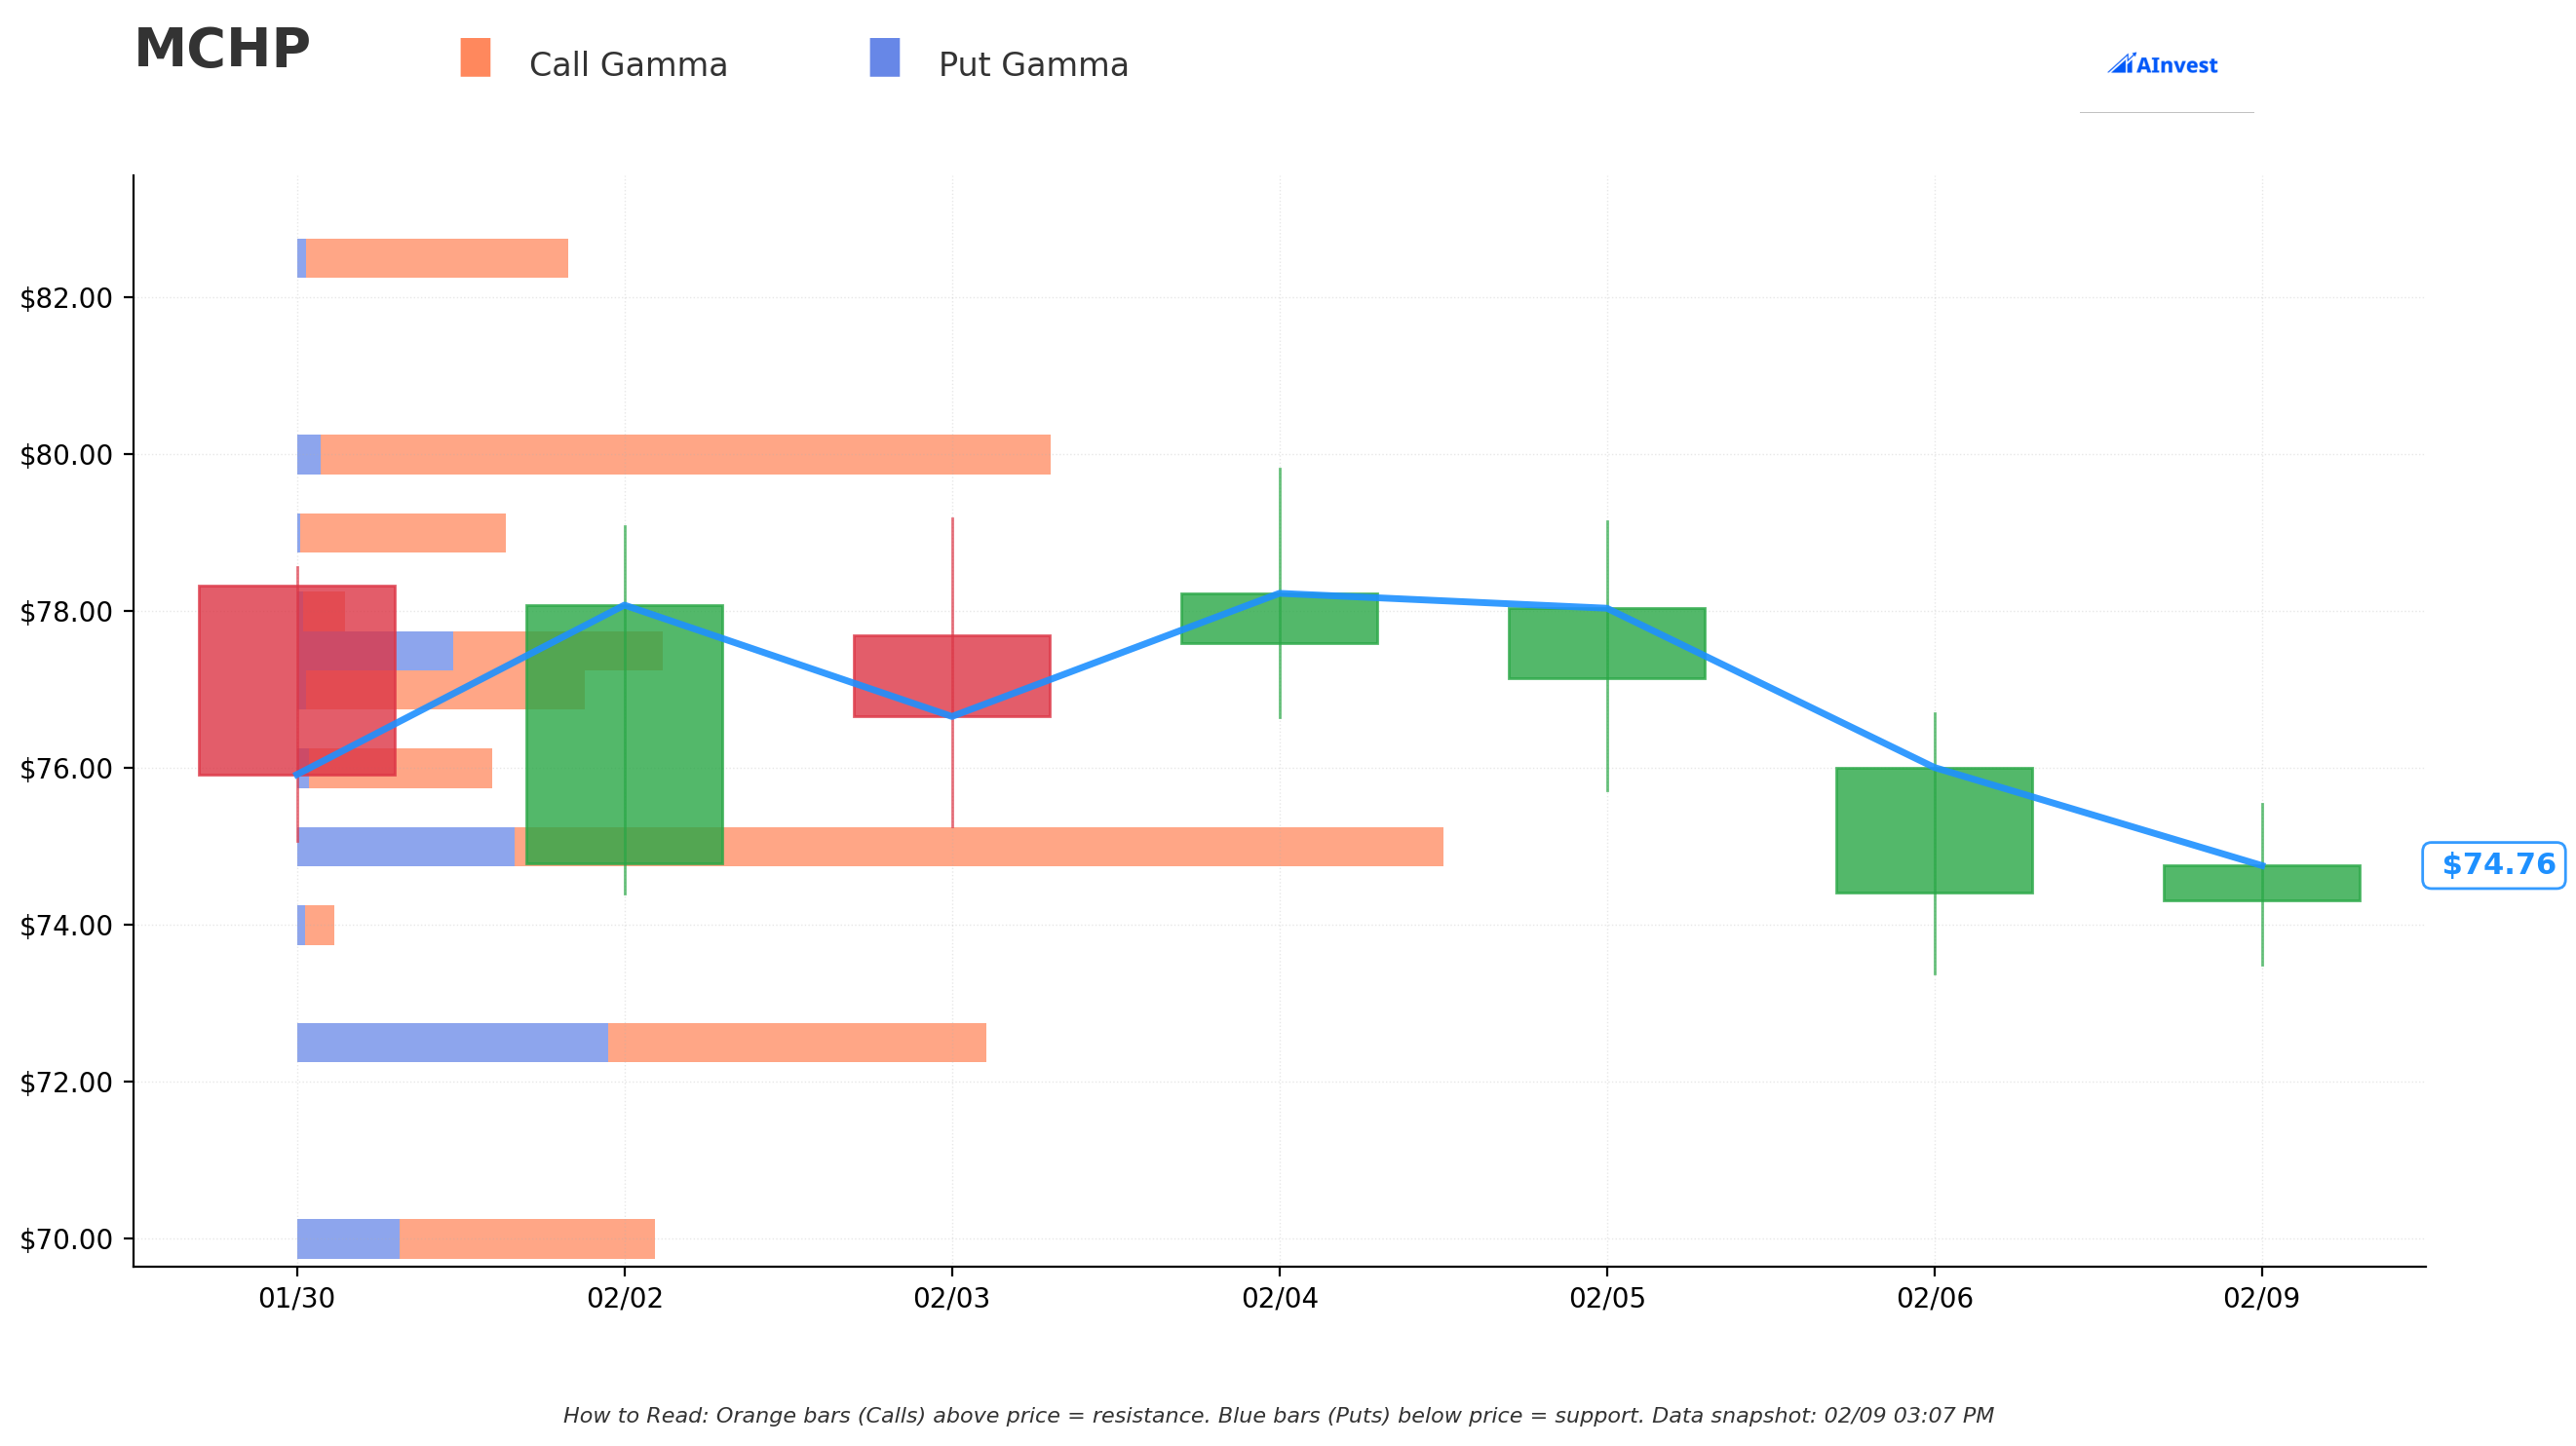
Based on options market maker positioning, here are the key levels to watch:
🟠 Resistance Levels (Call Gamma):
| Strike | Net GEX | Distance from Spot |
|---|---|---|
| $75.00 | 2.69 | 0.2% - Immediate Resistance |
| $77.00 | 1.03 | 2.9% |
| $77.50 | 0.21 | 3.5% |
| $80.00 | 2.67 | 6.9% - Major Resistance |
| $85.00 | 1.77 | 13.5% |
🔵 Support Levels (Put Gamma):
| Strike | Net GEX | Distance from Spot |
|---|---|---|
| $72.50 | 0.27 | -3.1% - First Support |
| $70.00 | 0.58 | -6.5% |
| $67.50 | 5.70 | -9.8% - Major Support (Strike of Today's Trade!) |
| $65.00 | -0.30 | -13.2% |
| $62.50 | -0.55 | -16.5% |
Net GEX Bias: Bullish - Total Call GEX of 24.54 vs Put GEX of 6.90 indicates dealers are net long gamma, which tends to dampen volatility and create sticky price action around current levels.
Implied Move Analysis
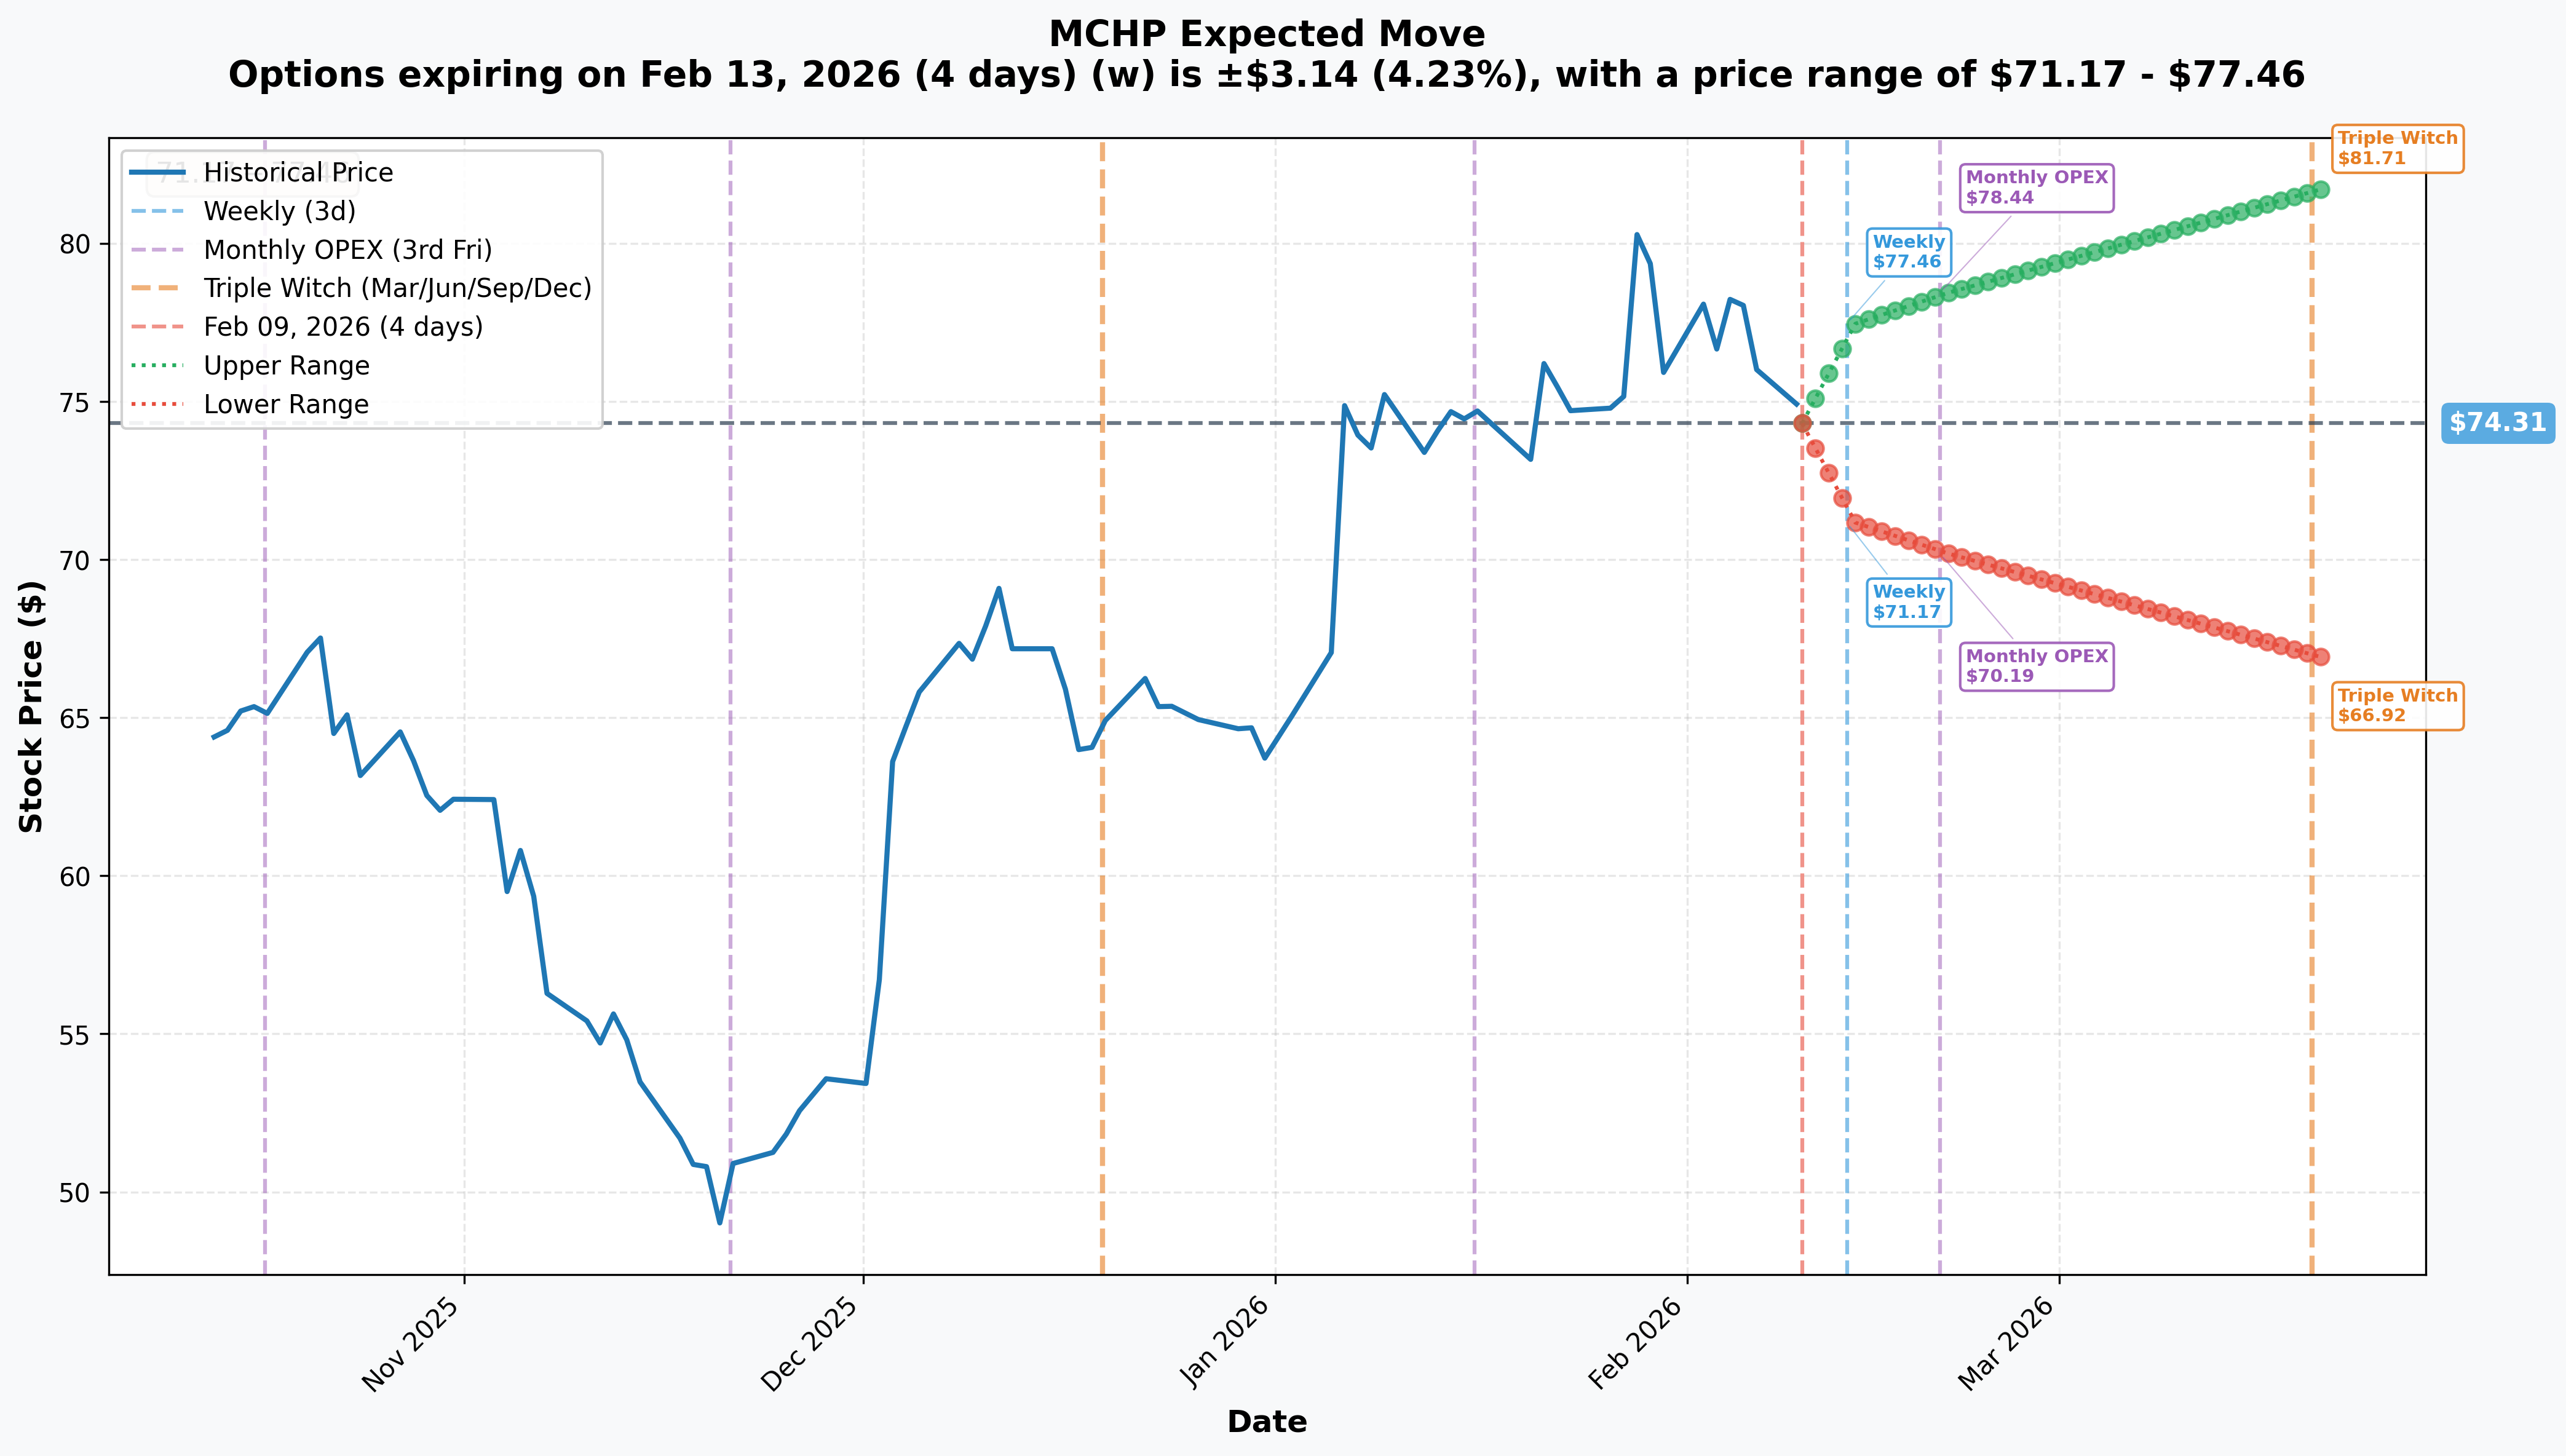
The options market is pricing in the following expected moves:
| Timeframe | Expiry | Days | Implied Move | Expected Range |
|---|---|---|---|---|
| Weekly | Feb 13, 2026 | 4 | ±4.23% | $71.17 - $77.46 |
| Monthly OPEX | Feb 20, 2026 | 11 | ±5.55% | $70.19 - $78.44 |
| Triple Witch | Mar 20, 2026 | 39 | ±9.95% | $66.92 - $81.71 |
Translation: The market expects MCHP to trade between $66.92 and $81.71 by the March quarterly expiration - and today's whale is betting on the upper end of that range!
🎪 Catalysts
✅ Recent Catalysts (Already Happened)
Q3 FY2026 Earnings Beat (February 5, 2026):
- Revenue: $1.186B (+15.6% YoY) - First YoY growth since Q2 FY2024
- Non-GAAP EPS: $0.44 vs $0.42 consensus - +4.76% beat
- Gross margin expanded +379 bps QoQ
- CEO Steve Sanghi called 2026 a year of "confidence and opportunity"
Analyst Upgrades Post-Earnings:
- JP Morgan raised PT to $95 (Feb 6)
- Cantor Fitzgerald raised PT to $100 (Feb 2) - Highest on the Street!
- Needham raised PT to $84 on improving demand
Product Launches (January 2026):
- Industry's first 3nm PCIe Gen 6 switch for AI infrastructure
- Custom firmware for NVIDIA DGX Spark personal AI supercomputers
📅 Upcoming Catalysts
Q4 FY2026 Earnings (Expected May 2026):
- Guidance: Revenue $1.24B - $1.28B (+29.8% YoY at midpoint)
- EPS Guidance: $0.48 - $0.52
- Gross margin expected to expand further
Industry Tailwinds (2026):
- Automotive semiconductor growth estimated at 16.5% YoY
- Data center/AI infrastructure ramp with PCIe Gen 6
- Industrial recovery as inventory destocking completes
Dividend: $0.455/quarter (2.43% yield)
🎲 Price Targets & Probabilities
Based on gamma levels, implied move data, and catalyst timeline:
🐻 Bear Case: $67.50 (-9.2%)
- Probability: 20%
- Scenario: Broader semiconductor weakness, China trade tensions escalate, or macro deterioration
- This is the $67.50 strike level - coincidentally where today's whale positioned their calls
- Major put gamma support provides a floor here
⚖️ Base Case: $78.00 - $80.00 (+5% to +7.7%)
- Probability: 55%
- Scenario: Continued recovery momentum, Q4 guidance reaffirmed, steady institutional accumulation
- $80 represents major call gamma resistance
- Aligns with consensus PT of $79.04
🚀 Bull Case: $85.00 - $95.00 (+14% to +28%)
- Probability: 25%
- Scenario: Q4 beat-and-raise, automotive/industrial recovery accelerates faster than expected
- $85 is upper gamma resistance
- JP Morgan's $95 PT and Cantor's $100 PT suggest institutional targets
💡 Trading Ideas
🛡️ Conservative: "The Sleep Well Strategy"
Trade: Buy MCHP shares + Sell covered call
- Buy 100 shares @ $74.28 = $7,428
- Sell March 20 $80 Call @ ~$2.00 = $200 credit
- Net Cost Basis: $72.28
Why This Works:
- You participate in upside to $80 (7.7% gain)
- Premium collected provides 2.7% downside buffer
- If called away, total return = 10.7% in 39 days
- If stock stays flat, keep premium and repeat
Max Profit: $970 (13.4%) if stock hits $80 by March 20 Max Risk: Stock declines significantly (but you own a quality semiconductor name)
⚖️ Balanced: "The Momentum Play"
Trade: April 2026 $75/$85 Call Spread
- Buy April 17 $75 Call @ ~$5.50
- Sell April 17 $85 Call @ ~$2.00
- Net Debit: $3.50 ($350 per spread)
Why This Works:
- Captures the move toward analyst price targets
- Defined risk - max loss is the $350 premium
- Breakeven at $78.50 (5.7% from current)
- Targets the $85 upper gamma level
Max Profit: $650 (186% return) if MCHP hits $85+ Max Risk: $350 (premium paid) Probability of Profit: ~45%
🚀 Aggressive: "Following the Whale"
Trade: June 2026 $75 Calls (similar to whale's positioning but OTM)
- Buy June 18 $75 Call @ ~$7.50
- Cost: $750 per contract
Why This Works:
- Mirrors institutional conviction on June timeframe
- Slightly OTM gives better leverage than the whale's ITM trade
- Q4 earnings (May) could provide catalyst before expiration
- Breakeven at $82.50 (11% from current)
Max Profit: Unlimited Max Risk: $750 (premium paid) Probability of Profit: ~40%
For the True Degen: The whale bought the $67.50 strike @ $12.35. If you want to exactly follow their trade, you're paying a lot for intrinsic value but getting high delta exposure (~0.85).
⚠️ Risk Factors
📉 What Could Go Wrong
🔴 Insider Selling: CEO Steve Sanghi sold $7.96M worth of shares on January 28 - though this may be routine 10b5-1 plan execution
🔴 Rally Already Priced In: Stock is up 52%+ since November - some upside may be exhausted
🔴 Margin Headwinds: Still carrying $51.7M in underutilization charges and $58.4M in inventory reserves
🔴 China Competition: State-subsidized Chinese chipmakers gaining share in mature MCU segments
🔴 Trade/Tariff Risk: Potential tariff escalation could impact semiconductor supply chains
🔴 Macro Sensitivity: Industrial and automotive demand tied to economic cycles
🔴 No Buybacks: Debt reduction focus means no near-term share repurchases
🎯 The Bottom Line
Real talk: This $9.3M call purchase is smart money voting with their wallets that MCHP's semiconductor recovery story has legs. They're not gambling on a moonshot - they bought deep ITM calls, essentially a leveraged stock position with 4+ months of runway. The timing (4 days post-earnings beat) and structure (high delta exposure) suggests conviction in continued upside.
📋 Action Plan
If You're Bullish (Own It):
- Consider adding on pullbacks to $72.50 gamma support
- Use the balanced call spread strategy to capture upside with defined risk
- Mark your calendar for Q4 earnings in May
If You're Watching:
- Wait for a test of $72.50 support before establishing new positions
- Monitor whether the stock can break above $75 resistance and hold
- Watch for follow-through volume confirming institutional interest
If You're Bearish:
- Respect the gamma positioning - heavy call GEX makes sharp drops difficult
- The $67.50 strike has massive open interest creating a floor
- Semiconductor cycles can be violent - but this one just turned
📝 Key Dates to Watch:
- 📅 Feb 13: Weekly options expiration
- 📅 Feb 20: Monthly OPEX
- 📅 Mar 20: Triple Witch quarterly expiration
- 📅 May 2026: Q4 FY2026 earnings
Bottom Line: When a whale drops $9.3M on calls 4 days after an earnings beat that marks the end of a 2-year downcycle, you pay attention. This isn't speculation - it's follow-through conviction on a recovery that's just getting started. The semiconductor cycle is turning, and big money is positioning for it. 🎯
Disclaimer: This analysis is for informational purposes only and does not constitute investment advice. Options trading involves substantial risk and is not appropriate for all investors. Past performance does not guarantee future results. Always conduct your own due diligence before making any investment decisions.