🎯 META: $151M in Year-End Options Activity Signals Major Positioning Ahead of Q4 Earnings!
📅 December 31, 2025 | 🔥 Unusual Activity Detected
🎯 The Quick Take
Someone just deployed $151 MILLION in META options on the final trading day of 2025! This isn't retail traders closing out the year - we're seeing sophisticated multi-leg strategies centered around the January 16 expiration, with heavy activity at $730-800 put strikes and a massive $23M call purchase at the $600 strike for February. Translation: Big money is making calculated bets ahead of Q4 earnings, and they're hedging hard.
💼 Company Overview
Meta Platforms, Inc. (META)
- Market Cap: $1.68 trillion
- Sector: Computer Programming and Data Processing
- Current Price: $659.68 (as of December 31, 2025)
Meta operates the world's largest social media ecosystem including Facebook, Instagram, Messenger, and WhatsApp. The company generates revenue by leveraging its massive user data (3.54 billion daily active users) to sell highly targeted digital advertising. While Reality Labs continues to burn cash on VR/AR initiatives, Meta's core advertising business powered by AI optimization remains a dominant force in digital marketing.
💰 The Option Flow Breakdown
📊 What Just Happened
Here's the complete tape showing 7 major trades totaling $151M in premium:
| Time | Symbol | Buy/Sell | C/P | Expiration | Strike | Volume | Premium | OI | Size | Spot | Option Price | Option Symbol |
|---|---|---|---|---|---|---|---|---|---|---|---|---|
| 10:32:44 | META | BUY | CALL | 2026-02-20 | $600 | 3,000 | $23.0M | 840 | 3,000 | $662.89 | $76.90 | META20260220C600 |
| 15:10:13 | META | BUY | PUT | 2026-01-16 | $730 | 6,400 | $44.0M | 1,430 | 6,420 | $660.58 | $68.50 | META20260116P730 |
| 15:10:13 | META | SELL | PUT | 2026-01-16 | $740 | 2,800 | $11.0M | 132 | 1,430 | $660.58 | $78.74 | META20260116P740 |
| 15:10:13 | META | SELL | PUT | 2026-01-16 | $760 | 2,600 | $12.0M | 97 | 1,170 | $660.58 | $106.84 | META20260116P760 |
| 15:10:13 | META | SELL | PUT | 2026-01-16 | $750 | 5,100 | $25.0M | 256 | 2,840 | $660.58 | $88.85 | META20260116P750 |
| 15:10:27 | META | BUY | PUT | 2026-01-16 | $800 | 2,600 | $21.0M | 102 | 4,950 | $660.51 | $84.48 | META20260116P800 |
| 15:10:27 | META | SELL | PUT | 2026-01-16 | $765 | 3,400 | $15.0M | 197 | 1,490 | $660.51 | $103.88 | META20260116P765 |
Total Premium: $151M across all trades
🤓 What This Actually Means
Let me break down what these institutional traders are doing:
1. The $23M February Call Purchase (10:32 AM) 🟢
- Trade: Bought 3,000 contracts of Feb 20 $600 calls for $76.90 each
- Translation: Someone spent $23M on deep in-the-money calls expiring 51 days out
- Unusualness: Z-Score of 1.75 (above average activity)
- Strategy Classification: Close Short CALL position
- What it means: This appears to be institutional money closing out a short call position, taking profits after META's run-up, or repositioning ahead of Q4 earnings
2. The $128M January Put Complex (3:10 PM) 🔴 This is where it gets interesting. In a matter of seconds, traders executed a sophisticated multi-leg put strategy:
Bought Protection:
- $44M into Jan 16 $730 puts (Z-Score: 5.41 - EXTREMELY UNUSUAL)
- $21M into Jan 16 $800 puts (Z-Score: 2.86 - highly unusual)
Sold Out-of-Money Puts:
- Sold $11M of $740 puts (Z-Score: 5.83 - extremely unusual)
- Sold $12M of $760 puts (Z-Score: 2.15 - highly unusual)
- Sold $25M of $750 puts (Z-Score: 5.52 - extremely unusual)
- Sold $15M of $765 puts (Z-Score: 2.76 - highly unusual)
Translation: This is a classic put spread complex designed to profit from downside protection while financing the trade through premium collection. The buyer is protecting against a move down to $730-800, but limiting losses below that range.
Key Insight: The concentration around the January 16 expiration (just 16 days out) is critical - this lines up perfectly with META's expected Q4 2025 earnings announcement in late January. Someone is hedging HARD ahead of this event.
📈 Technical Setup
YTD Chart Analysis
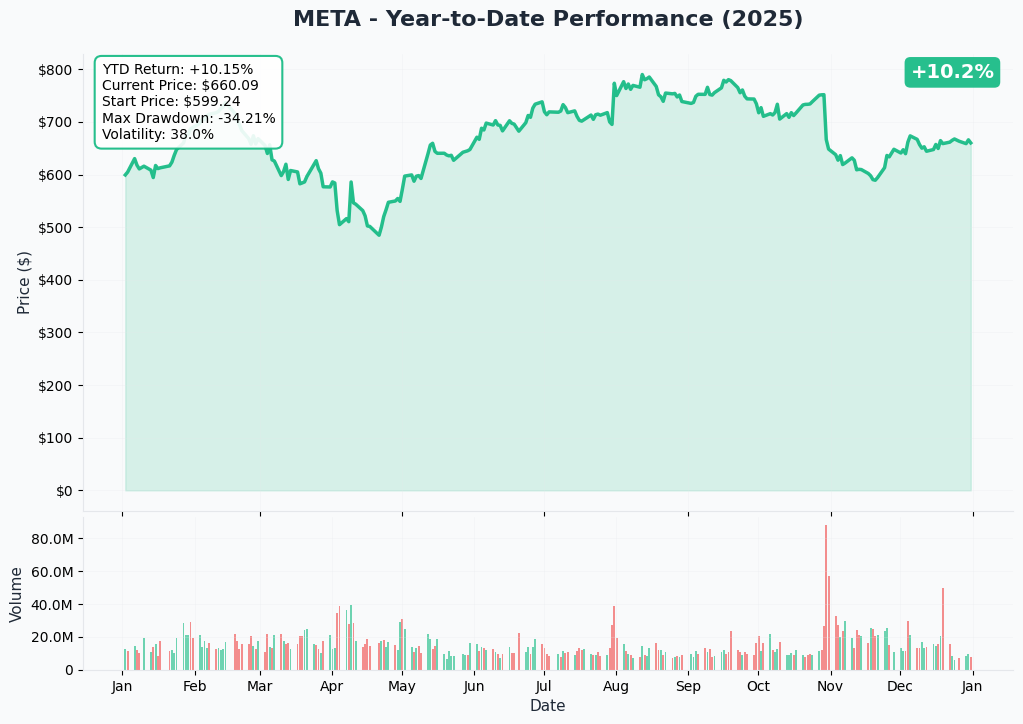
META has delivered a strong performance in 2025, trading near $660 as we close out the year. The stock hit an all-time high of $788.82 back in August 2025 but has pulled back roughly 16% from those levels. The current consolidation around $660 represents a critical decision point:
- 52-Week Range: $479.80 - $796.25
- Current Position: Middle-to-upper portion of the range
- Key Technical Level: The $650-660 zone appears to be acting as near-term support
- Resistance Zone: $700+ remains the next major hurdle based on historical price action
The stock's YTD performance places it among the top performers in the Magnificent 7, despite the August correction. The question now: Will Q4 earnings provide the catalyst to retest $700+, or will concerns about AI CapEx spending push us toward the $600-640 support zone?
Gamma-Based Support & Resistance Analysis
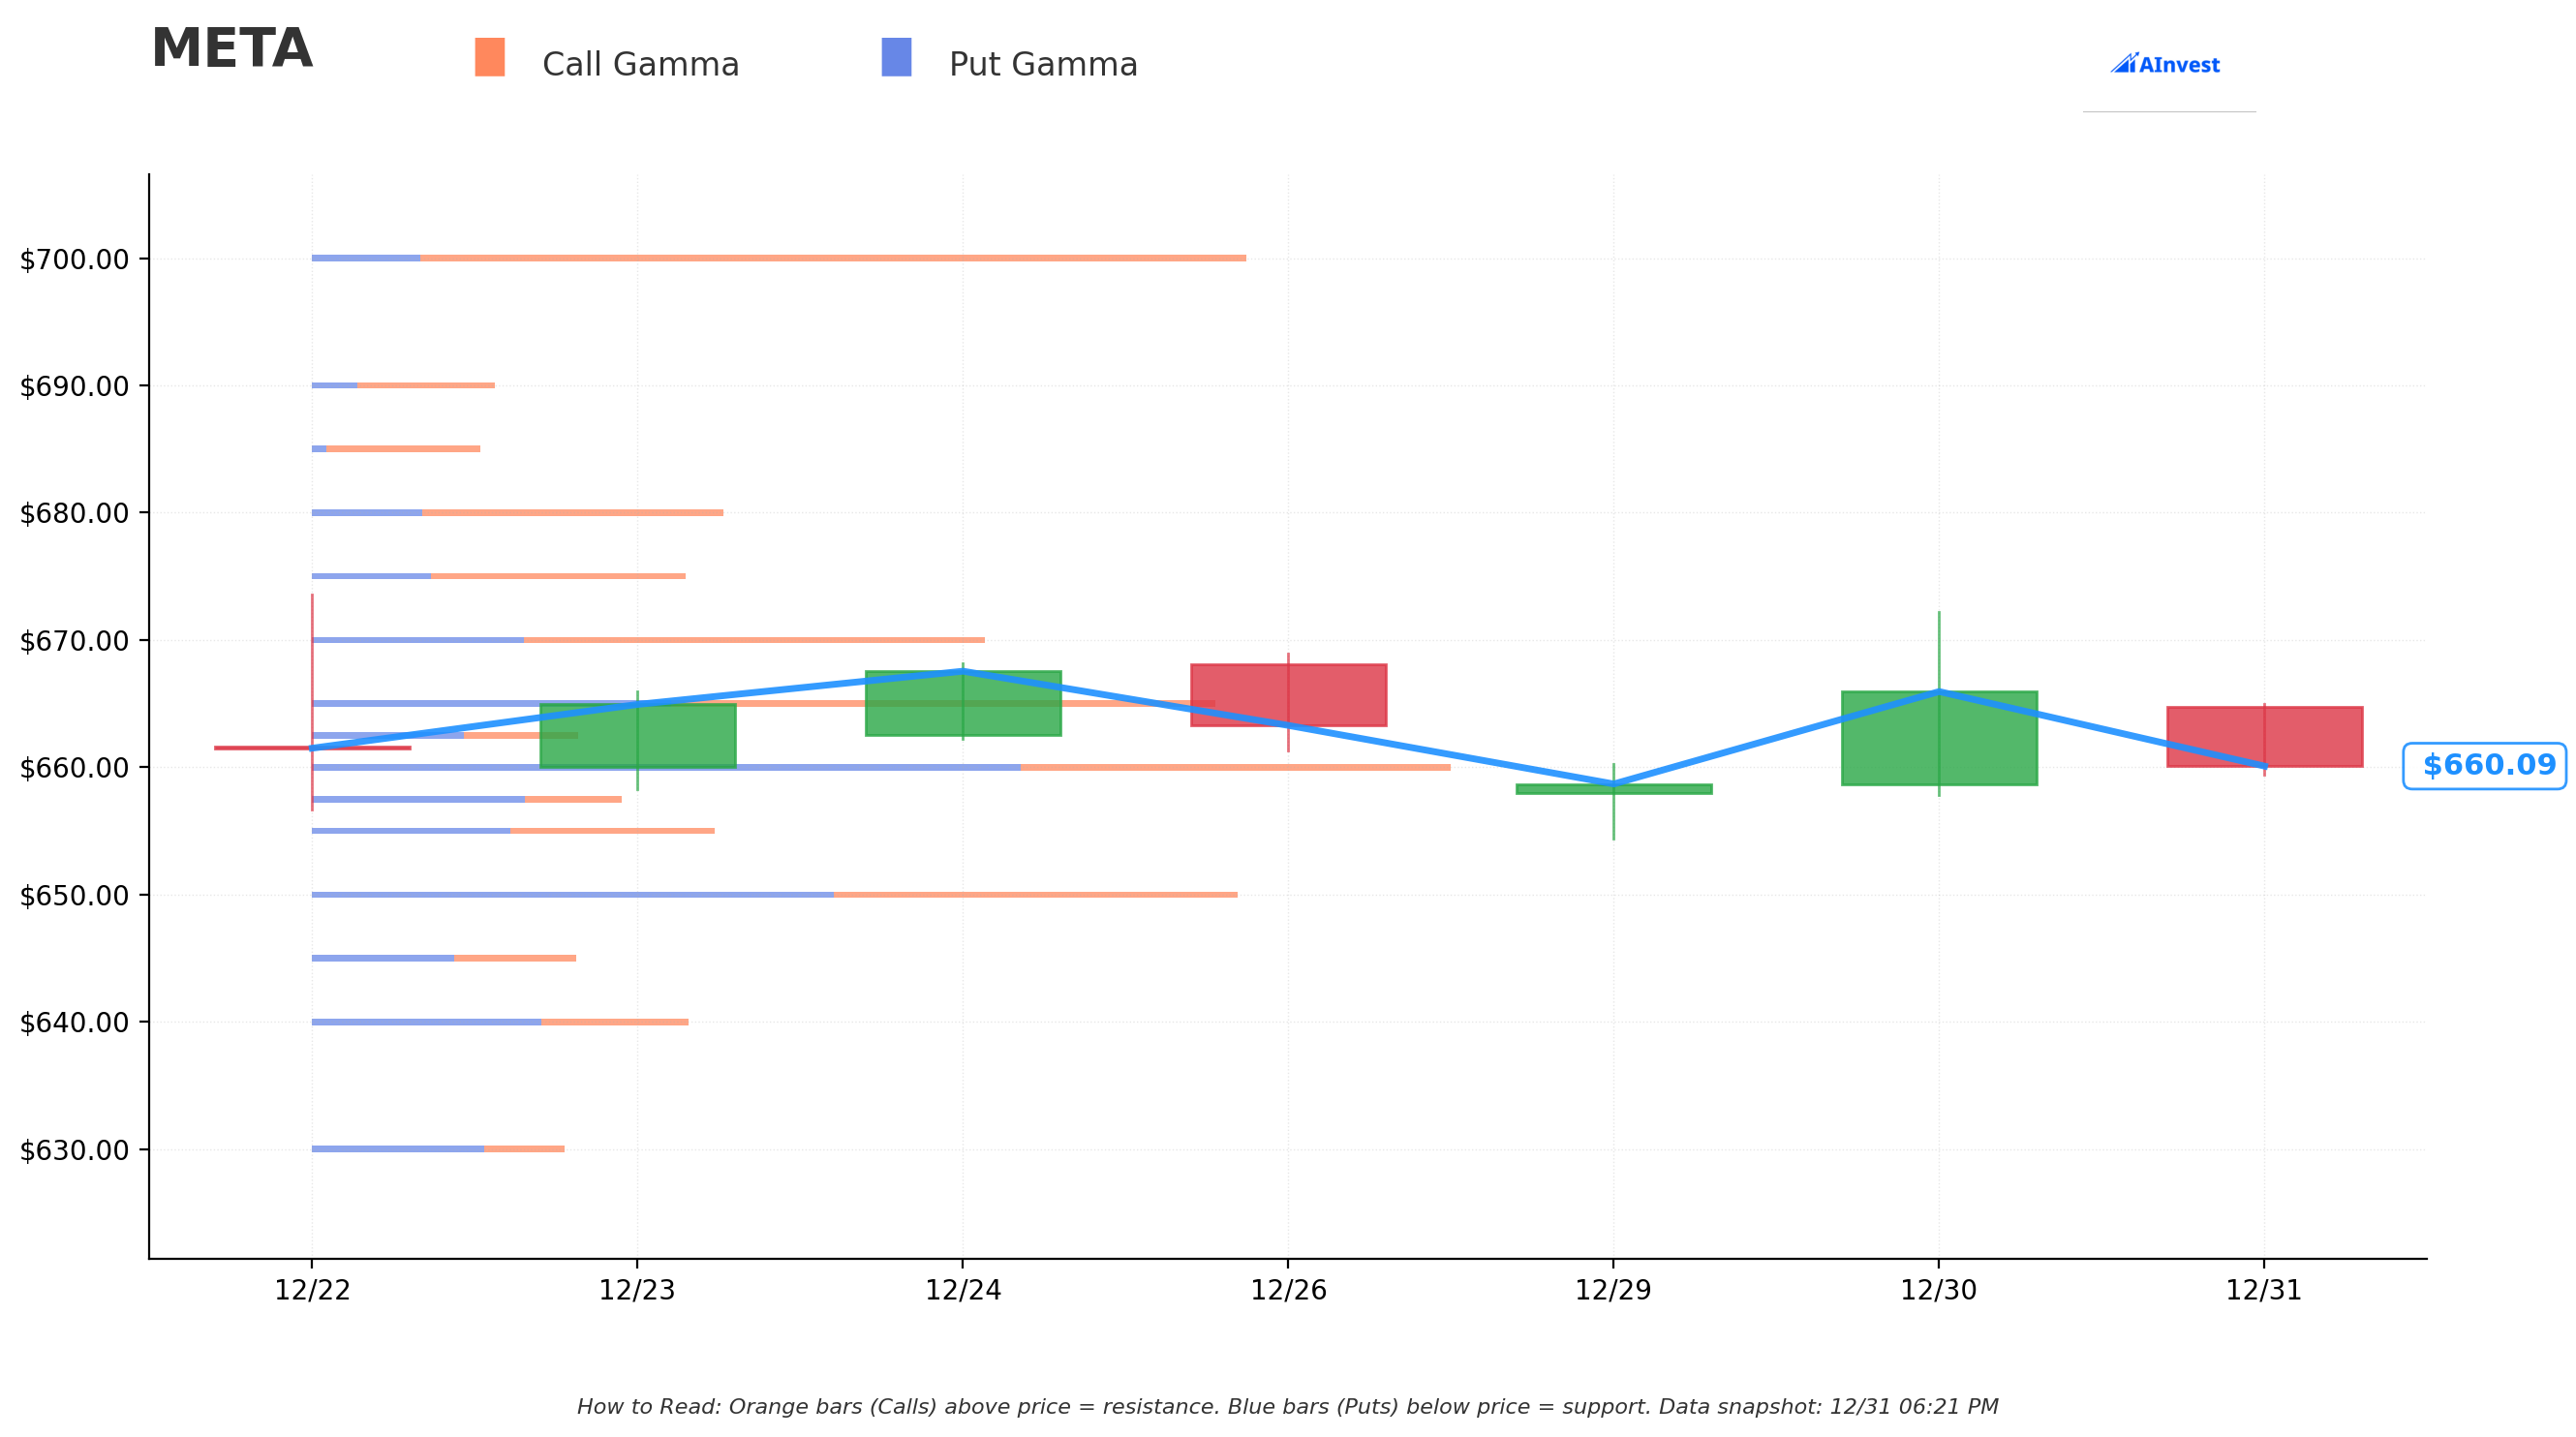
The gamma exposure analysis reveals critical price magnets where options activity is concentrated:
Immediate Support Levels (Blue/Put Gamma):
- $655: Strongest near-term support (17.59M total GEX) - just 0.7% below current price
- $650: Major support zone (40.43M total GEX) - 1.5% below current price
- $640: Secondary support (16.30M total GEX) - 3.0% below current price
- $600: Deep support (17.18M total GEX) - 9.0% below current price - THIS IS WHERE THE $23M CALL WAS BOUGHT
Immediate Resistance Levels (Orange/Call Gamma):
- $660: Strongest immediate resistance (49.60M total GEX) - right at current price
- $665: Near-term ceiling (39.63M total GEX) - 0.8% above current price
- $670: Secondary resistance (29.56M total GEX) - 1.6% above current price
- $675: Additional barrier (16.47M total GEX) - 2.3% above current price
- $680: Psychological resistance (18.01M total GEX) - 3.1% above current price
- $700: Major upside target (40.86M total GEX) - 6.1% above current price
Net GEX Bias: Bullish (281M call GEX vs. 213M put GEX)
What this means: The stock is essentially pinned at the $660 level with massive resistance immediately overhead. Market makers have heavy exposure here, which creates a "price magnet" effect. Breaking above $665-670 could trigger acceleration toward $700, while a failure here likely means a retest of $650-655 support.
Implied Move Analysis
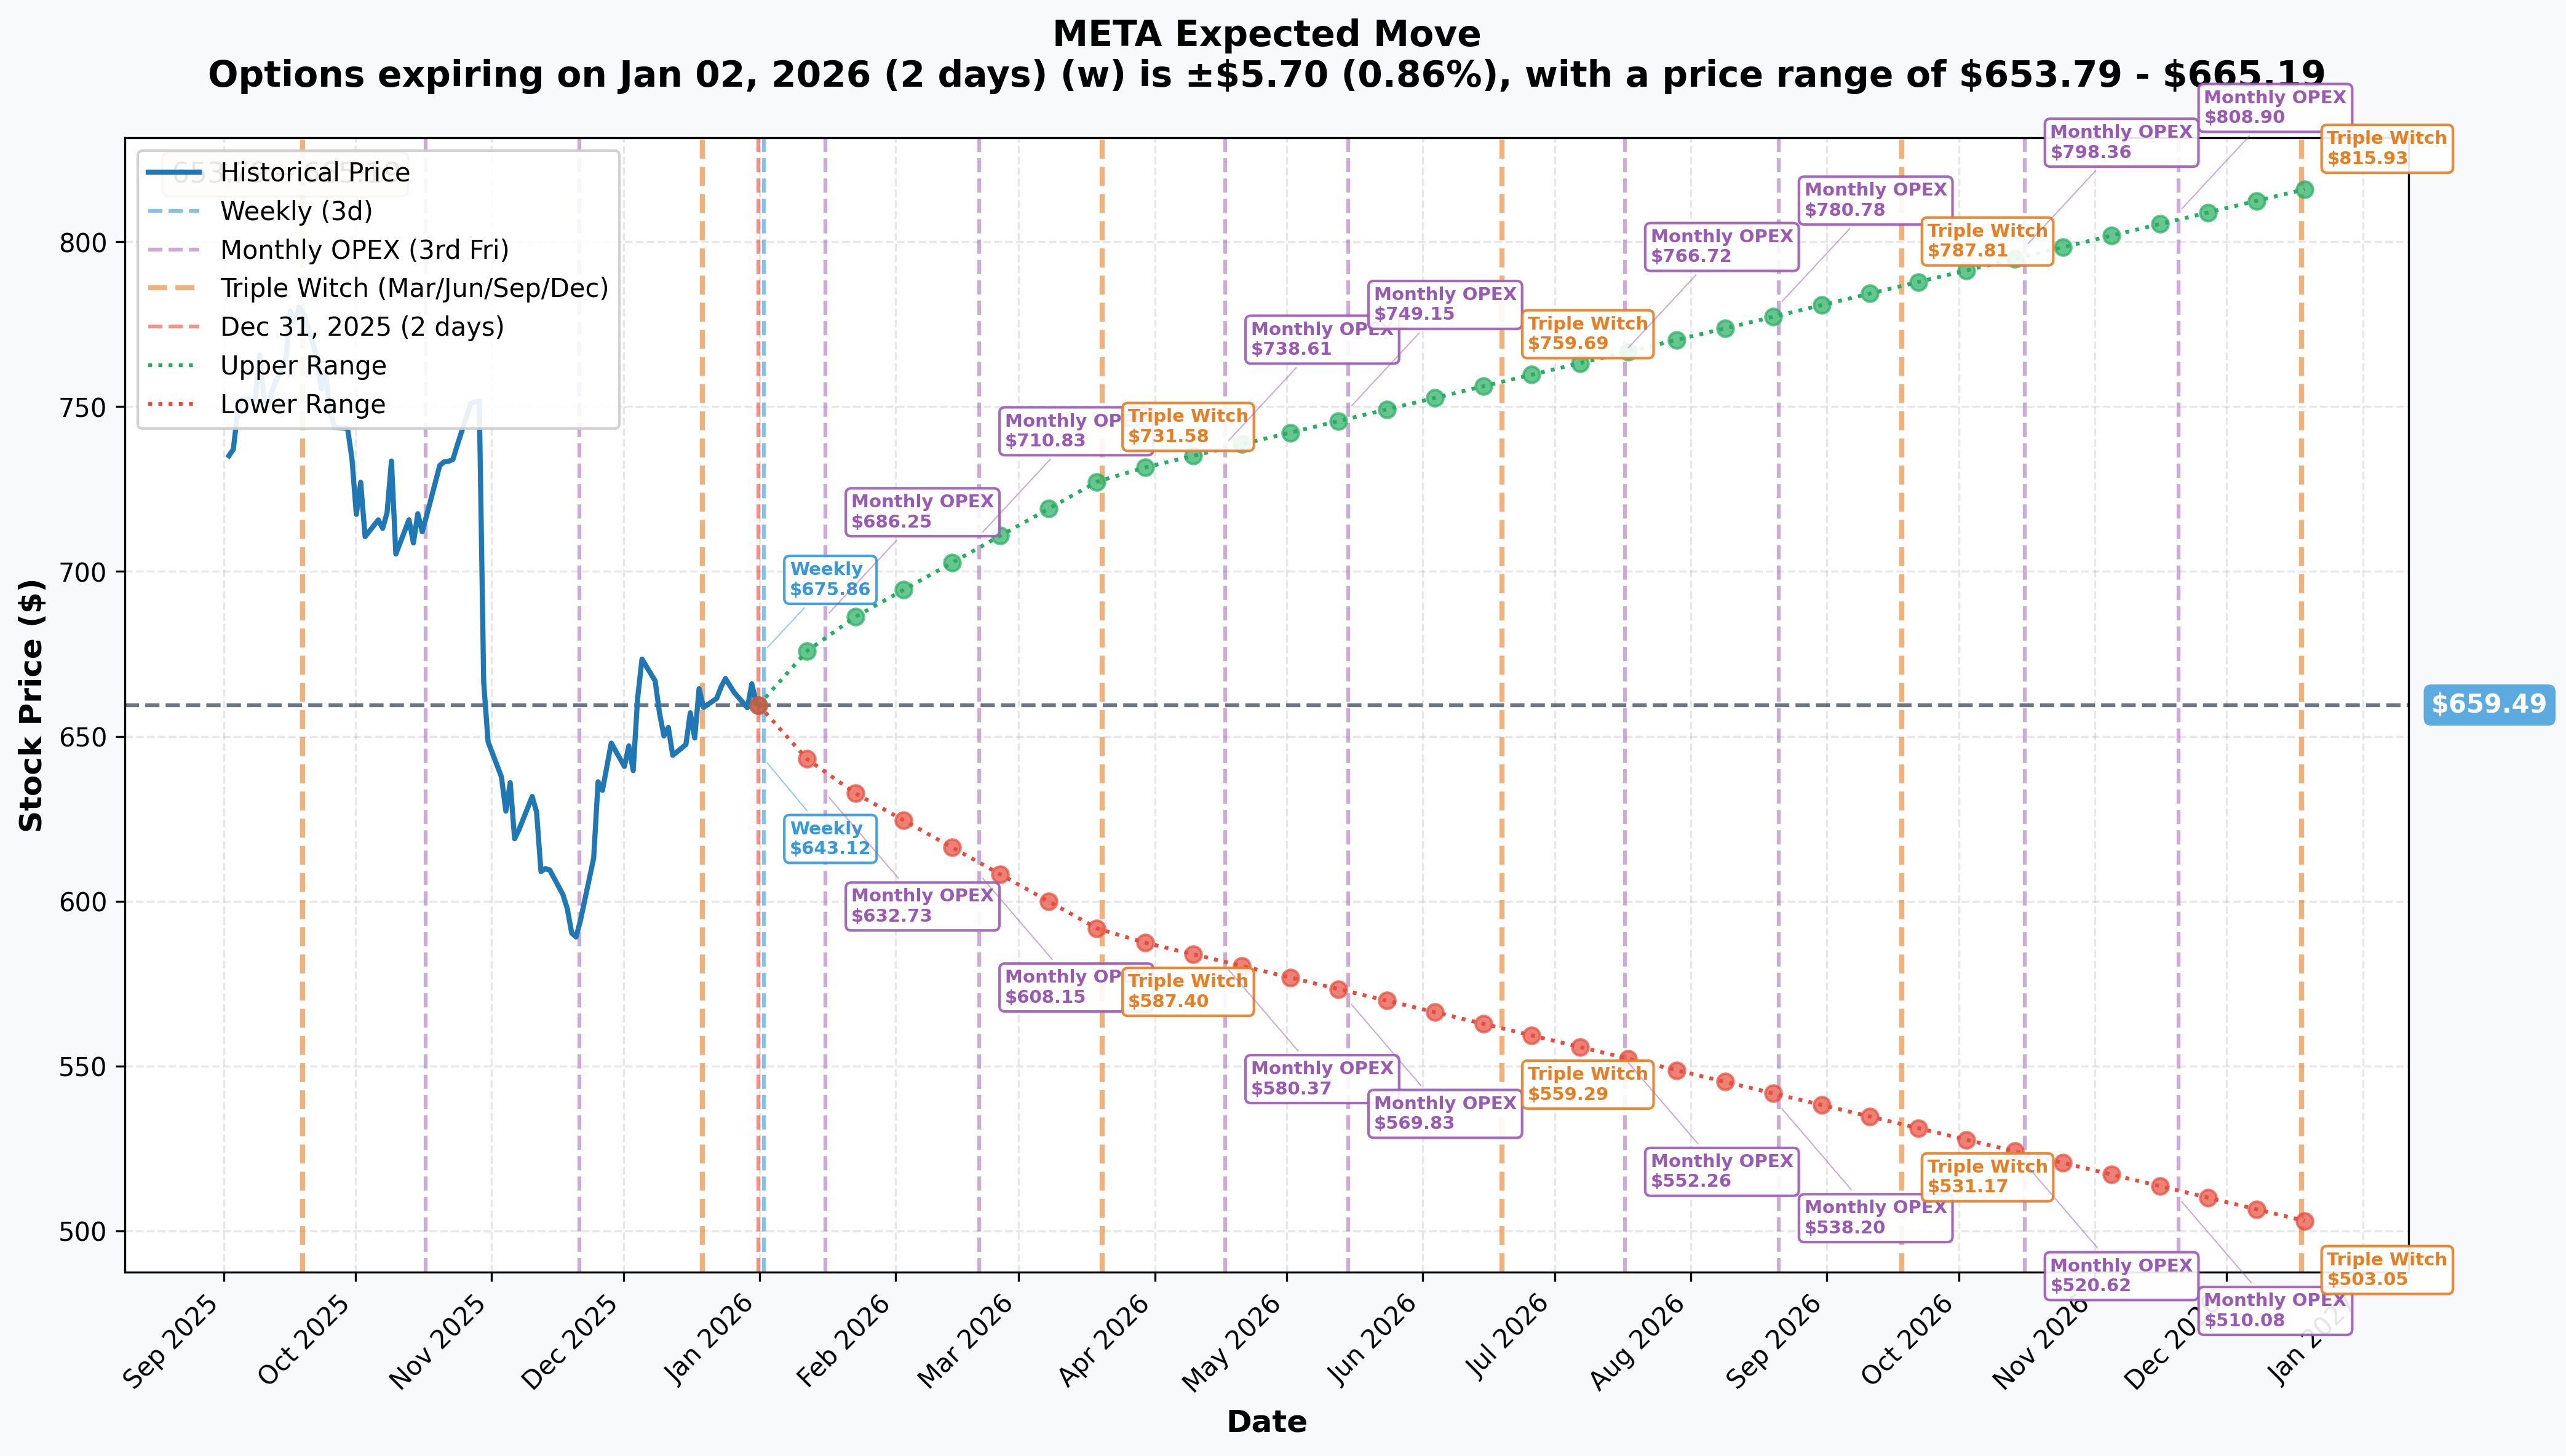
The options market is pricing in specific movement expectations across multiple timeframes:
Near-Term (Weekly - Jan 2, 2026):
- Implied Move: ±$5.70 (±0.86%)
- Expected Range: $653.79 - $665.19
- Analysis: Very tight range for a 2-day period, suggesting the market expects limited movement heading into the new year
Monthly OPEX (Jan 16, 2026):
- Implied Move: ±$22.29 (±3.38%)
- Expected Range: $637.20 - $681.78
- Analysis: THIS is the critical expiration where we saw $128M in put spreads! The market is pricing a potential ±3.4% swing around earnings
Quarterly (March 20, 2026 Triple Witch):
- Implied Move: ±$69.21 (±10.49%)
- Expected Range: $590.28 - $728.70
- Analysis: Wider range reflecting earnings uncertainty and Q1 2026 developments
Yearly LEAPS (Dec 18, 2026):
- Implied Move: ±$156.44 (±23.72%)
- Expected Range: $503.05 - $815.93
- Analysis: 12-month outlook suggests either a retest of all-time highs ($788+) or pullback to $500s
Key Takeaway: The concentration of option activity at the January 16 expiration isn't random - it's precisely when the market expects maximum volatility around Q4 earnings. The ±3.4% implied move ($637-682 range) aligns perfectly with the put spread strikes we saw ($730-800 protection with $740-765 short strikes).
🎪 Catalysts
📅 Upcoming Events (Next 3 Months)
Q4 2025 Earnings Release (Late January 2026) 🔥
- Expected Date: Late January 2026 (likely week of January 26-30)
- Consensus Revenue: $56-59 billion (company guidance from Q3 call)
- Consensus EPS: $8.19
- Why It Matters: This is THE catalyst everyone is positioned for. Meta guided to $56-59B in Q4 revenue (up from $51.24B in Q3). Any miss on revenue or concerning commentary about 2026 CapEx could trigger the downside moves these put buyers are hedging against.
- Key Metrics to Watch:
- Reality Labs quarterly loss (stuck at $4.4B)
- Threads monetization progress ($8B revenue run rate in 2025)
- 2026 CapEx guidance (CFO already warned it will be "notably larger" than 2025's $70-72B)
- Family of Apps ad pricing and impression growth
EU DMA Compliance Rollout (January 2026) ⚖️
- Details: New ad personalization choices for EU users per European Commission commitment announced December 8, 2025
- Options: Users can choose full data sharing OR reduced personalization
- Risk Factor: If significant EU users opt for "less personalized" ads, it could reduce targeting effectiveness and revenue per user
- Timeline: Rolling out January 2026
Avocado AI Model Launch (Expected Q1 2026) 🤖
- Details: Meta's next frontier AI model following Llama 4, per CNBC reporting
- Originally Expected: Late 2025
- Status: Likely slipping to Q1 2026 due to internal development challenges
- Why It Matters: Meta is in an arms race with OpenAI, Anthropic, and Google. Success or failure of Avocado will validate the company's $70B+ annual AI infrastructure spend
📚 Recent Events (Already Happened)
FTC Antitrust Trial Victory (November 18, 2025) ✅
- Outcome: U.S. District Judge ruled in Meta's favor, rejecting FTC attempt to force divestiture of Instagram and WhatsApp per NPR coverage
- Impact: Removed major structural risk; Meta retains integrated platform
- Status: FTC reviewing appeal options but ruling removes significant overhang
Q3 2025 Earnings Beat (October 29, 2025) ✅
- Results: Revenue of $51.24B (+26% YoY), EPS $7.25 (beat by 9.68%) per Meta investor relations
- Family DAP: 3.54 billion daily active people (+8% YoY)
- Key Highlight: AI-powered ads delivering 22% higher ROAS
- Concern: Operating margin declined 270 bps to 40.1% due to elevated infrastructure costs
Instagram 3B MAU Milestone (September 2025) ✅
- Achievement: Crossed 3 billion monthly active users per CNBC report
- First disclosure since October 2022 (previously 2B MAU)
- Engagement: Video time up 30%+ YoY, benefiting from Reels
Meta Connect 2025 Product Launches (September 17-18, 2025) ✅
- Ray-Ban Display Smart Glasses: $799, first display-equipped model with 600x600 resolution
- Strategic Shift: Meta confirmed "shifting some of our investment from Metaverse toward AI glasses and Wearables" per UploadVR coverage
Llama 4 Release (April 2025) ✅
- Models: Scout (17B active/109B total), Maverick (17B/400B), Behemoth (288B/~2T)
- Innovation: First Meta models using Mixture of Experts architecture with native multimodality per Meta AI blog
- Deployment: Even deployed to International Space Station (Space Llama)
EU DMA Fine (April 2025) ⚠️
- Amount: EUR 200 million for "Consent or Pay" model violations
- Context: First DMA penalty alongside Apple's EUR 500M fine
- Resolution: Led to December commitment for new ad personalization choices
🎲 Price Targets & Probabilities
Using Gamma Levels and Implied Move for Price Targets
Based on the gamma exposure analysis and implied volatility structure, here are the key price zones to watch:
🐂 Bull Case: $700-728 (6-10% upside)
- Gamma Target: $700 strike has massive 40.86M total GEX - this acts as a major magnet above current levels
- Implied Move Target: March quarterly expiration suggests $728.70 upper range
- Catalyst: Strong Q4 earnings beat, positive 2026 guidance, Avocado AI success
- Probability: ~30-35% based on January monthly implied move
- Path: Must first break through $665-670 resistance cluster (69M combined GEX), then clear $680 psychological level
⚖️ Base Case: $640-670 (neutral to +1.5%)
- Gamma Equilibrium: Stock currently pinned between $655 support (17.59M GEX) and $660-665 resistance (89M combined GEX)
- Implied Move Range: January monthly $637-682 bracket captures this zone
- Catalyst: In-line Q4 results with mixed 2026 outlook, Reality Labs losses persist
- Probability: ~40-45% based on current gamma profile
- Key Level: $650 acts as critical support with 40.43M total GEX
🐻 Bear Case: $600-640 (-3% to -9% downside)
- Gamma Support: $640 (16.30M GEX) and $600 (17.18M GEX) are the major catch points
- Implied Move Floor: January monthly suggests $637 lower bound, March suggests $590
- Catalyst: Q4 miss, excessive 2026 CapEx guidance, EU DMA revenue impact, Reality Labs concerns
- Probability: ~25-30% (note: this is what the $128M put spread complex is hedging!)
- Critical: The put spread buyers are specifically protecting the $730-800 zone, but that seems overly bearish given gamma support at $640-655
🔥 The Smart Money Tells Us:
The $23M February $600 call purchase suggests someone believes $600 is the absolute floor - they're comfortable owning deep ITM calls at that strike. Meanwhile, the $128M in January put spreads suggests professional hedging against an earnings miss that could push us to $640-730 range, but they're not expecting a catastrophic drop (hence selling puts at $740-765).
My Assessment: The most likely scenario is chop in the $650-670 range until earnings, then a decisive break. The gamma pin at $660 is real, and it will take a major catalyst to escape this zone. Bulls need to see $670+ to unlock momentum toward $700. Bears need a breakdown below $650 to activate the next leg to $640 and potentially $600.
💡 Trading Ideas
🛡️ Conservative: Wait for Post-Earnings Clarity
Strategy: Sit in cash or minimal position until Q4 earnings clarity
Rationale: With $151M in complex positioning just executed and earnings 3-4 weeks away, the risk/reward of new positions is poor. The gamma pin at $660 suggests limited movement until a catalyst breaks the range.
If you MUST trade:
- Sell January 16 $640/$730 iron condor to collect premium from range-bound action
- Max risk if stock moves outside $640-730 (which the smart money is hedging!)
- Target: $3-5 credit per spread, collect time decay while stock is pinned
Position Size: Max 2-3% of portfolio Exit Plan: Close at 50% profit or roll if threatened pre-earnings
⚖️ Balanced: Bull Put Spread with Gamma Support
Strategy: January 16 $650/$640 Bull Put Spread
Structure:
- Sell January 16 $650 put (at major gamma support - 40.43M GEX)
- Buy January 16 $640 put (secondary support - 16.30M GEX)
- Net Credit: ~$4.00-5.00 per spread
- Max Profit: $400-500 per spread (keep entire credit if META above $650 at expiry)
- Max Loss: $500-600 per spread (if META below $640)
- Breakeven: ~$645-646
Rationale:
- The gamma data shows $650 is THE major support level (40.43M total GEX)
- January implied move suggests $637 floor, giving us cushion
- Even in a modest earnings pullback, $650 should hold based on gamma support
- Risk is defined and limited to width of spread
Position Size: 5-10% of portfolio (limit to 10-15 spreads max) Timing: Enter 1-2 weeks before earnings Exit: Close at 70% profit or hold to expiration if confident
🚀 Aggressive: Directional Earnings Straddle
Strategy: Long January 16 $660 Straddle
Structure:
- Buy January 16 $660 call + $660 put
- Total Cost: ~$50-55 ($25-28 per side)
- Max Profit: Unlimited
- Max Loss: $5,000-5,500 per straddle
- Breakeven: $605 or $715 (±8.3% move needed)
Rationale:
- The implied move for January is 3.38% (±$22), but historical META earnings moves have been larger
- Q3 earnings drove a significant reaction, Q4 has multiple wildcards (2026 CapEx guidance, EU DMA impact)
- The $128M in put spread activity suggests big money expects volatility
- If META beats and guides well, target is $700+; if it misses, $640-650 support gets tested quickly
For the YOLO Version:
- Buy February 20 $700 calls (60 DTE, ride momentum if earnings beats)
- Buy January 16 $640 puts (earnings protection play if guidance disappoints)
Position Size: Max 3-5% of portfolio Risk Management: Cut losses at 50% if wrong on earnings direction Profit Target: 100%+ on the winning side of the straddle
⚠️ Risk Factors
What Could Go Wrong
1. CapEx Guidance Shock 💸
- Meta already guided to $70-72B in 2025 CapEx, CFO warned 2026 will be "notably larger"
- If Meta announces $90B+ for 2026, market may question ROI on AI infrastructure
- Reality Labs continues burning $4.4B/quarter with no clear path to profitability
- Hyperscaler CapEx approaching $600B in 2026 industry-wide - sustainability concerns
2. EU DMA Revenue Impact 🇪🇺
- New ad personalization choices roll out in January
- If material % of EU users opt for "less personalized" ads, ARPU could decline
- EU represents significant revenue base for Meta's advertising business
- Additional DMA penalties possible if implementation deemed insufficient (first fine was EUR 200M)
3. Earnings Miss or Weak Guidance 📉
- Consensus expects $56-59B revenue (vs. $51.24B in Q3)
- Any miss on revenue or EPS could trigger the downside puts traders are holding
- Key risks: Ad pricing pressure, Reality Labs losses expanding, Threads monetization slower than expected
- Operating margin already compressed 270 bps in Q3 due to costs
4. TikTok Competitive Pressure 📱
- Zuckerberg testified TikTok caused META growth to slow "dramatically"
- Teen demographic preference: TikTok 63% vs. Instagram 61%
- Meta's strategy relies on copying (Reels, Threads) rather than innovating
- Any new social platform could disrupt user engagement and ad pricing
5. AI Development Delays 🤖
- Avocado frontier AI model delayed from late 2025 to Q1 2026
- Competition from OpenAI, Anthropic, Google, and emerging players like DeepSeek
- Open-source Llama strategy may not capture enterprise value vs. closed models
- Internal confusion around AI strategy per CNBC reporting
6. Regulatory Wildcards ⚖️
- FTC may appeal November 2025 antitrust ruling
- Youth safety lawsuits with trials in 2026
- Potential new antitrust actions under incoming administration
- International data privacy challenges (Italy targeting WhatsApp AI)
7. Macro Headwinds 🌍
- Digital advertising highly sensitive to economic conditions
- High interest rates impact advertising budgets
- Currency headwinds (Q3 constant currency revenue was +25% vs. +26% reported)
- Market rotation away from mega-cap tech if AI narrative cools
8. Technical Breakdown 📊
- Failure to hold $650 gamma support could trigger cascade to $640, then $600
- Stock down ~16% from August all-time high of $788
- Gamma pin at $660 could work both ways - limits upside if can't break resistance
- VIX spike around earnings could hurt long premium positions
🎯 The Bottom Line
Real talk: $151M doesn't get deployed on the last trading day of the year without conviction. The structure of these trades tells us everything we need to know about what smart money is thinking.
The Bull/Bear Battle:
Bulls Have:
- Gamma support at $650-655 is substantial (40M+ GEX)
- Net gamma bias is bullish (281M calls vs. 213M puts)
- Q3 delivered a beat with 26% revenue growth and AI ads showing 22% higher ROAS
- FTC antitrust victory removed existential risk
- 3.54B daily active users across family of apps = unmatched scale
- Analyst consensus of $819-829 price target suggests 24%+ upside
Bears Have:
- $128M in sophisticated put spreads protecting against $730-800 downside
- Massive gamma resistance overhead at $660-665-670 (110M+ combined GEX)
- Reality Labs burning $4.4B quarterly with no end in sight
- "Notably larger" 2026 CapEx guidance could spook market on ROI concerns
- EU DMA implementation risk in January
- Stock pinned below major $700 resistance level
- Down 16% from August highs despite "good news"
What to Watch:
-
January 16 Expiration: This is ground zero. The concentration of $128M in put spreads around this date isn't coincidence - it's when Q4 earnings hit.
-
$650 Level: If META breaks below this gamma support, the $600-640 zone comes into play fast. The $23M call buyer at $600 thinks that's the floor.
-
Earnings Guidance: Not just Q4 results, but 2026 CapEx, Reality Labs trajectory, and EU DMA impact commentary will determine if we break toward $700+ or retest $640.
Action Plan:
-
If you own META: Consider trimming 20-30% ahead of earnings and setting a stop at $648 (just below gamma support). The risk/reward of holding through earnings with this much uncertainty is poor unless you have 12+ month time horizon.
-
If you're watching: Wait for the $670+ breakout with volume to go long, OR wait for $648 breakdown to get short/buy puts. Don't fight the $660 gamma pin.
-
If you're an options trader: The post-earnings volatility crush will be real. If you're buying premium, size accordingly. If you're selling, the $650/$640 bull put spread offers defined risk with gamma support.
Mark your calendar: Q4 earnings (likely January 26-30 week) will determine if META revisits $700+ or tests the $600-640 support zone. Until then, expect chop in the $650-670 range as gamma keeps the stock pinned.
Bottom Line: This is a WAIT-AND-SEE setup. The smart money is hedged, positioned, and patient. You should be too. Let earnings provide clarity, then act decisively. The $700+ breakout or $640 breakdown will be obvious when it happens.
Disclaimer: This analysis is for educational purposes only and does not constitute financial advice. Options trading involves substantial risk and is not suitable for all investors. The trades discussed involve complex multi-leg strategies that can result in significant losses. Past performance does not guarantee future results. Always consult with a qualified financial advisor before making investment decisions, and never risk more than you can afford to lose.
Analysis Date: December 31, 2025 Data Sources: Option trade data, gamma exposure analysis, implied volatility calculations, public company filings, and market research