🔥 META $5.7M Call Bet Ahead of Q4 Earnings - Someone's Loading Up Before the Big Print!
📅 January 27, 2026 | 🔥 Unusual Activity Detected
🎯 The Quick Take
Someone just dropped $5.7 MILLION on META $700 calls expiring February 27th - buying 2,598 contracts at $22.00 per contract while the stock trades at $672.48. That's a bold bet that META rallies 4.1% above its current price within 31 days, and it landed the morning before tomorrow's Q4 2025 earnings report. With a Z-score of 17.54 (classified as EXTREMELY UNUSUAL - this kind of size shows up maybe a few times a year), this is clearly institutional money positioning for a big post-earnings move higher.
📊 Company Overview
Meta Platforms (META) is the largest social media company in the world, with close to 4 billion monthly active users across Facebook, Instagram, Messenger, and WhatsApp. The company generates the bulk of its revenue through targeted digital advertising powered by user data and AI.
- 💰 Market Cap: $1.69 Trillion
- 🏢 Sector: Services - Computer Programming, Data Processing
- 📈 Current Price: $672.48
- 📊 P/E (TTM): 22.97 | EPS (TTM): $29.07
- 🎯 52-Week Range: $479.80 - $796.25
- 💵 Dividend Yield: 0.31% ($2.10/year)
💰 The Option Flow Breakdown
The Tape (January 27, 2026 @ 09:33:59):
| Time | Symbol | Side | Buy/Sell | Type | Expiration | Premium | Strike | Volume | OI | Size | Spot | Option Price |
|---|---|---|---|---|---|---|---|---|---|---|---|---|
| 09:33:59 | META | ASK | BUY | CALL | 2026-02-27 | $5.7M | $700 | 3K | 974 | 2,598 | $672.48 | $22 |
🤓 What This Actually Means
This is a straight-up bullish bet - a Long Call / Buy-to-Open (BTO) position. Here's the breakdown:
- 💸 Premium paid: $5.7M ($22.00 per contract x 2,598 contracts)
- 🎯 Strike price: $700 - that's 4.1% above the current price, making this an out-of-the-money bet
- ⏰ Timing: Placed the morning BEFORE tomorrow's Q4 earnings - this trader is positioning for a post-earnings ramp
- 📊 Volume vs OI: Volume of 3,000 vs open interest of only 974 - volume is 3.08x the existing open interest, confirming this is fresh positioning (HIGH ACTIVITY)
- 🔥 Z-Score: 17.54 (EXTREMELY UNUSUAL) - This kind of concentrated call buying shows up only a handful of times per year
- 🏦 Confidence: MEDIUM - the trade is directionally aggressive but the February 27th expiry gives 31 days for the thesis to play out
What's really happening here: This trader is betting that META's Q4 2025 earnings report tomorrow (January 28) will be strong enough to push the stock above $700. At $22.00 per contract, their breakeven is $722 by expiration - meaning they need a 7.4% rally from current levels. That's aggressive, but considering the options market is pricing in a 5.76% weekly move and META has a history of 8-12% post-earnings swings, it's not crazy. They likely expect a positive reaction to earnings AND guidance that sustains momentum through February.
📈 Technical Setup / Chart Check-Up
1-Year Performance Chart
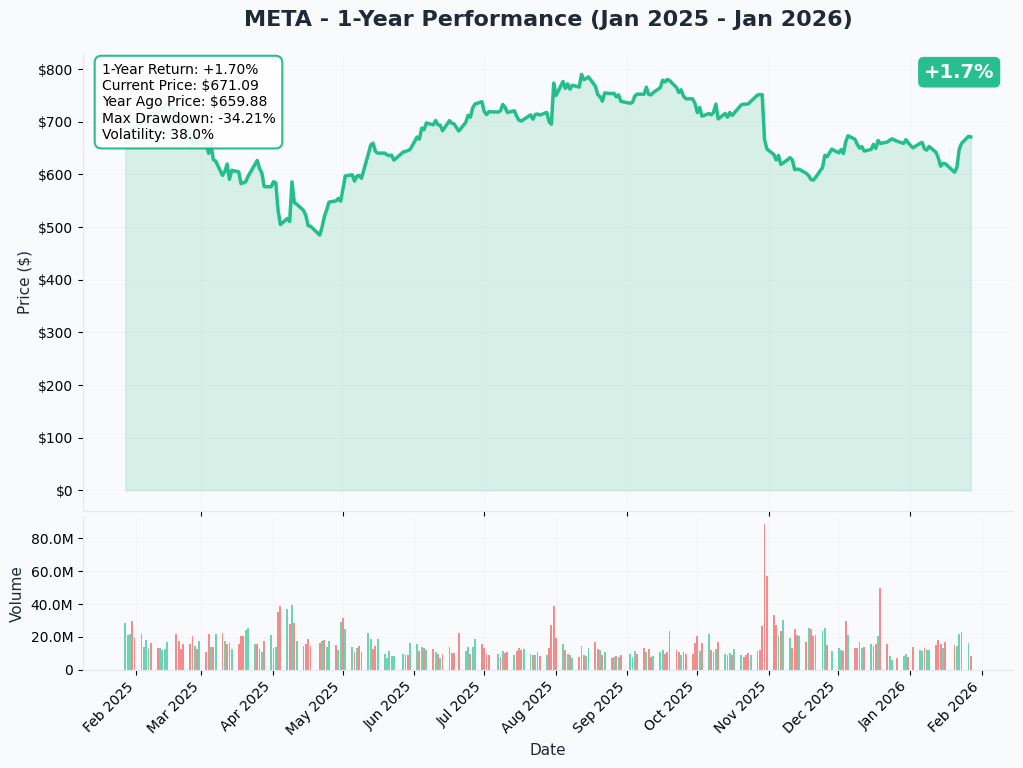
META currently trades at $672.48, which is roughly 18% below its August 2025 all-time high of $788.82. The stock took a major hit after Q3 earnings on October 29, 2025, falling 11% in a single session due to a massive one-time tax charge that cratered GAAP EPS. Since then, it's been building a base in the $640-$680 range. The 50-day MA crossed back above the 200-day MA on December 22, reversing an earlier death cross - a technically constructive signal heading into earnings.
Key observations:
- 📉 Down from highs: ~18% drawdown from $788.82 ATH creates potential "catch-up" narrative if earnings deliver
- 📈 Basing pattern: Stock has been consolidating $640-$680 for several weeks - coiling for a breakout or breakdown
- 💰 Valuation discount: P/E of 22.97 is actually modest for a Mag-7 name with 20%+ revenue growth
- 🔄 Technical reversal: 50-day MA back above 200-day MA signals institutional buyers re-engaging
Gamma-Based Support & Resistance Analysis
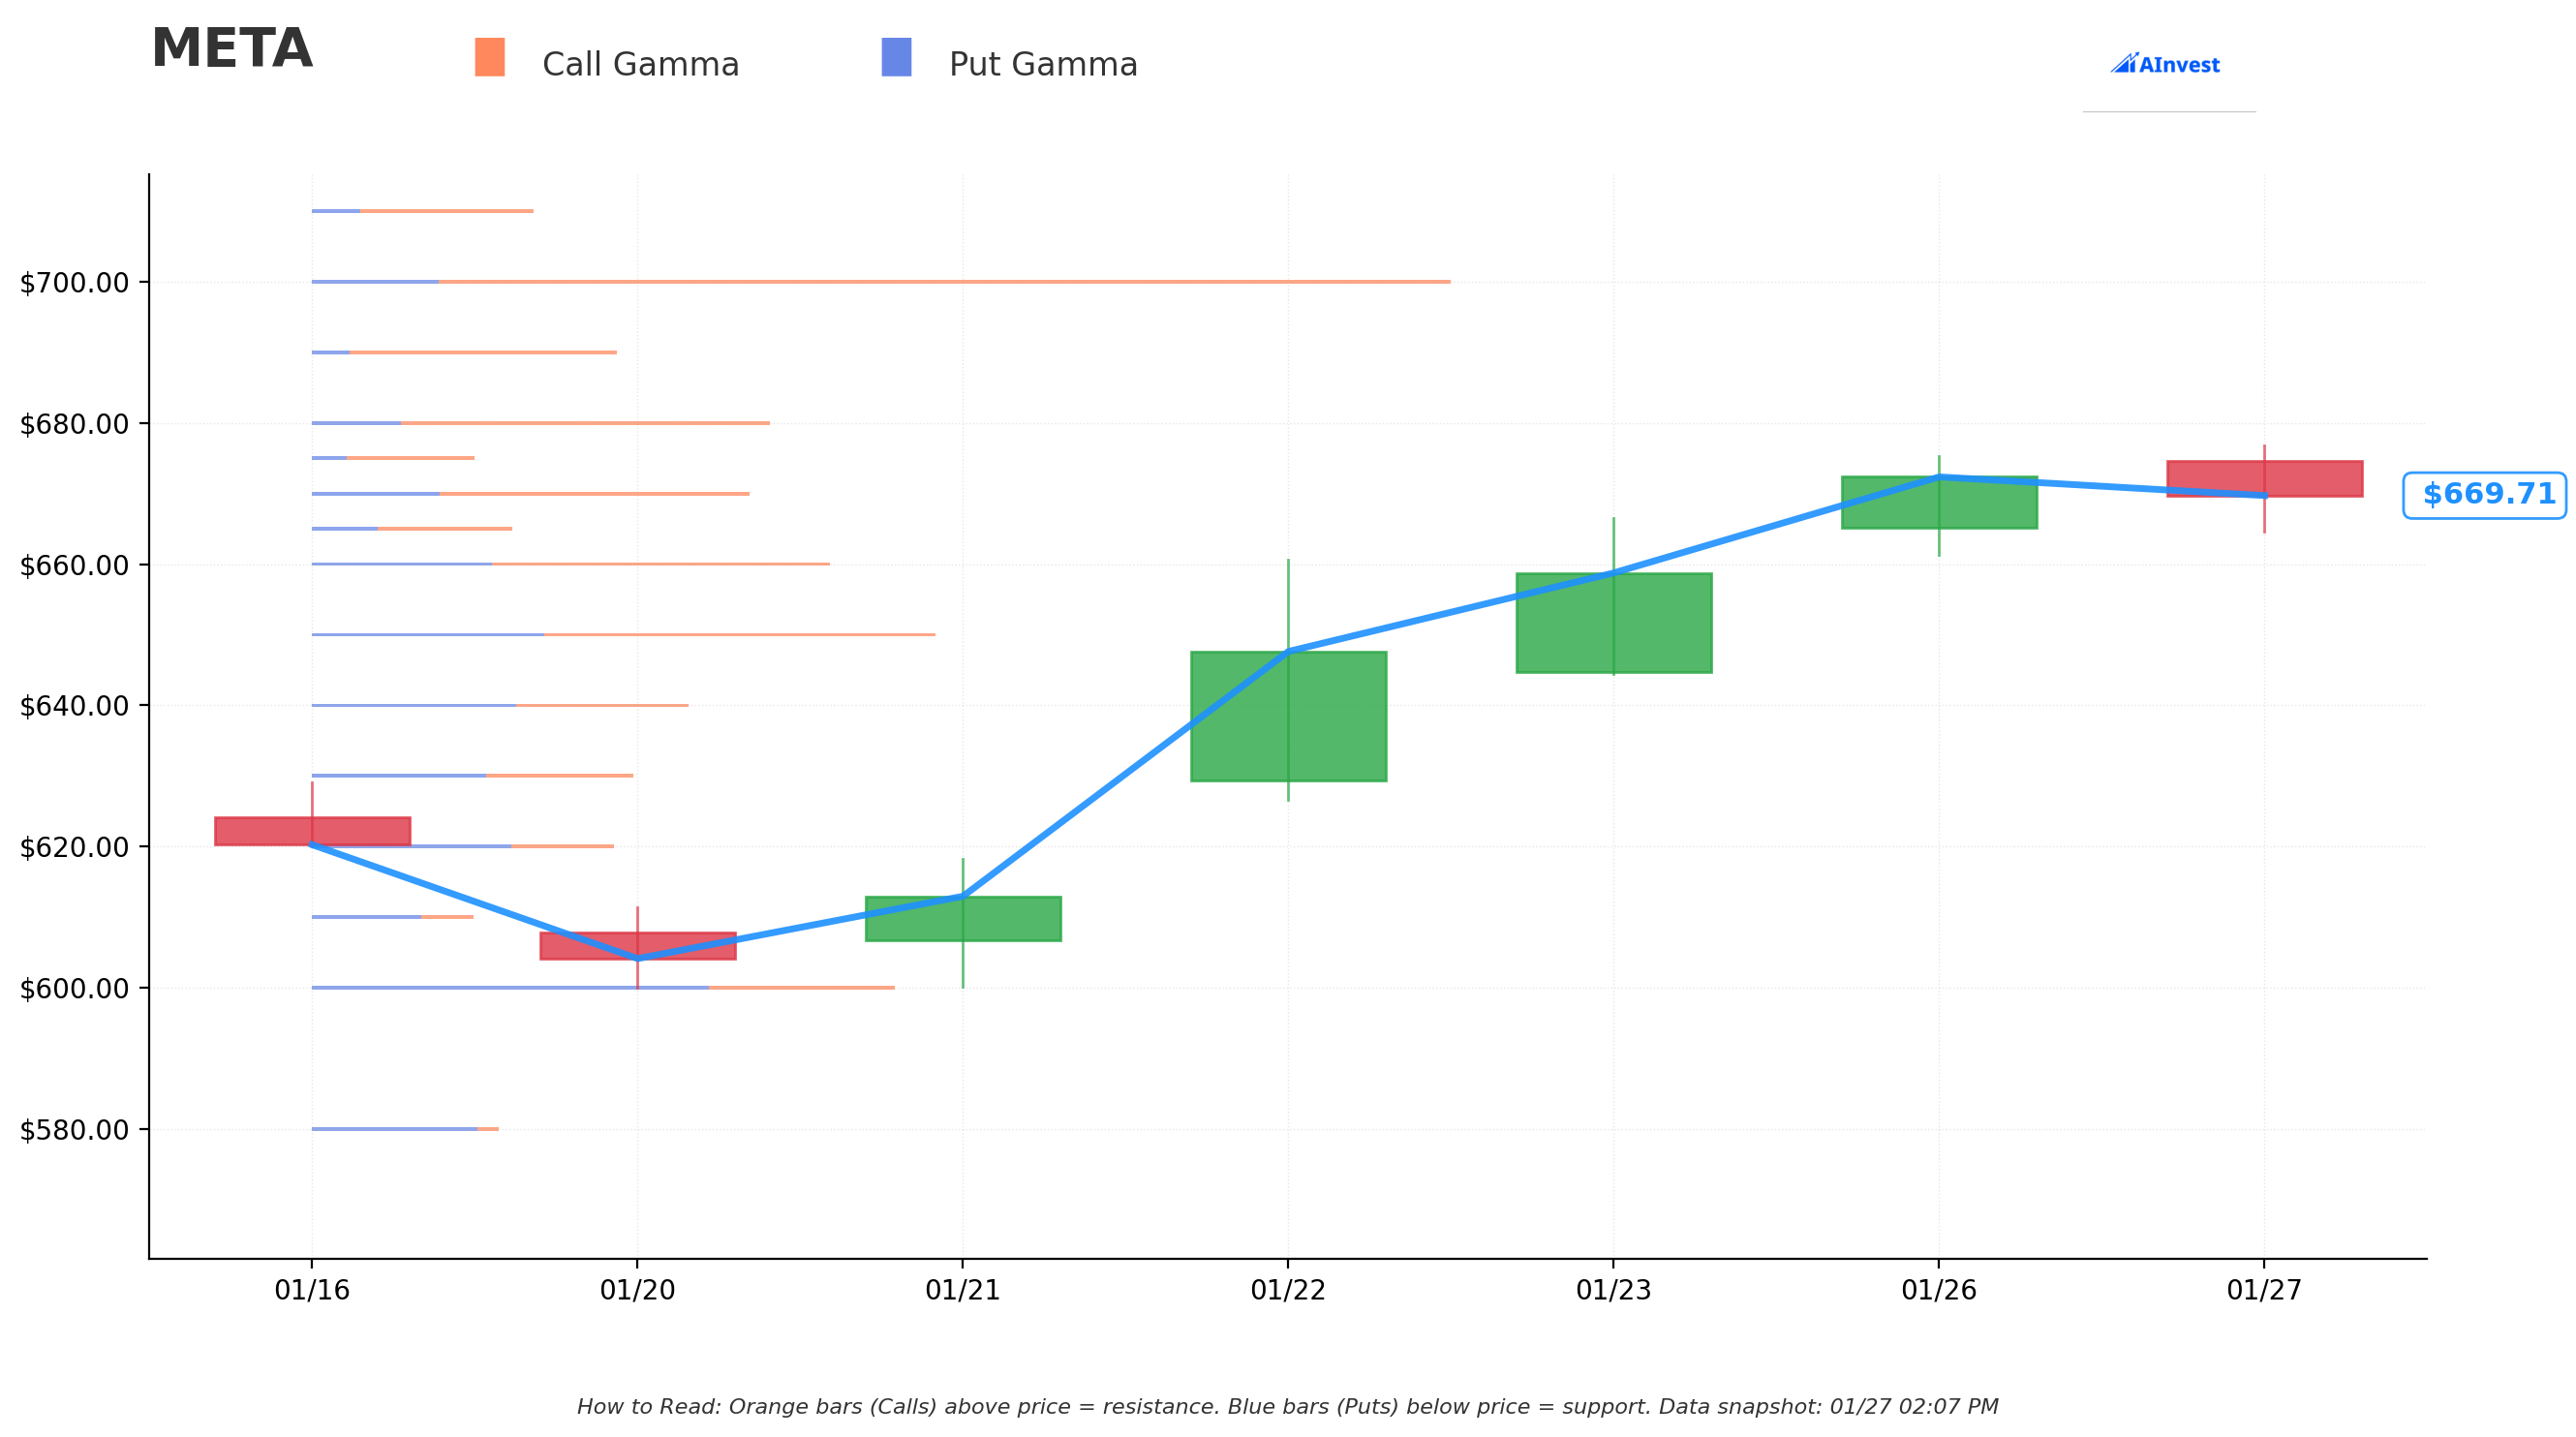
Current Price: $670.05
The gamma exposure (GEX) map reveals where market makers have significant options exposure, creating natural price magnets and barriers:
🔵 Support Levels (Below Price):
- $670 - Immediate support with 11.1B total gamma (net GEX: +4.58B, bullish lean)
- $660 - Secondary floor with 13.1B total gamma (net GEX: +4.04B) - strong dealer buying zone
- $650 - Major support at 15.8B total gamma (net GEX: +3.99B) - this is a significant cushion
- $640 - Extended support at 9.5B gamma (net GEX turns slightly negative here at -0.81B)
- $630 - Deeper floor at 8.1B gamma
- $600 - Disaster support at 14.8B gamma (net GEX: -5.36B, puts dominate here)
🟠 Resistance Levels (Above Price):
- $680 - First resistance at 11.6B gamma (net GEX: +7.08B) - moderate hurdle
- $690 - Secondary resistance at 7.7B gamma (net GEX: +5.82B)
- $700 - MASSIVE GAMMA WALL at 28.9B total gamma (net GEX: +22.43B!) - THIS IS THE STRIKE OF TODAY'S TRADE! The single largest gamma level on the board
- $750 - Extended target at 10.5B gamma (net GEX: +8.68B)
What this means for traders: The $700 strike is a MAGNET. With 28.9B in total gamma exposure - by far the biggest level on the board - it acts as a powerful attractor. If META breaks above $680-$690 on a strong earnings reaction, the momentum toward $700 could accelerate as market makers' hedging activity amplifies the move. The call buyer placed their bet EXACTLY at the biggest gamma level, which is smart positioning.
Net GEX Bias: Bullish (199.6B call gamma vs 100.0B put gamma) - overall dealer positioning leans bullish, meaning dips tend to get bought.
Implied Move Analysis
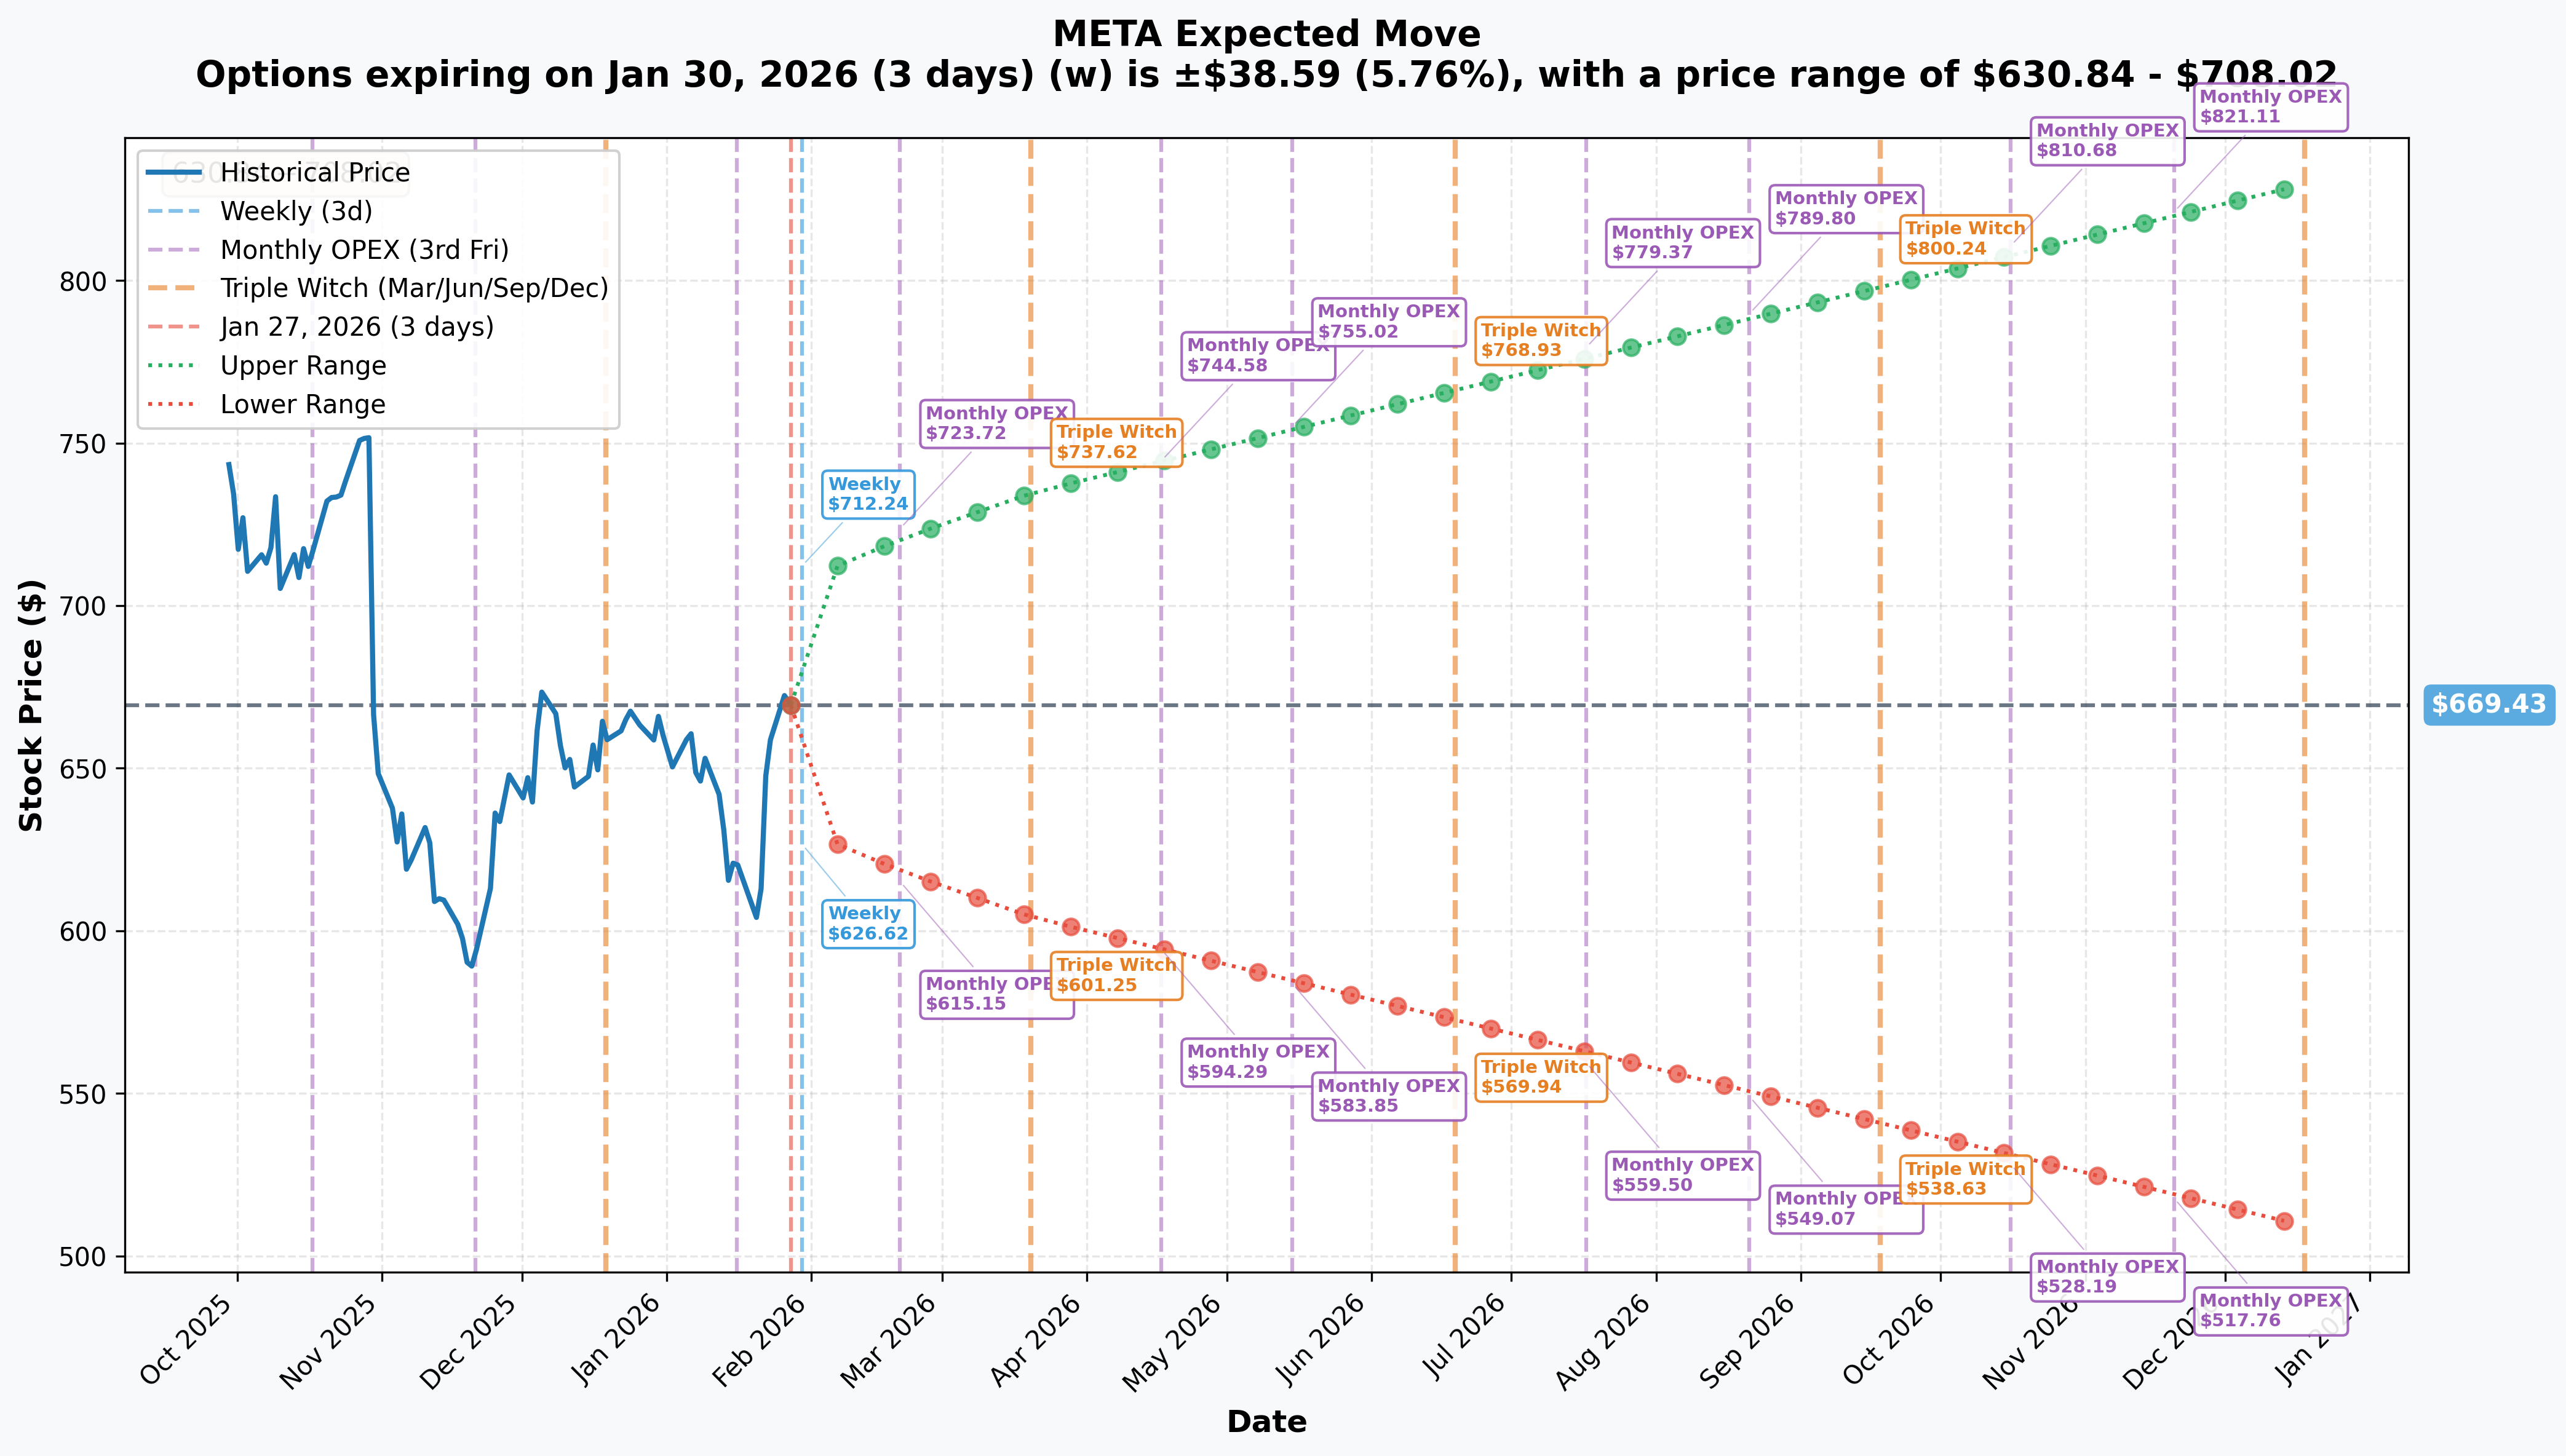
Options market pricing for upcoming expirations:
- 📅 Weekly (Jan 30 - 3 days): +/-$38.59 (+/-5.76%) -> Range: $630.84 - $708.02
- 📅 Monthly OPEX (Feb 20 - 24 days): +/-$51.25 (+/-7.66%) -> Range: $618.18 - $720.69
- 📅 Triple Witch (Mar 20 - 52 days): +/-$65.41 (+/-9.77%) -> Range: $604.03 - $734.84
- 📅 LEAPS (Dec 18 - 325 days): +/-$160.37 (+/-23.96%) -> Range: $509.06 - $829.81
Translation for regular folks: The options market is pricing in a 5.76% move ($38.59) by this Friday - that's a range of roughly $631 to $708. This is almost entirely driven by tomorrow's earnings. Notice that $708 upper range is right at the $700 strike where today's call buyer is positioned. They're basically betting META will hit or exceed the upper end of the implied weekly move. If earnings are solid and guidance impresses, there's room to run toward $720-$735 by February OPEX - well within the monthly implied range and into their profit zone.
🎪 Catalysts
🔥 Immediate Catalysts (This Week!)
Q4 2025 Earnings - January 28, 2026 (TOMORROW!) 📊
This is THE event. META reports Q4 results after market close tomorrow. Here's what Wall Street expects:
- 📊 Revenue: $58.45B (+21% YoY) - driven by continued ad growth and AI-powered Advantage+ platform
- 💰 EPS: $8.29 (vs $8.02 in Q4 2024) - modest growth due to Q3's tax charge distortion
- 🎯 THE BIG NUMBER: 2026 capex guidance - analysts expect $95-100B. Anything above $100B likely negative; anything at or below $95B would be a relief rally
- 🤖 AI metrics: Update on Advantage+ ad platform ($60B annualized run rate) and Llama model roadmap
- 📱 Ray-Ban Display: First concrete sales figures for the $799 smart glasses launched September 30 that have waitlists extending into 2026
Corning Fiber-Optic Deal (Today - January 27, 2026) 🔗
Meta and Corning announced a multiyear deal worth up to $6B through 2030 for fiber-optic cables for Meta's AI data centers. This reinforces Meta's commitment to AI infrastructure buildout.
🚀 Recent Catalysts (Last 3 Months)
Q3 2025 Earnings Beat + Selloff (October 29, 2025) 📉
Revenue of $51.24B (+26% YoY) crushed estimates, but GAAP EPS collapsed to $1.05 (vs $6.03 expected) due to a $15.93B one-time tax charge from Trump's "One Big Beautiful" tax bill. Stock fell 11% - creating the current "discount" to highs. Non-GAAP EPS was actually $7.25, beating by 9.7%.
Manus AI Acquisition (December 29, 2025) 🤖
Meta acquired Singapore-based AI agent startup Manus for an estimated $2-3B - their third-largest acquisition ever. Manus builds "general-purpose" AI agents and claimed $125M annualized revenue just 8 months after launch.
FTC Antitrust Victory (November 18, 2025) 🏛️
Judge Boasberg ruled in Meta's favor, finding the FTC failed to prove monopoly power. Major overhang removed. However, FTC filed notice of appeal on January 20, 2026 - so the low-probability breakup risk lingers.
Ray-Ban Display Launch (September 30, 2025) 🕶️
The $799 Ray-Ban Display glasses launched to overwhelming demand, so much that Meta delayed international expansion (UK, France, Italy, Canada) due to inventory constraints. Meta captures ~70% of the global smart glasses market, with the segment up 110% in H1 2025.
📅 Upcoming Catalysts (Next 6 Months)
- 🤖 AI Model Releases (H1 2026): Llama 4 Behemoth completion (288B active parameters) and Project Avocado/Mango proprietary models
- 🕶️ Ray-Ban Display International Launch (H1-H2 2026): Production scale-up to 10M pairs by end of 2026
- 🏗️ Data Center Buildout: Expanding beyond 10 GW total capacity by late 2026, $27B joint venture with Blue Owl Capital
- 📊 Q1 2026 Earnings: Expected late April 2026
🎲 Price Targets & Probabilities
Using gamma levels, implied move data, and the earnings catalyst, here are the scenarios through the February 27th expiration:
📈 Bull Case (30% probability)
Target: $720-$750
How we get there:
- 💪 Q4 revenue comes in at $59B+ (top of guidance) with strong ad pricing trends
- 🎯 2026 capex guidance of $90-95B (below the feared $100B+ level) - relief rally
- 🕶️ Ray-Ban Display sales surprise to upside, validating hardware revenue stream
- 🤖 Positive commentary on Advantage+ AI ad platform and AI agent monetization
- 📈 Stock breaks through $680-$690 resistance, gamma squeeze toward $700 wall, then momentum to $720-$750
- 🎯 Analyst consensus price target of $840 provides room for re-rating
Call trade P&L in bull case:
- Stock at $720: Calls worth $20, loss = -$2.00/contract (-9% loss, barely misses)
- Stock at $750: Calls worth $50, profit = +$28.00/contract (+127% ROI!)
🎯 Base Case (45% probability)
Target: $660-$700 range (earnings chop, then drift)
Most likely scenario:
- ✅ Solid Q4 earnings meeting consensus (~$58.5B revenue, $8.25-8.35 EPS)
- 📊 2026 capex guidance at $95-100B range - market shrugs, not thrilled but expected
- ⚖️ Stock pops 3-5% on earnings, then consolidates in $680-$700 range
- 🔄 Gamma wall at $700 acts as ceiling, $660-$670 gamma support acts as floor
- 💤 Post-earnings IV crush reduces option premiums significantly
Call trade P&L in base case:
- Stock at $690: Calls expire worthless or worth ~$0-5, loss of most premium
- Stock at $700: Calls at breakeven, still down premium paid
📉 Bear Case (25% probability)
Target: $600-$650
What could go wrong:
- 😰 2026 capex guidance comes in above $100B with unclear ROI timeline - investors spooked by spending
- 📉 Q4 revenue guidance for Q1 2026 disappoints amid macro uncertainty
- 🤖 DeepSeek-style competitive pressure calls into question massive AI spending
- 🏛️ FTC appeal or EU regulatory escalation adds new overhang
- 📉 Break below $660-$650 gamma support triggers cascade to $640, then $600 put gamma floor
Call trade P&L in bear case:
- Calls expire worthless - full $5.7M loss for the buyer
💡 Trading Ideas
🛡️ Conservative: Wait for Clarity, Then Buy the Dip
Play: Stay cash through earnings, look for pullback entry
Why this works:
- ⏰ Earnings tomorrow creates binary event risk - options market pricing 5.76% move either way
- 📉 If stock pulls back to $650-$660 gamma support post-earnings, you get a much better entry with 22x P/E
- 💸 IV crush after earnings makes options 30-50% cheaper within 48 hours
- 🎯 60 of 67 analysts rate META a Strong Buy with $840 mean price target - the long-term thesis is intact
Action plan:
- 👀 Watch earnings report Wednesday after close - focus on capex guidance number
- 🎯 If stock drops to $650-$660, consider buying shares or April $680 calls post-IV crush
- ✅ If stock rips above $700, wait for first pullback to $690-$700 before chasing
- ⏰ Reassess once you see Q1 2026 revenue guidance
Risk level: Minimal | Skill level: Beginner-friendly
⚖️ Balanced: Post-Earnings Call Spread
Play: After earnings settle, buy a February call spread targeting the gamma magnet
Structure: Buy Feb 27 $690 calls, Sell Feb 27 $720 calls
Why this works:
- 📊 Defined risk spread caps your max loss at the net debit (~$10-12 per spread post-IV crush)
- 🎯 Targets the $700-$720 zone where gamma exposure is heaviest
- ⏰ 30 days to expiration gives time for post-earnings momentum to develop
- 💸 Selling the $720 call reduces cost and takes advantage of IV crush on higher strikes
- 📈 Max profit: $18-20 if META above $720 at expiry (150-180% ROI)
- 📉 Max loss: $10-12 per spread (defined and limited)
Entry timing:
- ⏰ Wait 1-2 days post-earnings for IV to settle
- 🎯 Only enter if stock above $670 (shows earnings were decent)
- ❌ Skip if stock below $650 (bearish momentum, thesis broken)
Risk level: Moderate | Skill level: Intermediate
🚀 Aggressive: Follow the Whale - February $700 Calls
Play: Mirror the institutional trade - buy Feb 27 $700 calls
Why this could work:
- 🐋 $5.7M institutional money just validated this exact strike and expiration
- 🎯 $700 is the biggest gamma level on the board (28.9B total exposure) - acts as a price magnet
- 📈 If earnings catalyst pushes META above $700, gamma squeeze could accelerate move to $720-$750
- 💰 Analyst consensus target of $840 implies 25%+ upside from current levels
- 🕶️ Ray-Ban Display sales surprise + reasonable capex guidance = the recipe for a re-rating
Why this could blow up:
- 💸 At $22.00/contract ($2,200 per contract), these are NOT cheap
- ⏰ Need 7.4% move to breakeven ($722) - requires more than just a "good" earnings print
- 😱 If capex guidance scares the market, stock could drop 8-10% and these calls go to zero
- 🎢 Theta decay burns hard - if META doesn't move fast, time works against you
Position sizing: ONLY risk what you can afford to lose completely. These could easily go to zero.
Risk level: HIGH | Skill level: Advanced only
⚠️ Risk Factors
Don't get caught by these potential landmines:
-
⏰ Earnings binary event TOMORROW: Results after close on January 28 create massive volatility risk. Stock could gap 5-10% either direction. The 5.76% weekly implied move is large for a $1.7 trillion mega-cap. Post-Q3 selloff of 11% in a single session shows META can move FAST on disappointing guidance.
-
💸 2026 capex guidance is the swing factor: CFO Susan Li flagged that 2026 capex would be "notably larger" than 2025's $70-72B. Market expects $95-100B. Anything above $100B with unclear ROI could trigger another selloff. This is the number that will move the stock most.
-
🤖 AI spending ROI uncertainty: DeepSeek matched Meta's Llama models at a fraction of the cost, raising questions about whether spending more money equals winning in AI. The pivot from open-source to proprietary AI and Yann LeCun's public criticism signal internal strategic tension.
-
🏛️ FTC appeal keeps breakup risk alive: While Meta won the antitrust trial, the FTC filed an appeal on January 20, 2026. Low probability of reversal but high impact if it goes wrong. Timeline extends through H2 2026 and beyond.
-
🌍 EU regulatory pressure: EUR 200M fine for DMA breach in April 2025 and new investigation into WhatsApp AI policy in December 2025. Fines could escalate if non-compliance persists.
-
📉 Already down 18% from highs: While this creates upside potential, it also shows the stock has been under distribution since August. Buyers at $780+ are underwater and may sell into any rally to break even. Overhead supply is real.
-
🐋 This call buyer could be WRONG: $5.7M is a lot of money, but institutional traders lose money too. The Z-score of 17.54 tells you the trade is unusually large - it doesn't tell you it will be profitable. Don't blindly follow flow without understanding your own risk tolerance.
🎯 The Bottom Line
Real talk: Someone with deep pockets just dropped $5.7M betting META rallies above $700 within 31 days. The timing - the morning before the most important earnings report of the year - is deliberate. This is a conviction bet on strong Q4 numbers and manageable capex guidance.
What this trade tells us:
- 🎯 Institutional money sees the 18% pullback from highs as a buying opportunity, not a red flag
- 💰 They're willing to pay $22/contract for upside exposure, implying strong confidence in earnings
- 📊 The $700 strike aligns perfectly with the biggest gamma level on the board - they know the market structure
- ⏰ February 27th expiration gives them time beyond just the initial earnings reaction
If you own META:
- ✅ Hold through earnings if you have conviction in the long-term AI + advertising story
- 📊 Set a mental stop at $640 (below gamma support) to protect against capex guidance shock
- 🎯 If stock breaks $700 post-earnings, consider trimming 20-30% into strength and setting trailing stops
- 🛡️ If nervous, buying a protective Feb $650 put is reasonable insurance (costs ~$8-10)
If you're watching from sidelines:
- ⏰ Wednesday January 28th after close is when the cards get flipped - do NOT enter before earnings unless you understand the binary risk
- 🎯 Post-earnings pullback to $650-$660 gamma support would be an excellent entry point
- 📈 Confirmation needed: capex guidance below $100B, continued 20%+ ad revenue growth, Ray-Ban Display traction
- 💰 Analyst consensus target of $840 (27% upside) provides a real margin of safety if fundamentals deliver
If you're bearish:
- 📊 Watch the $660 support level - break below that and momentum shifts lower toward $640, then $600
- 🎯 Post-earnings put spreads (Feb $660/$640) offer defined-risk bearish positioning after IV crush
- ⏰ Capex guidance above $100B + weak Q1 outlook = the bear case trigger
Mark your calendar - Key dates:
- 📅 January 28 (Wednesday) after close - Q4 2025 earnings report (TOMORROW!)
- 📅 January 30 - Weekly OPEX (first post-earnings expiry)
- 📅 February 20 - Monthly OPEX
- 📅 February 27 - This $5.7M call trade's expiration
- 📅 Late April 2026 - Q1 2026 earnings expected
Final verdict: The core META story is strong - $200B+ annual ad revenue, a breakout smart glasses product, an FTC antitrust win, and a P/E of just 23x with 20%+ growth. But tomorrow's earnings is a genuine coin-flip event where capex guidance will either unlock the next leg higher or send the stock back to test support. The $5.7M call buyer is clearly betting on the former. Whether you follow them depends on your risk appetite and conviction level.
Be smart, size your positions appropriately, and don't let FOMO drive your decisions. The market will still be here next week.
Disclaimer: Options trading involves substantial risk of loss and is not suitable for all investors. This analysis is for educational purposes only and not financial advice. Past performance doesn't guarantee future results. The Z-score of 17.54 reflects this specific trade's size relative to recent META history - it does not imply the trade will be profitable. Always do your own research and consider consulting a licensed financial advisor before trading. Earnings create binary event risk with potential for 5-10% gaps either direction.
About Meta Platforms: Meta Platforms is the largest social media company in the world, with close to 4 billion monthly active users across Facebook, Instagram, Messenger, and WhatsApp. The company generates revenue through targeted digital advertising and is expanding into AI infrastructure, smart glasses hardware, and next-generation computing platforms, with a market cap of $1.69 trillion in the Services - Computer Programming & Data Processing industry.