🐻 META Bear Call Spread — $28M Bet That the Bounce Has Limits
📅 March 13, 2026 | 🔥 Unusual Activity Detected
🎯 The Quick Take
Someone just sold $28 MILLION worth of call spreads on META this morning, collecting premium by betting the stock stays below $680 through mid-May. META has already dropped ~20% from its all-time high of $796, and this trader is saying the rebound has a ceiling. Translation: smart money is writing insurance against a rally, not chasing one.
📊 Company Overview
Meta Platforms (META) is the largest social media company in the world, with close to 4 billion monthly active users across Facebook, Instagram, WhatsApp, and Messenger. The business is almost entirely ad-driven — and AI-powered targeting tools have made those ads work better than ever.
- Market Cap: ~$1.61 trillion
- Industry: Services — Computer Programming, Data Processing, Etc. (SIC 7370)
- Employees: 78,865
- Current Price (March 13, 2026): ~$625.85
- 52-Week Range: $479.80 – $796.25
- P/E Ratio (TTM): ~30.5x
Real talk: Meta is one of the most profitable businesses in tech. But after a 20% pullback from $796 highs — driven by a huge capex shock ($115–135B in 2026) and an AI model delay — the stock is at a crossroads heading into Q1 earnings.
💰 The Option Flow Breakdown
📊 The Tape — March 13, 2026 @ 10:29:25
| Time | Ticker | Side | Buy/Sell | Type | Expiration | Premium | Strike | Volume | OI | Size | Spot | Option Price | Option Symbol |
|---|---|---|---|---|---|---|---|---|---|---|---|---|---|
| 10:29:25 | META | MID | SELL | CALL $720 | 2026-05-15 | $14M | $720 | 16K | 13K | 14,000 | $625.85 | $9.81 | META20260515C720 |
| 10:29:25 | META | MID | SELL | CALL $680 | 2026-05-15 | $14M | $680 | 10K | 1.4K | 7,000 | $625.85 | $19.80 | META20260515C680 |
💸 Total Premium Collected: ~$28M combined
Both legs hit the MID price simultaneously — this is a coordinated, two-leg strategy, not two random trades.
🤓 What This Strategy Actually Means
This is a Bear Call Spread (Sell-to-Open) — here's how it works in plain English:
The trader sold the $680 call (collecting $19.80) and bought the $720 call (paying $9.81), for a net credit of ~$9.99 per share. Multiply by the contract sizes and you get roughly $28M total premium in their pocket — upfront, today.
Here's what each outcome looks like:
-
✅ Max Profit (~$28M): META stays below $680 by May 15. Both calls expire worthless. The seller keeps the full premium. This is the "do nothing and win" scenario — META just needs to avoid a 9%+ rally from current levels.
-
⚠️ Partial Profit: META closes between $680 and $720. The spread starts losing value. Breakeven is around $690 (short strike + net credit received).
-
❌ Max Loss: META closes above $720. The spread is fully in-the-money. Max loss is capped at ~$40 per share minus the premium received, or roughly $12M–$14M net worst case on the spread. This is what the $720 long call is protecting against.
Why sell this instead of just shorting stock? Because this is a defined-risk, time-decay-powered trade. The seller doesn't need META to crash — they just need it to NOT rally 9%+ in the next 63 days. Every day that passes without a breakout, theta (time decay) works in their favor.
Unusual about this trade:
- 👀 The $680 strike had only 1,400 OI before today — this trade more than 5x'd the open interest in a single print. That's not a hedge; that's a fresh directional bet.
- 💸 $28M collected in a single coordinated spread at MID price suggests this is likely one institutional player making a high-conviction call on META's near-term ceiling.
📈 Technical Setup / Chart Check-Up
YTD Performance
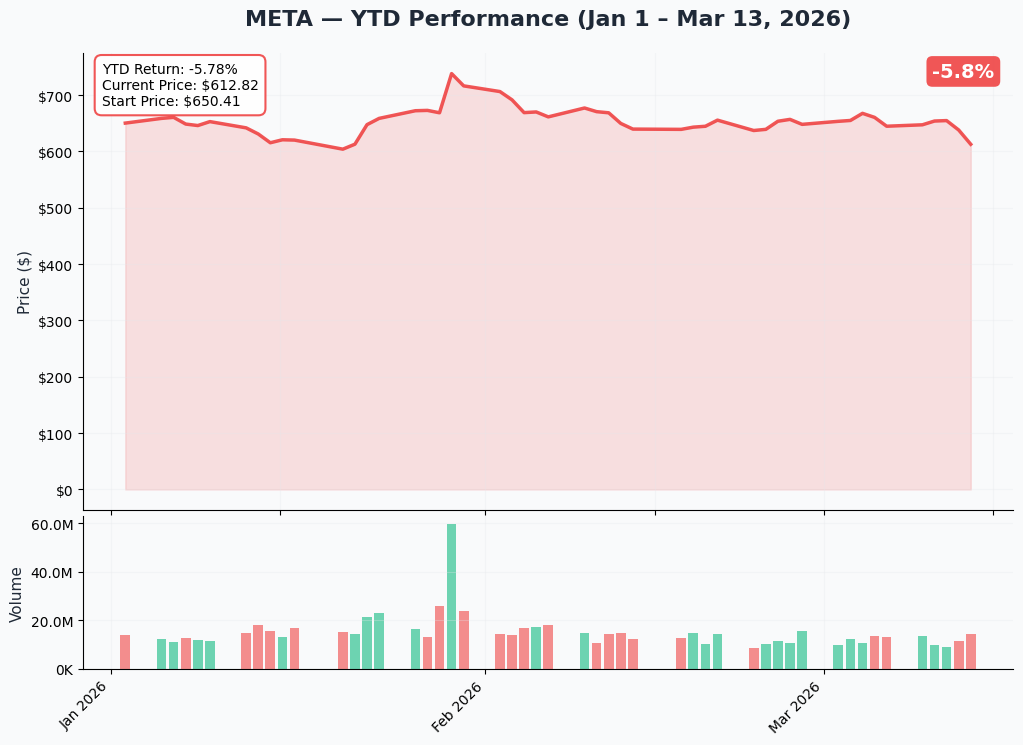
META started 2026 near its $796 all-time high and has since pulled back sharply to the $625 range — a ~21% drawdown. The sell-off has been driven by three things hitting at once: the $115–135B capex guidance shock, the 'Avocado' AI model delay, and general tech rotation. The stock is now holding around the $620–640 zone after bouncing off lows closer to $590. The YTD chart shows a stock that ran hard, got smacked, and is trying to find its footing.
Key observations:
- 📉 From peak to trough: -21% from $796 to ~$625 — significant but not catastrophic for a stock of this quality
- 🔄 Current zone: $620–640 appears to be near-term consolidation range after the bounce off lows
- 📊 Volume pattern: Elevated sell-side volume in February; lighter, mixed volume in the current bounce
- ⚠️ Recovery pace: Stock needs to reclaim $680 to start making the bear case nervous
📊 Gamma-Based Support & Resistance
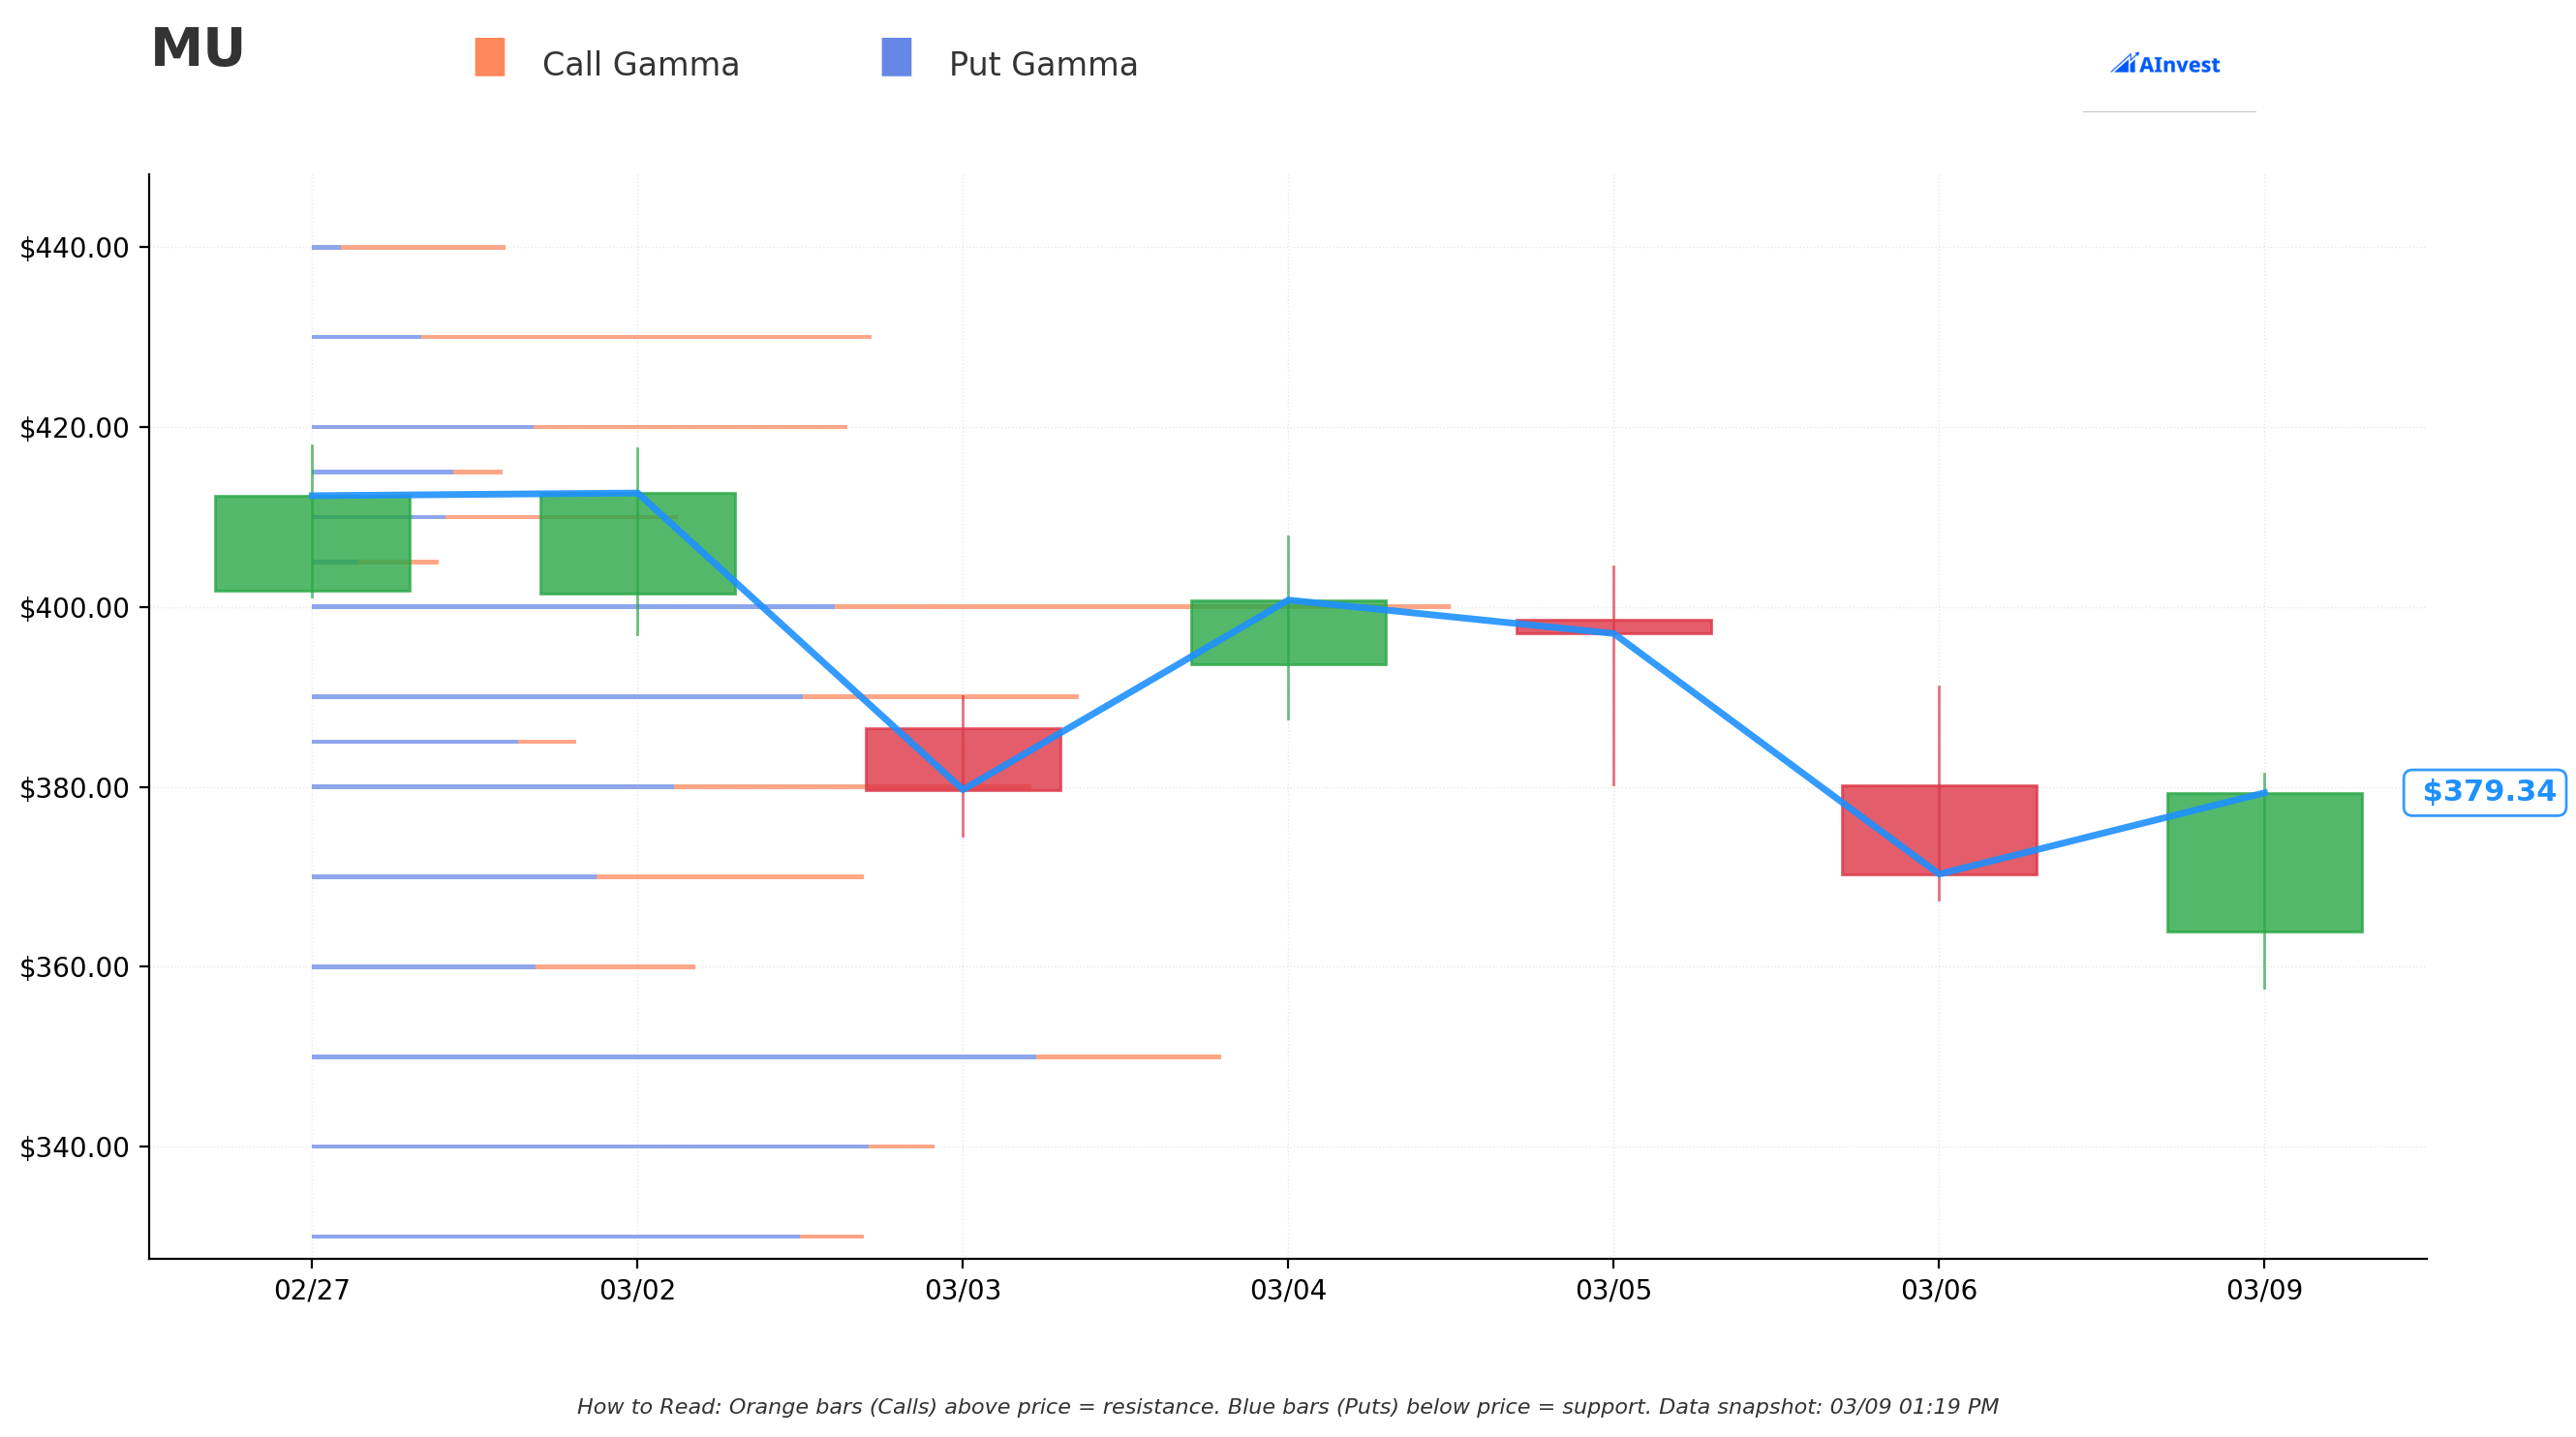
The gamma exposure map from today's data (price reference: $613) shows where market makers are most concentrated — these are the levels that act like price magnets or walls.
🔵 Key Support Levels (Put Gamma Below Price):
| Strike | Total GEX | Distance from Spot | What It Means |
|---|---|---|---|
| $610 | 13.9B | -0.5% | Immediate floor — heavy put gamma just below spot |
| $600 | 25.5B | -2.1% | Strongest nearby support — dealers step in hard here |
| $580 | 7.1B | -5.4% | Extended support if $600 breaks |
🟠 Key Resistance Levels (Call Gamma Above Price):
| Strike | Total GEX | Distance from Spot | What It Means |
|---|---|---|---|
| $615 | 16.8B | +0.3% | First overhead wall — strongest nearby resistance |
| $620 | 8.9B | +1.1% | Secondary ceiling |
| $630 | 14.3B | +2.7% | Significant gamma cluster — a wall to push through |
| $640 | 9.2B | +4.4% | Moderate resistance zone |
| $650 | 14.6B | +6.0% | Strong gamma barrier — balanced call/put here |
| $700 | 10.2B | +14.2% | Call-heavy resistance — well above the spread strikes |
Net GEX Bias: Bearish (total put gamma 171.7B vs call gamma 113.6B)
What this means for the spread: The gamma data confirms the market is positioned with more put protection below and call selling above. The $650 level (where call GEX starts dominating) is a meaningful barrier. Getting from $625 to $680 means pushing through three distinct gamma resistance clusters at $630, $640, and $650. That's not impossible, but it's not a free road either — this is exactly the kind of environment where a bear call spread makes sense.
📐 Implied Move Analysis
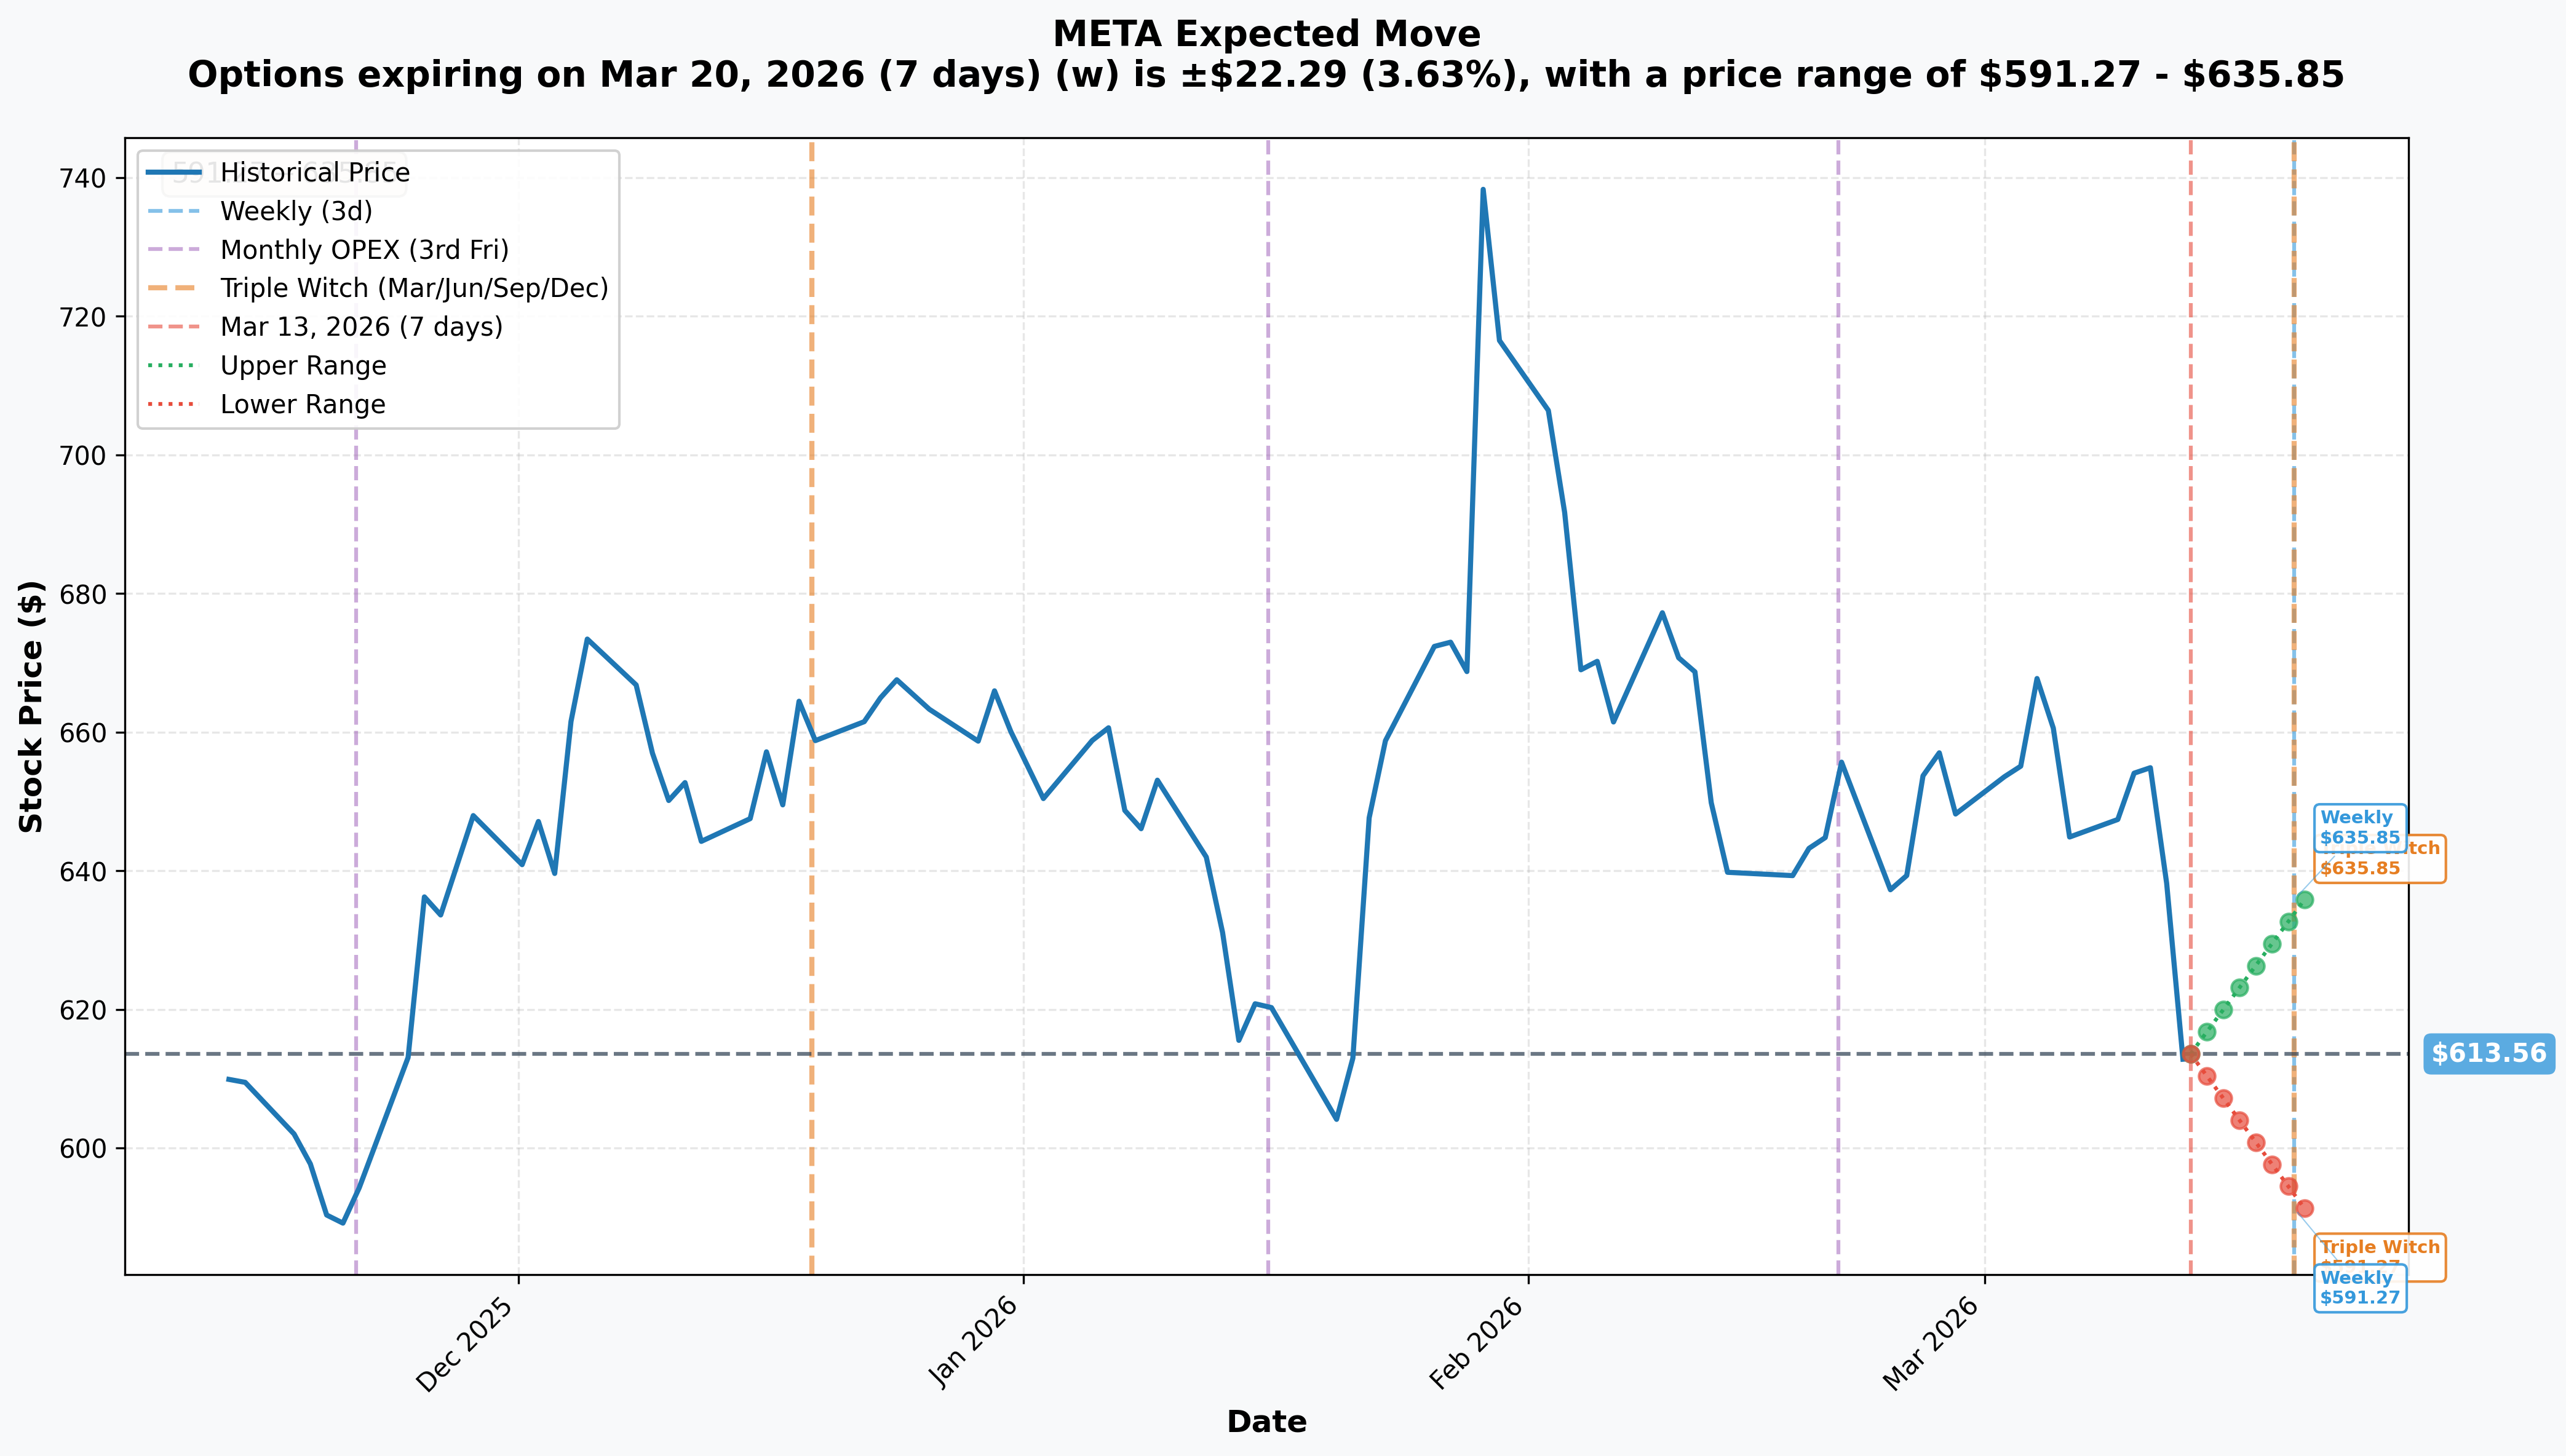
The options market is currently pricing in:
| Timeframe | Expiry | Days Out | Implied Move | Upper Range | Lower Range |
|---|---|---|---|---|---|
| Weekly / March OPEX | 2026-03-20 | 7 days | ±3.63% (±$22) | $635.85 | $591.27 |
Translation for regular folks: The market expects META to stay in a $591–$636 range through next Friday's March 20 expiration. Note that $635 is already well below the $680 short strike — so in the near term, the options market is agreeing with the spread seller's thesis.
The May 15 expiration is 63 days out. If we extrapolate roughly from the 7-day ±3.63% move, the longer-dated implied range expands significantly — consistent with a stock pricing in Q1 earnings as a binary event. Even the upper bound of a reasonable extrapolation lands around $680–$700, which is exactly where the seller placed their strike. This is not random strike selection.
🎪 Catalysts
✅ Past Catalysts (Already Happened)
Q4 2025 Earnings Beat — January 29, 2026 Meta reported Q4 2025 revenue of $59.9B, up 24% YoY, beating consensus. EPS came in at $8.88 vs. estimates of $8.19 — a clean beat. The stock rallied to new highs near $796 post-earnings.
2026 Capex Guidance Shock — January 29, 2026 On the same earnings call, management disclosed 2026 capex of $115–135B — nearly 73% above 2025's $72B spend. That scared investors who worried about profitability. This was the first real crack in META's post-earnings momentum and contributed to the subsequent selloff.
'Avocado' AI Model Delay — Early March 2026 Meta delayed the launch of its next-generation AI model, internally codenamed 'Avocado.' Per StockInvest reporting, this delay was cited as a contributing factor to the stock's ~15% pullback from its $796 highs toward current levels.
Stock Pullback from All-Time High ($796 → $625) The combination of capex concerns, AI model delay, broader tech rotation, and macro/tariff uncertainty took META from $796 all the way to ~$620 — a 20% draw. The stock has stabilized but hasn't reclaimed key levels yet.
🔮 Upcoming Catalysts (March – May 2026)
Q1 2026 Earnings — Expected Late April 2026 ⚠️ THIS IS THE BIG ONE This is the binary event that could make or break this spread. Street consensus expects ~$55B revenue (midpoint of the $53.5B–$56.5B guidance range), with EPS of approximately $7.00–$7.50. A strong beat plus upside Q2 guidance could push META back toward and potentially through the $680 short strike — which expires just 3 weeks after expected earnings. This is the spread's single biggest risk.
Avocado / Llama 5 AI Model Rescheduled Launch The rescheduled launch of Meta's next-gen AI model is a wildcard. If benchmarks come in competitive against OpenAI and Google, it could re-rate Meta's AI story upward and spark a rally. Timing is uncertain but likely before or around Q1 earnings.
Meta AI Assistant Monetization (Ongoing) Meta's AI assistant spans 3.3 billion+ daily active users across all its apps. Management has indicated early commercial tests are live. Any update on monetization traction at Q1 earnings would be a significant catalyst.
March 16, 2026 — Dividend Ex-Date (minor catalyst) Meta's quarterly $0.525 dividend goes ex on March 16. Minor downward technical pressure on the stock, consistent with the cautious near-term setup.
Quarterly OPEX — March 20, 2026 Next week's triple witch expiration could cause some positioning churn. The implied move of ±$22 suggests modest volatility around this event — not a major catalyst but worth watching for the setup.
🎲 Price Targets & Probabilities
Based on gamma levels, implied move data, current spot ($625.85), and the Q1 earnings binary event on the horizon:
📈 Bull Case — 25% probability
Target: $680–$720 by May 15
How we get there:
- 💪 Q1 earnings crush consensus — revenue well above $56.5B and EPS above $7.50
- 🚀 Q2 guidance surprises to the upside ($62B+), shifting the narrative away from capex fears
- 🤖 Avocado AI launch beats benchmarks, re-igniting AI momentum
- 📈 Breakout through $630, $640, $650 gamma walls — each cleared accelerates the move
- 🌐 Broader tech/risk-on rally provides tailwind
What this means for the spread: If META hits $680, the $680 short call is at-the-money and the spread begins losing money. Above $720, max loss kicks in. The spread seller's position is under real pressure in this scenario.
🎯 Base Case — 55% probability
Target: $600–$660 range (sideways/modest recovery)
Most likely scenario:
- ✅ Q1 earnings meet but don't meaningfully beat consensus — stock bounces but stays rangebound
- 📊 Gamma resistance at $630/$650 caps any near-term rally
- ⚖️ Capex overhang ($115–135B) keeps institutional buyers cautious
- 🔄 Stock oscillates in the $600–$650 zone ahead of earnings
- 💤 Theta works steadily in favor of the spread seller
Spread P&L: Both calls expire worthless or nearly so. The seller keeps most of the $28M premium. This is what the trade is designed for.
📉 Bear Case — 20% probability
Target: $560–$590 (tests lower gamma support)
What could drag it lower:
- 😰 Q1 earnings miss — revenue misses the $53.5B low end of guidance
- 🚨 Capex fears escalate — no reassurance on spending efficiency at earnings
- 📉 Broader market selloff or macro deterioration
- ❌ Avocado launch delayed again or benchmarks disappoint
- 🔨 Break below $600 gamma support triggers further selling to $580
Spread P&L: Maximum profit scenario. Both calls expire deep out-of-the-money. Seller keeps the full $28M.
💡 Trading Ideas
🛡️ Conservative: The "Time Is Money" Play
Play: Sell a tighter bear call spread further OTM, or simply wait for the post-earnings dust to settle before making any move.
Structure: Sell May 15 $700 call / Buy May 15 $740 call
- 💰 Estimated credit: ~$5–7 per spread
- 📊 Max profit if META stays below $700 (11.8% rally required)
- ❌ Max loss: $33–35 per spread (defined, capped)
- 🎯 More buffer from current spot — less earnings risk at the $700 level
Why this works: $700 sits right at a heavy call gamma resistance zone in the GEX data. The options market's short-term implied range ($591–$636) also suggests the street isn't expecting a run to $700 anytime soon. More room to be wrong, lower premium but better sleep.
Risk level: Moderate (defined risk) | Best for: Premium collectors who want more cushion
⚖️ Balanced: Follow the Smart Money (Modified)
Play: Replicate this spread structure at smaller size, entering with defined risk.
Structure: Sell May 15 $680 call / Buy May 15 $720 call (1–5 spreads)
- 💰 Estimated net credit: ~$9–10 per spread ($900–$1,000 per spread)
- 📊 Max profit if META stays below $680 by May 15
- ❌ Max loss: ~$30 per spread ($3,000 max, capped)
- 🎯 Breakeven: ~$689–$690
Why this works: You're essentially replicating what the institutional trader did, but sized for a retail account. The $680 level sits above multiple gamma resistance walls ($630, $640, $650) and would require META to rally 9% in 63 days to threaten the position. If you think the capex overhang and pre-earnings uncertainty keep a lid on the stock, this collects steady premium with defined downside.
Entry tip: Wait until after March 20 OPEX to enter — let the triple witch noise pass first.
Risk level: Moderate | Best for: Swing traders comfortable with spread mechanics
🚀 Aggressive: Earnings Vol Play — Short Straddle or Strangle (Advanced Only!)
Play: Sell a strangle around earnings, betting on a muted post-earnings reaction.
Structure: Sell May 15 $580 put / Sell May 15 $680 call (strangle)
- 💰 Combined credit: ~$25–30 per strangle
- 🎯 Profit zone: META stays between $580 and $680 at expiration
- ❌ Unlimited risk on the upside; substantial risk on the downside
- ⚠️ Requires margin; NOT for small accounts
Why this could work: META has already priced in significant uncertainty from capex and model delays. If Q1 earnings are solid-but-unremarkable (the most likely outcome), the stock may simply consolidate in its current range. The $28M institutional spread seller is betting on the same outcome.
Why this could blow up:
- 💸 A strong Q1 beat could drive META to $700+ quickly (call side at risk)
- 📉 A miss could gap the stock to $560–$580 (put side at risk)
- 🎢 Short strangles/straddles have theoretically unlimited loss on the upside — must actively manage
CRITICAL WARNING: Do not attempt naked short strangles without significant margin, active risk management systems, and clear knowledge of how to roll or exit in adverse moves. This is an advanced strategy that can result in losses many multiples of the premium received.
Risk level: HIGH (unlimited upside risk) | Best for: Experienced premium sellers only
⚠️ Risk Factors
Here's what could go wrong with the bear call spread thesis — be honest with yourself about each one:
-
🚨 Q1 earnings binary risk: Meta reports in late April, just 3 weeks before May 15 expiration. Consensus expects ~$55B revenue. A beat + strong Q2 guide could push the stock through $680 fast. There is no more dangerous time for a short call spread than the last few weeks before expiration when the underlying is approaching your strike.
-
📈 Analyst community is very bullish: Average price target is ~$859, with a Strong Buy consensus. The lowest analyst target is $668 — still above the $680 short strike. If even moderately bullish catalysts land, institutional buying could push through gamma resistance.
-
🤖 AI model launch re-rating risk: A successful Avocado / Llama 5 launch with impressive benchmarks could meaningfully re-rate META's AI multiple. This kind of sentiment catalyst can drive 5–10% gaps quickly, especially from a technically oversold position.
-
💰 $115–135B capex could be reframed positively: Right now, investors are treating the massive capex as a negative (profitability hit). But if Q1 results show those investments producing ad revenue efficiency gains, the narrative could flip and become a bull catalyst. Markets can reprice fast.
-
📊 Gamma walls are not permanent: The $630–$650 resistance levels in the GEX data reflect today's positioning. As expiration approaches or large blocks unwind, these levels can shift. Don't treat them as guaranteed ceilings.
-
🎢 52-week range is wide ($480–$796): META has already shown it can move 60%+ in a year. A 9% rally from $625 to $680 is well within the stock's normal range of motion — especially if market sentiment turns broadly risk-on.
-
🌍 Macro/tariff uncertainty: Broader market conditions could push META down (great for the spread) OR drive a relief rally that lifts all mega-caps (bad for the spread). External macro is not controllable.
🎯 The Bottom Line
Here's the deal: Someone just collected $28 million in premium betting that META's recovery stalls before reaching $680 by mid-May. With the stock at $625, they need the market to hold below the strike — a 9% buffer that looks reasonable on the surface, but gets tested hard by Q1 earnings in late April.
The trade makes sense IF:
- ✅ Q1 earnings are in-line or modestly below expectations — no blowout beat
- ✅ Capex concerns continue to weigh on sentiment and cap the multiple
- ✅ No surprise AI product news re-rates the stock before May 15
- ✅ The gamma resistance walls at $630, $640, $650 hold and make the rally a slow grind
The trade gets painful IF:
- ❌ META beats Q1 consensus meaningfully and guides Q2 above $60B
- ❌ The Avocado AI model launches with strong benchmarks, sparking a re-rating
- ❌ Broader market risk-on rally lifts all mega-cap tech
For retail traders watching this:
- 👀 If you want to follow this trade, size it to where the max loss is less than 2–3% of your portfolio. A $720/$680 bear call spread risks ~$30 max to collect ~$10 — that's a 1:3 risk/reward, meaning you need it to work more often than not.
- ⏰ Mark your calendar: Late April Q1 earnings is the moment of truth for this position. Watch for revenue vs. the $53.5B–$56.5B guidance and listen for any commentary on AI model timing.
- 🎯 If META starts approaching $660–$670 in the weeks ahead, that's an early warning signal for the spread — not a disaster yet, but time to monitor closely.
- 🛡️ If you're in this trade, consider having an exit plan ready if the stock breaks through $655 with conviction. Sometimes the right move is to cut a loser early rather than ride it to max loss.
The bottom line: This institutional spread is a measured, defined-risk expression of a very specific view — that META's 20% recovery from $796 has a ceiling around $680 through May. It's not a disaster call on Meta as a business. It's a trader saying: "The stock has already bounced, earnings are risky, and I'll get paid to wait and see." That's a reasonable, grounded thesis. But Q1 earnings will decide whether it was right.
Protect your capital. Trade the plan, not the hope. 💪
Disclaimer: Options trading involves substantial risk of loss and is not suitable for all investors. This analysis is for educational and informational purposes only and does not constitute financial advice or a recommendation to buy or sell any security. Past performance does not guarantee future results. Bear call spreads involve the risk of loss up to the width of the spread minus premium received. Short options positions require margin and can result in losses exceeding initial premium collected. The unusualness of the flow described reflects this trade's size and characteristics relative to recent activity — it does not imply the trade will be profitable or that you should replicate it. Always conduct your own due diligence and consider consulting a licensed financial advisor before making any investment decisions. Options expire worthless in most cases — be sure you understand the mechanics and risks of any strategy before entering a position.