NET $9.5M LEAP Put Sell at $160 - Institutional Bull Plants a Flag 17 Months Out
January 29, 2026 | Unusual Activity Detected
The Quick Take
Someone just sold $9.5 MILLION in NET puts this morning at 11:05:00. This massive position opened 3,022 contracts of $160 strike puts expiring June 17, 2027 - a LEAP trade with 17 months of runway. With NET trading at $179.08, this put is 10.6% out of the money. Open interest was zero before this trade, meaning this is a brand new position. If NET stays above $160 through June 2027, the seller keeps all $9.5M in premium. If NET drops below $160, the seller buys 302,200 shares at an effective cost basis of $128.40 per share - roughly 29% below today's price. Translation: A large institution just bet big that Cloudflare's floor is $160 for the next year and a half, and they're getting paid $9.5M to make that bet.
Company Overview
Cloudflare, Inc. (NET) is a global software company operating one of the world's largest distributed networks, providing security, performance, and edge computing services:
- Market Cap: $64.8 Billion
- Industry: Services - Prepackaged Software
- Current Price: ~$179.95 (up ~60% YTD)
- Primary Business: DDoS protection, DNS services, zero trust security, CDN, serverless edge computing (Workers), and AI inference infrastructure
The Option Flow Breakdown
The Tape (January 29, 2026 @ 11:05:00):
| Time | Symbol | Side | Buy/Sell | Type | Expiration | Premium | Strike | Volume | OI | Size | Spot | Option Price | Option Symbol |
|---|---|---|---|---|---|---|---|---|---|---|---|---|---|
| 11:05:00 | NET | MID | SELL | PUT $160 | 2027-06-17 | $9.5M | $160 | 3,400 | 0 | 3,022 | $179.08 | $31.60 | NET20270617P160 |
What This Actually Means
This is a cash-secured short put - one of the most bullish options strategies available. Here is what happened:
- Premium collected: $9.5M ($31.60 per contract x 3,022 contracts)
- Strike price: $160, which is 10.6% below spot price of $179.08
- Time horizon: 17 months to June 2027 - this is a LEAP, not a short-term bet
- Open interest was zero: This is an entirely new position, not a roll or adjustment
- Notional exposure: 302,200 shares x $160 = $48.4M in potential stock purchase obligation
- Effective cost basis if assigned: $160 - $31.60 = $128.40 per share (28.5% below current price)
What is really happening here: This institution is saying: "I am willing to buy 302,200 shares of NET at $160, and I will collect $9.5M while I wait." The massive time premium ($31.60 for a $160 put with spot at $179) reflects the elevated implied volatility in NET options, and the seller is harvesting that rich premium. If NET stays above $160 at any point through June 2027, the seller profits. If NET falls below $160, the seller effectively owns the stock at $128.40 - a price NET last traded at months ago. This is the kind of trade that screams long-term institutional conviction.
The $160 strike is not random. It sits precisely at a major gamma support level, meaning market maker hedging activity creates natural buying pressure around that price. The seller picked the exact level where the options market structure itself acts as a floor.
Technical Setup / Chart Check-Up
One Calendar Year Chart
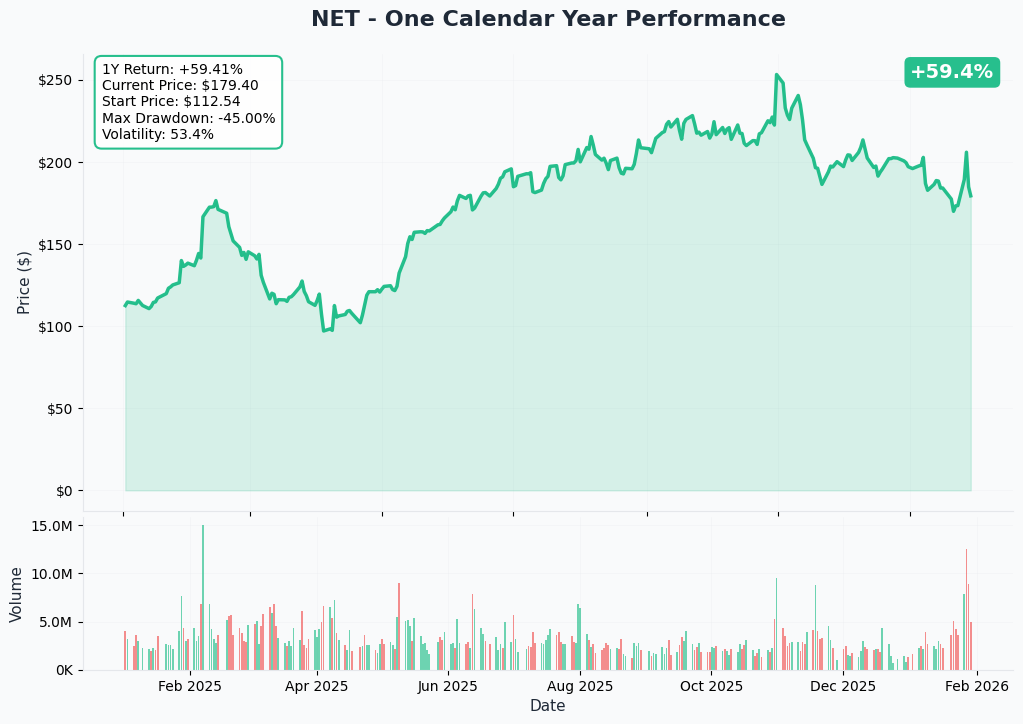
NET is having an exceptional year - up +59.9% YTD with the current price around $179.95. The stock has shown strong momentum driven by the AI infrastructure narrative and solid fundamental execution. However, the path has not been smooth:
Key observations:
- Strong uptrend: NET has more than doubled from its 52-week low of $89.42, reflecting broad recognition of its AI/edge computing positioning
- Recent volatility: NET dropped ~10% on January 28 on profit-taking after an AI-narrative-fueled rally - this was NOT fundamental deterioration
- 52-week range: $89.42 to $260.00 shows extreme volatility - this stock can move significantly in both directions
- Current position: Trading in the upper half of its 52-week range, well above the $160 put strike
Gamma-Based Support & Resistance Analysis
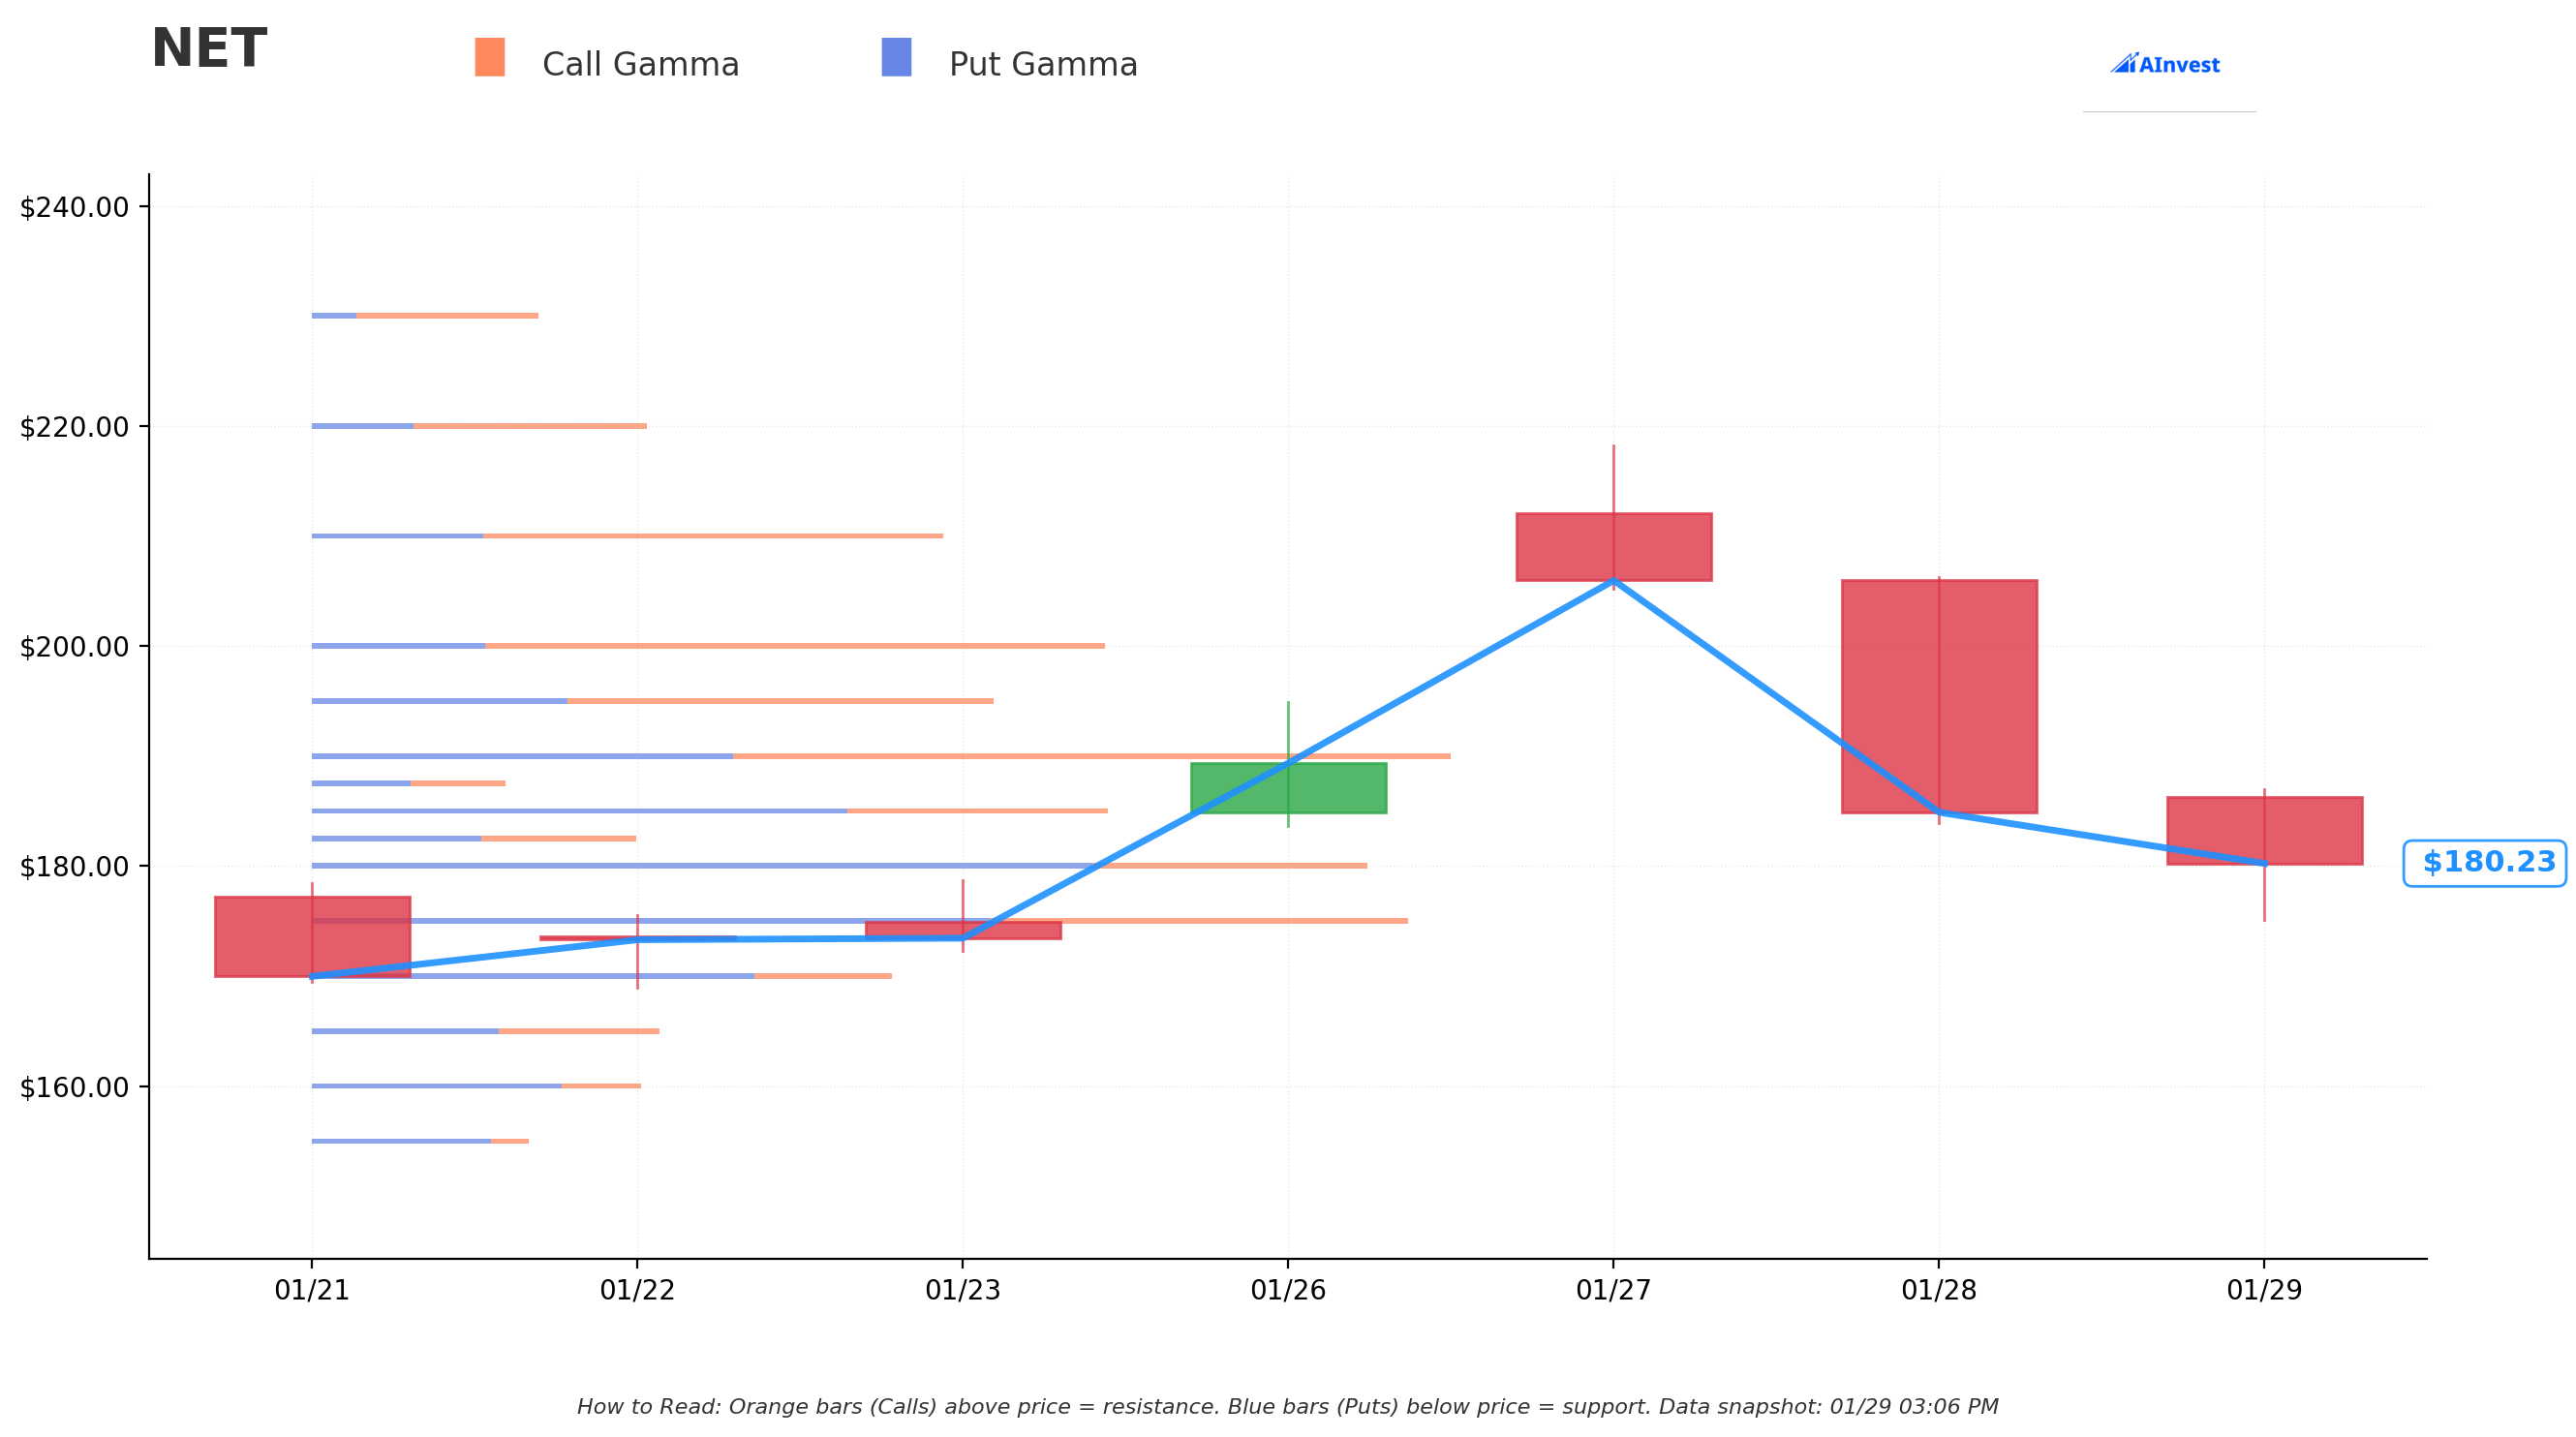
Current Price: $180.07
The gamma exposure map reveals critical price levels that institutional traders and market makers are positioned around:
Support Levels (Put Gamma Below Price):
- $180 - Immediate support (current price sitting right on this level)
- $175 - Secondary support zone
- $170 - Intermediate structural floor
- $165 - Deep support
- $160 - MAJOR support and THIS TRADE'S STRIKE - the institutional line in the sand
Resistance Levels (Call Gamma Above Price):
- $185 - Immediate resistance overhead
- $190 - Secondary ceiling
- $195 - Intermediate resistance
- $200 - Psychological round number and major barrier
- $210 - Extended upside target
What this means for traders: NET is sitting right on the $180 support level after the January 28 selloff. The gamma data shows significant positioning at both $180 and $160, creating natural buying floors. The $160 strike where this put was sold is the deepest support level on the gamma map - breaking below that would require a fundamental shift in the company's outlook, not just normal volatility.
The put seller struck at $160 where gamma support is strongest. This is not coincidence. Sophisticated traders pick strikes that align with structural market levels. At $160, both institutional put selling AND market maker hedging flows would create aggressive buying - making it an extremely difficult level to breach.
Net GEX Bias: Bullish - overall positioning supports prices staying above current levels.
Implied Move Analysis
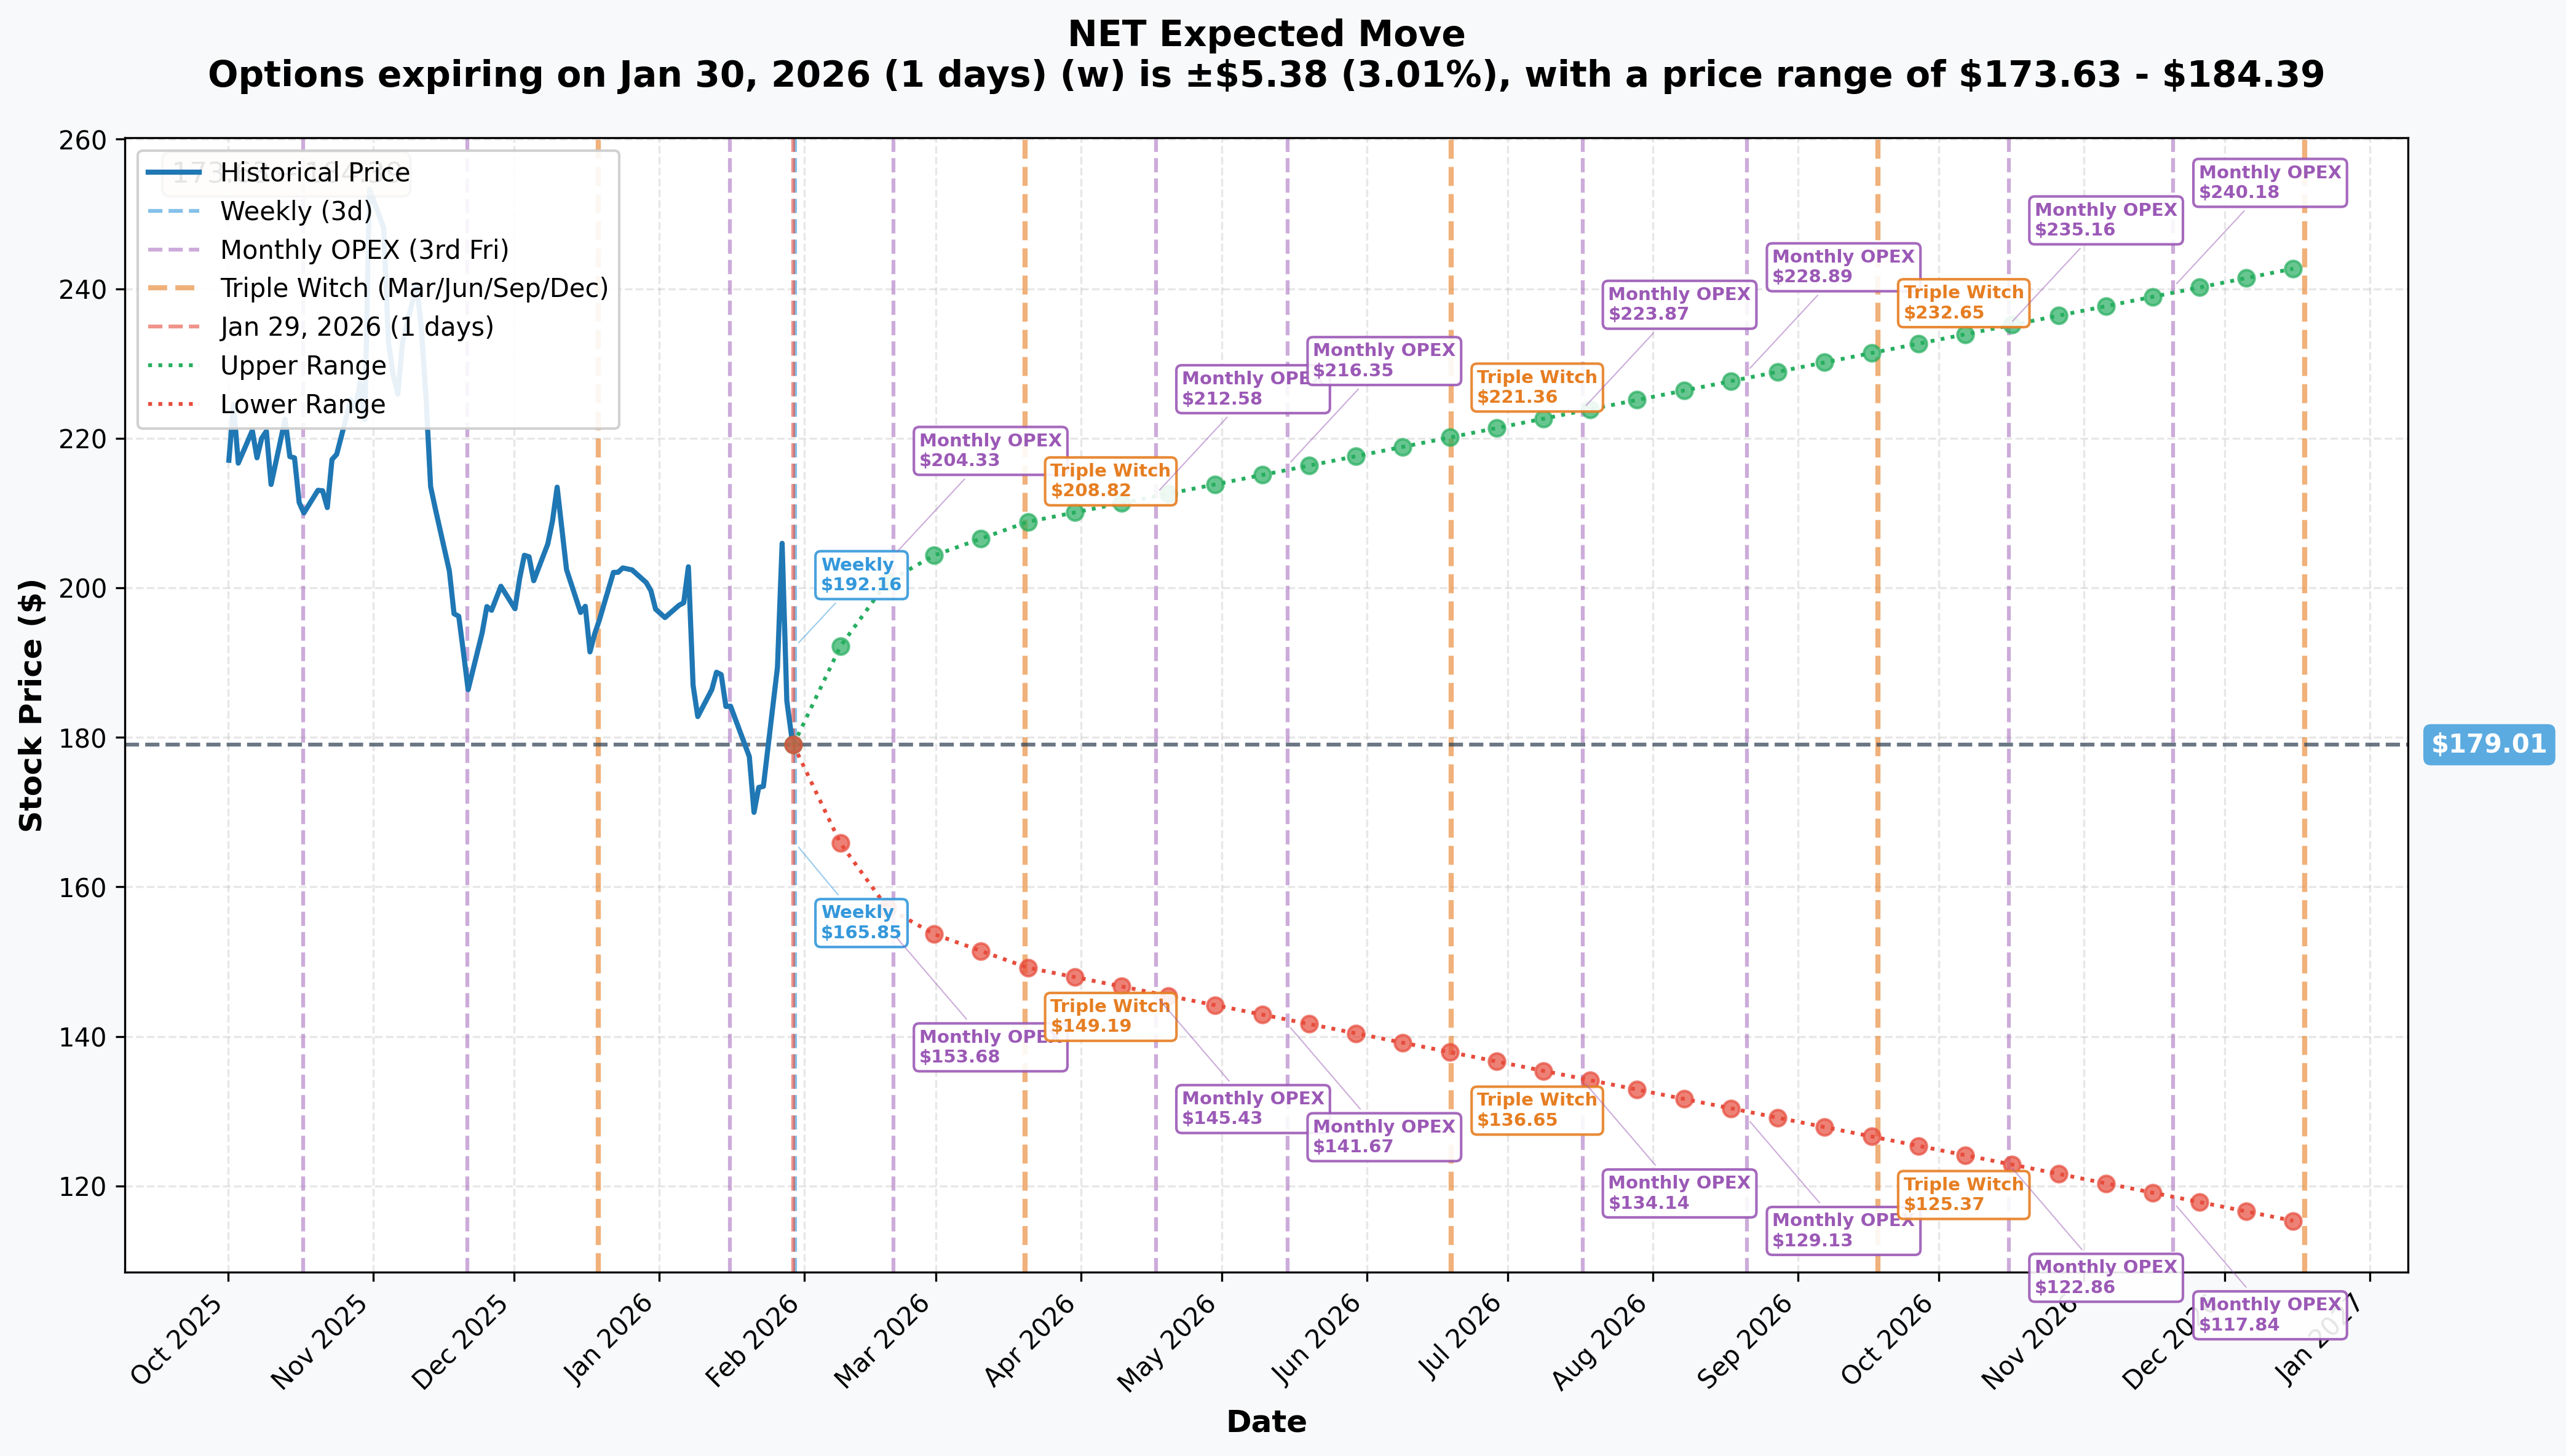
Options market pricing for upcoming expirations:
- Weekly (Jan 30 - 1 day): +/-3.0% (+/-$5.38) -> Range: $173.63 - $184.39
- Monthly OPEX (Feb 20 - 22 days): +/-13.1% (+/-$23.52) -> Range: $155.48 - $202.53
- Quarterly (Mar 20 - 50 days): +/-16.6% (+/-$29.81) -> Range: $149.19 - $208.82
- Yearly LEAPs: +/-35.8% (+/-$64.05) -> Range: $114.96 - $243.06
Translation for regular folks: Options traders are pricing a small 3% move by tomorrow, but a MASSIVE 13% move through February OPEX - which includes Q4 2025 earnings expected around February 5-10. That monthly implied range of $155 to $203 tells you the market expects a major move around earnings.
The LEAP implied range ($115 to $243) encompasses this trade's $160 strike on the lower end. The market says there is a real but low probability NET trades below $160 over the next year. The put seller is betting on the right tail of that distribution - collecting premium for taking on a risk the market prices as unlikely but not impossible.
Key insight: The monthly implied move lower boundary ($155.48) is BELOW the $160 put strike, meaning the market acknowledges NET could briefly trade below $160 around earnings. But the LEAP seller has 17 months - even if NET dips below $160 temporarily, there is plenty of time for recovery. This is a fundamentally different risk profile than a short-dated trade.
Catalysts
Immediate Catalysts (Next 14 Days)
Q4 2025 Earnings - Expected February 5-10, 2026 (LESS THAN 2 WEEKS!)
Cloudflare will report fiscal Q4 2025 results in early February. This is THE near-term catalyst that will set the tone for 2026. Wall Street consensus and key expectations:
- Revenue: $614M consensus vs company guidance of $588.5M-$589.5M - Street is pricing in a beat, as Cloudflare has consistently exceeded guidance
- Full-Year 2025 Revenue: ~$2.14B (+28% YoY), with the raised guidance from Q3 confirming strong execution
- Operating Income: Guided $83M-$84M for Q4
- Non-GAAP EPS: FY2025 consensus of $0.93 vs Q3 beat of $0.27 (108% above consensus)
- 2026 Guidance: Market expects ~$2.76B revenue (~28% growth) - this number will be the most important data point
- Large Customer Count: Must continue above 4,009 (23% YoY growth in Q3) to validate enterprise penetration story
- Net Retention Rate: 119% in Q3 (up 5pp QoQ) - sustained improvement validates platform stickiness
- RPO Growth: $2.143B (+43% YoY) in Q3 - continued RPO acceleration signals future revenue visibility
Upside surprise potential: Cloudflare has a strong track record of beating guidance. Q3 revenue of $562M beat the $544M consensus by 3.2%, and EPS of $0.27 crushed the $0.13 estimate by 108%. If this pattern continues, Q4 revenue could approach $620M+ and 2026 guidance could surprise above $2.8B.
Downside risk factors: Any growth deceleration below 25% would challenge the ~30x forward revenue multiple. Gross margin compression (Q3 GAAP gross margin fell to 74.0% from 77.7% YoY) could also spook investors if the trend continues. At $180, the stock has limited margin for error.
Near-Term Catalysts (Q1-Q2 2026)
$3 Billion Annualized Revenue Run-Rate Target
Cloudflare committed to reaching $3B annualized revenue by Q4 2026, implying ~$750M quarterly revenue by year-end. This requires meaningful acceleration from the current ~$590M quarterly run-rate:
- Achieving this target validates the "land and expand" enterprise strategy
- Q4 2025 and Q1 2026 results will show whether the ramp trajectory supports a $3B pace
- Missing this target would signal growth is decelerating and could trigger 20-30% downside
- Hitting it early would be a major positive catalyst for re-rating toward analyst targets of $232-$253
Replicate Acquisition Integration
Cloudflare acquired Replicate in November 2025, a San Francisco-based ML model deployment platform:
- Enables developers to run, fine-tune, and deploy open-source ML models via API on Cloudflare Workers
- Positions Cloudflare as the "best place on the Internet to build and deploy any AI or agentic workflow"
- Revenue contribution expected to begin in H1 2026
- 80% of leading AI companies already use Cloudflare - Replicate deepens that relationship
- AI inference at the edge represents a potentially $10B+ TAM expansion
Human Native Acquisition (January 2026)
Cloudflare acquired Human Native, an AI data marketplace:
- Brokers transactions between AI developers and content creators
- Positions Cloudflare as the "toll booth" for AI-to-AI transactions in the emerging agentic economy
- Aligns with AI Crawl Control product (customizable 402 HTTP "Payment Required" responses for AI crawlers)
- Early-stage revenue but strategically positions NET for the agentic AI infrastructure thesis
Agentic AI Infrastructure Positioning
As billions of autonomous AI agents begin interacting with the web, Cloudflare is positioned as the security, networking, and compute layer:
- Cloudflare's distributed network (330+ cities) is ideal for low-latency AI inference
- AI Gateway product already serving as the control plane for AI API traffic
- JD Cloud multi-year partnership connects global AI developers with the China market, claiming 80% reduction in inference latency
- This narrative fueled the pre-January 28 rally and remains the key long-term growth story
Medium-Term Catalysts (H2 2026 - H1 2027)
Path to $5 Billion Revenue
Management targets $5B annualized revenue by 2028, implying sustained 28-30%+ growth for 3+ years:
- Achieving the $3B milestone in 2026 would validate the $5B path
- Enterprise customer growth (42% YoY large customer revenue growth in Q3) is the primary driver
- Partner-initiated bookings doubled YoY in Q3 - channel leverage beginning to scale
- Multiple revenue streams (security, CDN, compute, AI inference, R2 storage) diversify growth sources
Innovation Weeks and Product Launches
Cloudflare hosts multiple "Innovation Weeks" annually that serve as product launch events:
- Birthday Week (September), Developer Week, AI Week, Security Week
- Each week generates media coverage, developer mindshare, and sometimes new revenue streams
- Previous Innovation Weeks have produced Workers AI, R2 Storage, D1 Database - major platform additions
- Upcoming weeks will likely focus on agentic AI, edge ML inference, and expanded compute capabilities
Analyst Consensus
Wall Street is broadly bullish on NET:
| Source | Rating | Average Price Target |
|---|---|---|
| TipRanks (25 analysts) | Buy | $253.24 |
| Stock Analysis (26 analysts) | Buy | $231.65 |
| TradingView | Buy | $243.71 |
| TickerNerd (47 analysts) | Buy | $258.00 |
Price Target Range: $111-$131 (bear case) to $318 (bull case)
Implied Upside from $180: 29-43% to consensus targets
FY2026 Consensus Estimates:
- Revenue: ~$2.76B (+28% YoY)
- Non-GAAP EPS: $1.22
Risk Catalysts (Negative)
January 28 Selloff Context
NET dropped 9.9% (~$21/share) on January 28 on profit-taking after a multi-day AI-narrative rally:
- This was NOT driven by fundamental deterioration - no earnings miss, no downgrade, no competitive threat
- The preceding rally was fueled by growing recognition of Cloudflare's role as infrastructure for autonomous AI agents
- High-growth stocks with elevated multiples are prone to violent pullbacks on sentiment shifts
- The 52-week range of $89.42 to $260.00 demonstrates this stock's capacity for large moves
Hyperscaler Competition
AWS, Azure, and Google Cloud are increasingly bundling CDN, WAF, and security services with cloud discounts:
- Large enterprise procurement decisions may favor consolidated cloud vendors
- Cloudflare's cloud-agnostic positioning helps but does not eliminate this risk
- 75% of websites still use no reverse proxy, providing greenfield opportunity, but hyperscalers could target this same market
Gross Margin Pressure
GAAP gross margin declined from 77.7% to 74.0% YoY in Q3 2025:
- Higher paid traffic costs and AI infrastructure investments are compressing margins
- If the margin decline accelerates, profitability timeline extends and multiple compression follows
- Investors will watch Q4 gross margins closely for trend confirmation
Valuation Risk
At ~$64.8B market cap and ~30x forward revenue with negative GAAP earnings:
- NET is priced for 28%+ sustained growth for multiple years
- Any deceleration below 25% could trigger 20-30% multiple compression
- GAAP unprofitability (Q3 net loss of $1.3M, improving from $15.3M) means limited fundamental floor
- High stock-based compensation remains a dilution concern
Price Targets & Probabilities
Using gamma levels, implied move data, and upcoming catalysts, here are the scenarios through June 2027 expiration (with near-term focus on Q4 earnings):
Bull Case (30% probability)
Target: $210-$260 (near-term), $200-$243 sustained through expiration
How we get there:
- Q4 earnings crush expectations with revenue above $620M and 2026 guidance above $2.8B
- $3B annualized revenue run-rate achieved by Q3 2026, ahead of schedule
- Replicate integration drives measurable AI inference revenue in H1 2026
- Agentic AI narrative strengthens as enterprise adoption of AI agents accelerates
- Net retention rate climbs above 120%, validating platform expansion
- Multiple analyst upgrades push consensus target above $260
- Breaks through $200 gamma resistance and establishes new trading range
Put trade outcome: Seller keeps entire $9.5M premium. Puts expire worthless. Annualized return on capital committed: ~11.5% ($9.5M / $48.4M notional / 1.4 years).
Base Case (45% probability)
Target: $160-$210 range (NET consolidates and grinds higher)
Most likely scenario:
- Q4 earnings meet or slightly beat expectations (~$610-620M revenue)
- 2026 guidance roughly in-line at $2.7-2.8B (no upside surprise)
- Growth stays in the 25-30% range - solid but not accelerating
- Stock trades between $160-$210 for most of the 17-month period
- Occasional pullbacks on profit-taking (like January 28) followed by recovery
- Gross margin stabilizes in the 73-75% range
- AI narrative creates volatility but fundamental execution remains steady
Put trade outcome: Seller keeps $9.5M premium. Puts expire worthless or with minimal intrinsic value. This is the seller's expected scenario - steady income with NET staying well above $160.
Bear Case (25% probability)
Target: $130-$160 (TEST THE PUT STRIKE)
What could go wrong:
- Q4 earnings disappoint or 2026 guidance comes in below $2.6B, signaling growth deceleration
- Gross margins compress below 72%, raising questions about profitability timeline
- Hyperscaler competition intensifies - AWS/Azure win major enterprise deals away from Cloudflare
- Broader tech selloff drags high-multiple software names down 30-40%
- AI narrative fades as enterprise AI agent deployment takes longer than expected
- $3B revenue run-rate target missed or pushed to 2027
- Break below $160 gamma support triggers momentum selling to $130-$140
- Macro recession risk compresses enterprise IT budgets
Critical support levels:
- $175: First gamma support - moderate buying expected
- $170: Secondary floor
- $165: Deep support
- $160: MAJOR gamma support + this put strike - the line in the sand
- $155: Monthly implied move lower boundary - below here gets ugly
Put trade outcome at various prices on expiration:
- Stock at $160: Puts at-the-money, seller essentially breakeven (keeps $31.60 premium, assigned at $160, cost basis $128.40)
- Stock at $150: Puts worth $10, seller net gain = $21.60/share ($31.60 premium - $10 intrinsic). Assigned at effective $128.40.
- Stock at $130: Puts worth $30, seller net gain = $1.60/share ($31.60 - $30). Barely profitable but owns stock at $128.40.
- Stock at $120: Puts worth $40, seller net LOSS = $8.40/share ($31.60 - $40). This is where the trade loses money.
The breakeven is $128.40. NET would need to fall 29% from current levels AND stay there for the seller to lose money. That is a significant margin of safety.
Trading Ideas
Conservative: Follow the Institutional Lead with a Smaller Put Sell
Play: Sell cash-secured puts at the $160 strike with a shorter expiration to capture elevated IV
Structure: Sell NET $160 puts at the March 2026 or June 2026 expiration
Why this works:
- You are copying the exact institutional trade but with less time risk
- $160 is 10.6% below current price AND sits on major gamma support
- Implied volatility is elevated (13.1% monthly implied move) - you are selling expensive insurance
- Even if NET pulls back on Q4 earnings, $160 provides significant cushion
- Analyst consensus ($232-$253) is 29-43% ABOVE current price - the Street does not see $160 as realistic
- Effective cost basis if assigned would be well below current price (exact premium depends on expiration chosen)
Risk management:
- Only sell puts on a stock you would be happy to OWN at the strike price
- Set aside full cash to cover assignment ($16,000 per contract at $160 strike)
- Size appropriately: 1-3 contracts for most retail accounts (max $48,000 capital committed)
- If NET drops below $170, evaluate whether to close for a loss or accept potential assignment
Risk level: Moderate (defined risk, bullish directional) | Skill level: Intermediate
Expected outcome: If NET stays above $160 through expiration, keep entire premium. If assigned, own NET at a significant discount to current price.
Balanced: Bull Put Spread into Earnings
Play: Sell a put spread below current price to profit from NET staying above support through Q4 earnings
Structure: Sell $170 puts / Buy $160 puts, February or March 2026 expiration
Why this works:
- Defined risk: Maximum loss is $10 per spread minus premium received (~$600-700 max risk per spread)
- $170 is below immediate gamma support at $175, giving cushion after the January 28 pullback
- $160 long put sits exactly at the institutional support level
- Earnings expected February 5-10 - if NET beats (as it did in Q3 by 108% on EPS), stock rallies and both puts expire worthless
- You are selling elevated pre-earnings IV, which will collapse after the report
- Even if NET dips on earnings, it needs to fall below $170 (another 5.5% from here) for the trade to be at risk
Estimated P&L (adjust after seeing current premiums):
- Premium received: ~$3.00-4.00 net credit per spread
- Max profit: $300-400 per spread if NET above $170 at expiration
- Max loss: $600-700 per spread if NET below $160 at expiration
- Breakeven: ~$166-167
- Risk/Reward: ~1:1.5 to 1:2
Entry timing:
- Enter before February 5 earnings to capture pre-earnings IV premium
- If NET drops below $175 before earnings, reconsider sizing or wait
- Close position within 2-3 days after earnings if profitable (do not hold to expiration if you have 80%+ of max profit)
Position sizing: Risk only 2-5% of portfolio per spread. 1-5 spreads for most retail accounts.
Risk level: Moderate (defined risk) | Skill level: Intermediate
Aggressive: Long NET Stock on Earnings Pullback with Covered Call
Play: Buy NET shares on any further pullback toward $170-175, then sell covered calls to reduce cost basis
Structure: Buy 100 shares of NET at $170-175 if available. Sell 1x March 2026 $200 call against the position.
Why this could work:
- NET is already down 10% from recent highs after the January 28 selloff - buying the dip
- $170-175 entry gives you a price below the $180 gamma support - buying at a level where market makers are hedging buyers
- The $200 call sale collects premium, further reducing cost basis to ~$160-165 range
- Analyst consensus of $232-$253 implies 33-49% upside from a $175 entry
- Q4 earnings could be the catalyst: Q3 beat by 108% on EPS, and Cloudflare has a strong beat-and-raise track record
- 60% YTD gain shows momentum - institutions are accumulating, not distributing
- If NET rallies past $200, you keep stock appreciation from $175 to $200 (14% gain) PLUS the call premium
Why this could go wrong (SERIOUS RISKS):
- Earnings miss: If Q4 disappoints or 2026 guidance is weak, NET could fall 15-20% from entry
- Valuation risk: At 30x forward revenue, any growth deceleration amplifies downside
- Capital intensive: 100 shares at $175 = $17,500 commitment
- Capped upside: Covered call limits profit if NET rockets above $200 on a blowout quarter
- Volatility: This stock moved from $89 to $260 in a year - it can easily drop $30-40 on bad news
Risk management:
- Use a stop-loss at $155 (below $160 gamma support) to limit downside to ~$15-20/share
- Only enter if you have a 6-12 month time horizon - this is NOT a trade, it is a position
- Size to no more than 5-10% of portfolio given volatility profile
- If assigned on covered call at $200, take the profit and move on
Risk level: HIGH (concentrated single-stock risk) | Skill level: Advanced
Probability of profit: ~55-60% based on analyst consensus and historical earnings beat rate
Risk Factors
Do not ignore these potential landmines:
-
Q4 earnings binary event in less than 2 weeks: Results expected February 5-10 create significant volatility risk. Options are pricing a +/-13.1% move through February OPEX. While Cloudflare has a strong beat-and-raise track record (Q3 EPS beat by 108%), the elevated valuation means even a solid quarter with cautious guidance could trigger selling. The 2026 revenue guidance number (~$2.76B consensus) is THE number to watch.
-
Valuation at extreme levels: At ~30x forward revenue and negative GAAP earnings, NET is priced for 28%+ sustained growth for years. Any deceleration below 25% could trigger 20-30% multiple compression - potentially sending the stock toward the $130-$140 range. The 52-week range of $89.42 to $260.00 shows how fast sentiment can shift at these multiples.
-
Gross margin compression trend: GAAP gross margin fell from 77.7% to 74.0% YoY in Q3. Higher paid traffic costs and AI infrastructure investments are the drivers. If this trend continues, it pushes GAAP profitability further out and could lead to multiple compression. Watch Q4 margins closely.
-
Hyperscaler competitive threat: AWS, Azure, and Google Cloud are bundling CDN/WAF/security with cloud discounts. While Cloudflare's cloud-agnostic positioning helps, large enterprise procurement decisions increasingly favor consolidated vendors. Losing a few major enterprise deals could meaningfully impact the growth trajectory.
-
January 28 selloff signals fragility: NET dropped 9.9% in a single session on pure profit-taking - no fundamental catalyst. When a stock falls 10% on no news, it tells you the shareholder base is nervous about valuation. Another round of selling could easily take NET to $165-170 before finding support.
-
AI narrative could fade: The recent rally was driven by growing recognition of Cloudflare's role in agentic AI infrastructure. If enterprise AI agent adoption takes longer than expected, or if the revenue contribution from AI products disappoints, the narrative premium unwinds. AI hype cycles have burned investors before.
-
GAAP profitability still missing: Despite improving from a $15.3M net loss to a $1.3M net loss in Q3, Cloudflare remains GAAP unprofitable. High stock-based compensation dilutes existing shareholders. At some point, the market will demand GAAP profits, not just non-GAAP adjustments.
-
$3B revenue target is aggressive: Reaching $3B annualized revenue by Q4 2026 requires ~$750M quarterly revenue, a 27% acceleration from the current ~$590M pace. Missing this self-imposed target would damage management credibility and could trigger a selloff to the $140-$160 range.
-
Macro headwinds if recession emerges: Enterprise IT budgets are among the first to be cut in a downturn. At 30x forward revenue with no GAAP profit cushion, NET has zero recession protection. A downturn could compress the multiple AND slow revenue growth simultaneously.
The Bottom Line
Real talk: An institution just sold $9.5M in LEAP puts at $160 on a stock trading at $179. This is not a defensive hedge or a nervous trade - this is a confident, patient bet that Cloudflare will not fall below $160 over the next 17 months. The seller is essentially saying: "Pay me $9.5M now, and if NET somehow falls to $160, I will happily buy 302,200 shares at an effective price of $128.40."
What this trade tells us:
- Sophisticated player has EXTREME long-term conviction in NET above $160
- The $160 strike aligns perfectly with the deepest gamma support level - this is calculated positioning
- 17 months of time horizon means this trader is not worried about near-term volatility (including Q4 earnings)
- Effective cost basis of $128.40 (29% below current price) provides massive margin of safety
- Zero prior open interest means this is a NEW thesis, not a position adjustment
- The $31.60 premium is rich - the seller is harvesting elevated implied volatility in NET options
This is a STRONG bullish signal - but with nuance. The seller is not betting NET goes to $250. They are betting NET does not go below $160. There is an important difference. This is a floor-setting trade, not a ceiling-reaching trade.
If you own NET:
- The institutional put sell at $160 validates your long thesis - smart money sees $160 as a hard floor
- Consider the January 28 pullback (-10%) as normal consolidation, not a trend reversal
- Q4 earnings (Feb 5-10) is the next major catalyst - hold through if your thesis is intact
- If you are sitting on large gains, trimming 15-25% into Q4 earnings is prudent risk management
- Set a mental stop at $160 (major gamma support + institutional conviction level)
If you are watching from the sidelines:
- Do NOT chase the stock at $180 right before earnings - wait for the report
- Post-earnings pullback to $165-175 would be a strong entry aligned with institutional positioning
- Looking for confirmation of: Q4 revenue beat, 2026 guidance above $2.76B, large customer count growth, net retention stability
- Longer-term (6-12 months), the $3B revenue run-rate target and agentic AI infrastructure positioning are legitimate catalysts for $200+
- The analyst consensus of $232-$253 implies 29-43% upside - but that requires flawless execution
If you are bearish:
- Respect the $160 gamma support and institutional conviction level - do not short into this floor
- A break below $160 would be a significant technical and fundamental shift - that is your trigger
- Post-earnings put spreads ($175/$165 or $170/$160) offer defined-risk downside plays after IV crush
- Watch for: growth deceleration below 25%, gross margin below 72%, 2026 guidance miss
Mark your calendar - Key dates:
- February 5-10, 2026 - Q4 FY2025 earnings report (LESS THAN 2 WEEKS)
- February 20, 2026 - Monthly OPEX (+/-13.1% implied move window closes)
- March 20, 2026 - Quarterly expiration
- Late April / Early May 2026 - Q1 FY2026 earnings (first 2026 data point)
- H1 2026 - Replicate integration revenue contribution begins
- Q4 2026 - $3B annualized revenue run-rate target date
- June 17, 2027 - This $9.5M put trade expires
Final verdict: Cloudflare's positioning at the intersection of AI infrastructure, edge computing, and cybersecurity is genuinely compelling. With 80% of leading AI companies already on the platform, 31% revenue growth, 119% net retention, and a clear path to $3B in annualized revenue, the growth story is intact. The $9.5M institutional put sell at $160 with a $128.40 effective cost basis is a powerful endorsement of the long-term floor. But at 30x forward revenue with Q4 earnings imminent, near-term entry requires patience and discipline.
Let earnings clear. If the numbers are strong, the stock will reward patience at $170-180. If they disappoint, the $160-165 zone gives you an institutional-grade entry point with gamma support underneath. Either way, Cloudflare is building the infrastructure layer for the next era of the internet - and smart money just bet $9.5M that the floor is $160.
Disclaimer: Options trading involves substantial risk of loss and is not suitable for all investors. This analysis is for educational purposes only and not financial advice. Past performance does not guarantee future results. Selling puts carries the risk of being assigned shares at the strike price, which could result in significant losses if the stock declines substantially below the effective cost basis. The institutional trade described reflects one participant's positioning and does not imply the trade will be profitable or that you should replicate it. Always do your own research and consider consulting a licensed financial advisor before trading. Earnings create binary event risk with potential for 10%+ gaps in either direction. Position sizing and risk management are critical.
About Cloudflare, Inc.: Cloudflare is a software company offering security and web performance through a distributed, serverless CDN. Products include DDoS protection, DNS, zero trust security, and edge computing, with a market cap of $64.8 billion in the Services - Prepackaged Software industry.