NOW Put Diagonal Spread - $19.2M Institutional Hedging Before Earnings!
January 20, 2026 | Unusual Activity Detected
The Quick Take
Institutional traders just deployed $19.2M in a sophisticated put diagonal spread on ServiceNow (NOW), buying 7,500 June $120 puts while rolling February $128 puts and selling May $110 puts. This isn't typical retail hedging - it's a multi-leg positioning strategy ahead of Q4 earnings on January 28. With NOW down 23% YTD and the DOJ investigation hanging over the company, smart money is building downside protection while collecting premium. Translation: Someone's paying serious money to protect against further downside while the stock trades near $127.
Company Overview
ServiceNow, Inc. (NOW) provides software solutions that structure and automate various business processes via a SaaS delivery model:
- Market Cap: $134.3B
- Industry: Prepackaged Software (SIC 7372)
- Current Price: $125.34 (down 23% YTD)
- Total Employees: 26,293
- Headquarters: Santa Clara, CA
- Primary Business: IT service management, customer service, HR operations, security operations, and application development platforms
ServiceNow completed a landmark 5-for-1 stock split in December 2025 and announced its largest-ever acquisition (Armis for $7.75B), signaling aggressive expansion into cybersecurity. Despite strong fundamentals, the stock has been pressured by DOJ-related executive departures and broader market concerns.
The Option Flow Breakdown
What Just Happened
| Date | Time | Symbol | Buy/Sell | Call/Put | Expiration | Strike | Volume | Premium |
|---|---|---|---|---|---|---|---|---|
| 2026-01-20 | 11:49:52 | NOW | BUY | PUT | 2026-06-18 | $120 | 7,500 | $7.2M |
| 2026-01-20 | 09:58:55 | NOW | BUY | PUT | 2026-02-20 | $128 | 4,800 | $3.6M |
| 2026-01-20 | 09:58:55 | NOW | BUY | PUT | 2026-02-20 | $128 | 9,700 | $3.6M |
| 2026-01-20 | 09:58:55 | NOW | SELL | PUT | 2026-05-15 | $110 | 4,800 | $2.4M |
| 2026-01-20 | 09:58:55 | NOW | SELL | PUT | 2026-05-15 | $110 | 9,700 | $2.4M |
What This Actually Means
This is a complex multi-leg positioning strategy combining several elements:
- Long June $120 Puts ($7.2M): Core downside protection through June expiration - gives 5 months of coverage through Armis acquisition uncertainty
- February $128 Put Activity ($7.2M combined): Mix of closing existing positions (4,800 contracts) and opening new near-term protection (9,700 contracts) - ATM puts for earnings protection
- Short May $110 Puts ($4.8M collected): Selling downside puts to offset premium cost - only at risk if NOW drops 13%+ to $110
Net positioning: This trader is bearish-to-neutral with defined risk. They're willing to buy stock at $110 if it crashes there, but they want protection from $128 down to $120 through the earnings event and beyond.
Size context: The Z-scores of 33-2,620 indicate these are extremely unusual trades. The $110 May put volume relative to open interest (Vol/OI ratios of 400x and 808x) shows this is brand new positioning - someone is building a significant hedge on NOW here.
Technical Setup / Chart Check-Up
YTD Performance
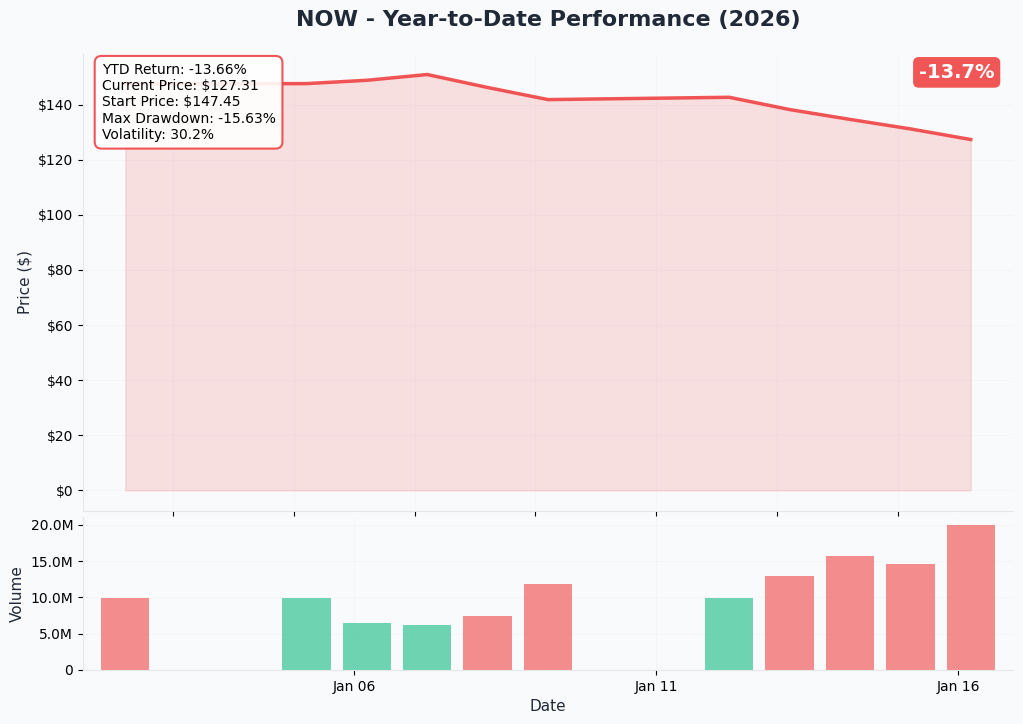
ServiceNow has had a rough start to 2026, continuing the decline from late 2025. After the December stock split adjusted shares from ~$850 pre-split to ~$170 post-split reference price, the stock has traded down to current levels around $125-128.
Key observations:
- Down 23% YTD - significant underperformance vs broader software indices
- 30-day decline from $162.4B market cap to $132.2B
- Trading near post-split lows despite strong Q3 2025 earnings beat
- DOJ investigation and executive departures weighing on sentiment
Gamma-Based Support & Resistance Analysis
Current Price: $125.34
The gamma exposure map reveals key levels where dealer hedging will create price friction:
Support Levels (Put Gamma):
- $125 - Immediate support with -2.70 net GEX, strongest nearby floor (0.3% below current price)
- $120 - Major support zone with -3.12 net GEX (4.3% below current price) - aligns with the June put strike!
Resistance Levels (Call Gamma):
- $128 - First resistance with -3.57 net GEX (2.1% above) - exactly where February puts are being bought
- $130 - Neutral zone with +0.26 net GEX (3.7% above)
- $132 - Secondary resistance with -1.24 net GEX (5.3% above)
- $135-$140 - Extended resistance band
Summary:
- Strongest support: $125
- Strongest resistance: $128
- Net GEX Bias: Bearish (total put gamma 37.3 vs call gamma 24.9)
What this means: The negative net gamma environment means dealers are short gamma - they'll need to sell into declines and buy into rallies, potentially amplifying moves in both directions. The $125 support and $128 resistance create a tight range heading into earnings.
Implied Move Analysis
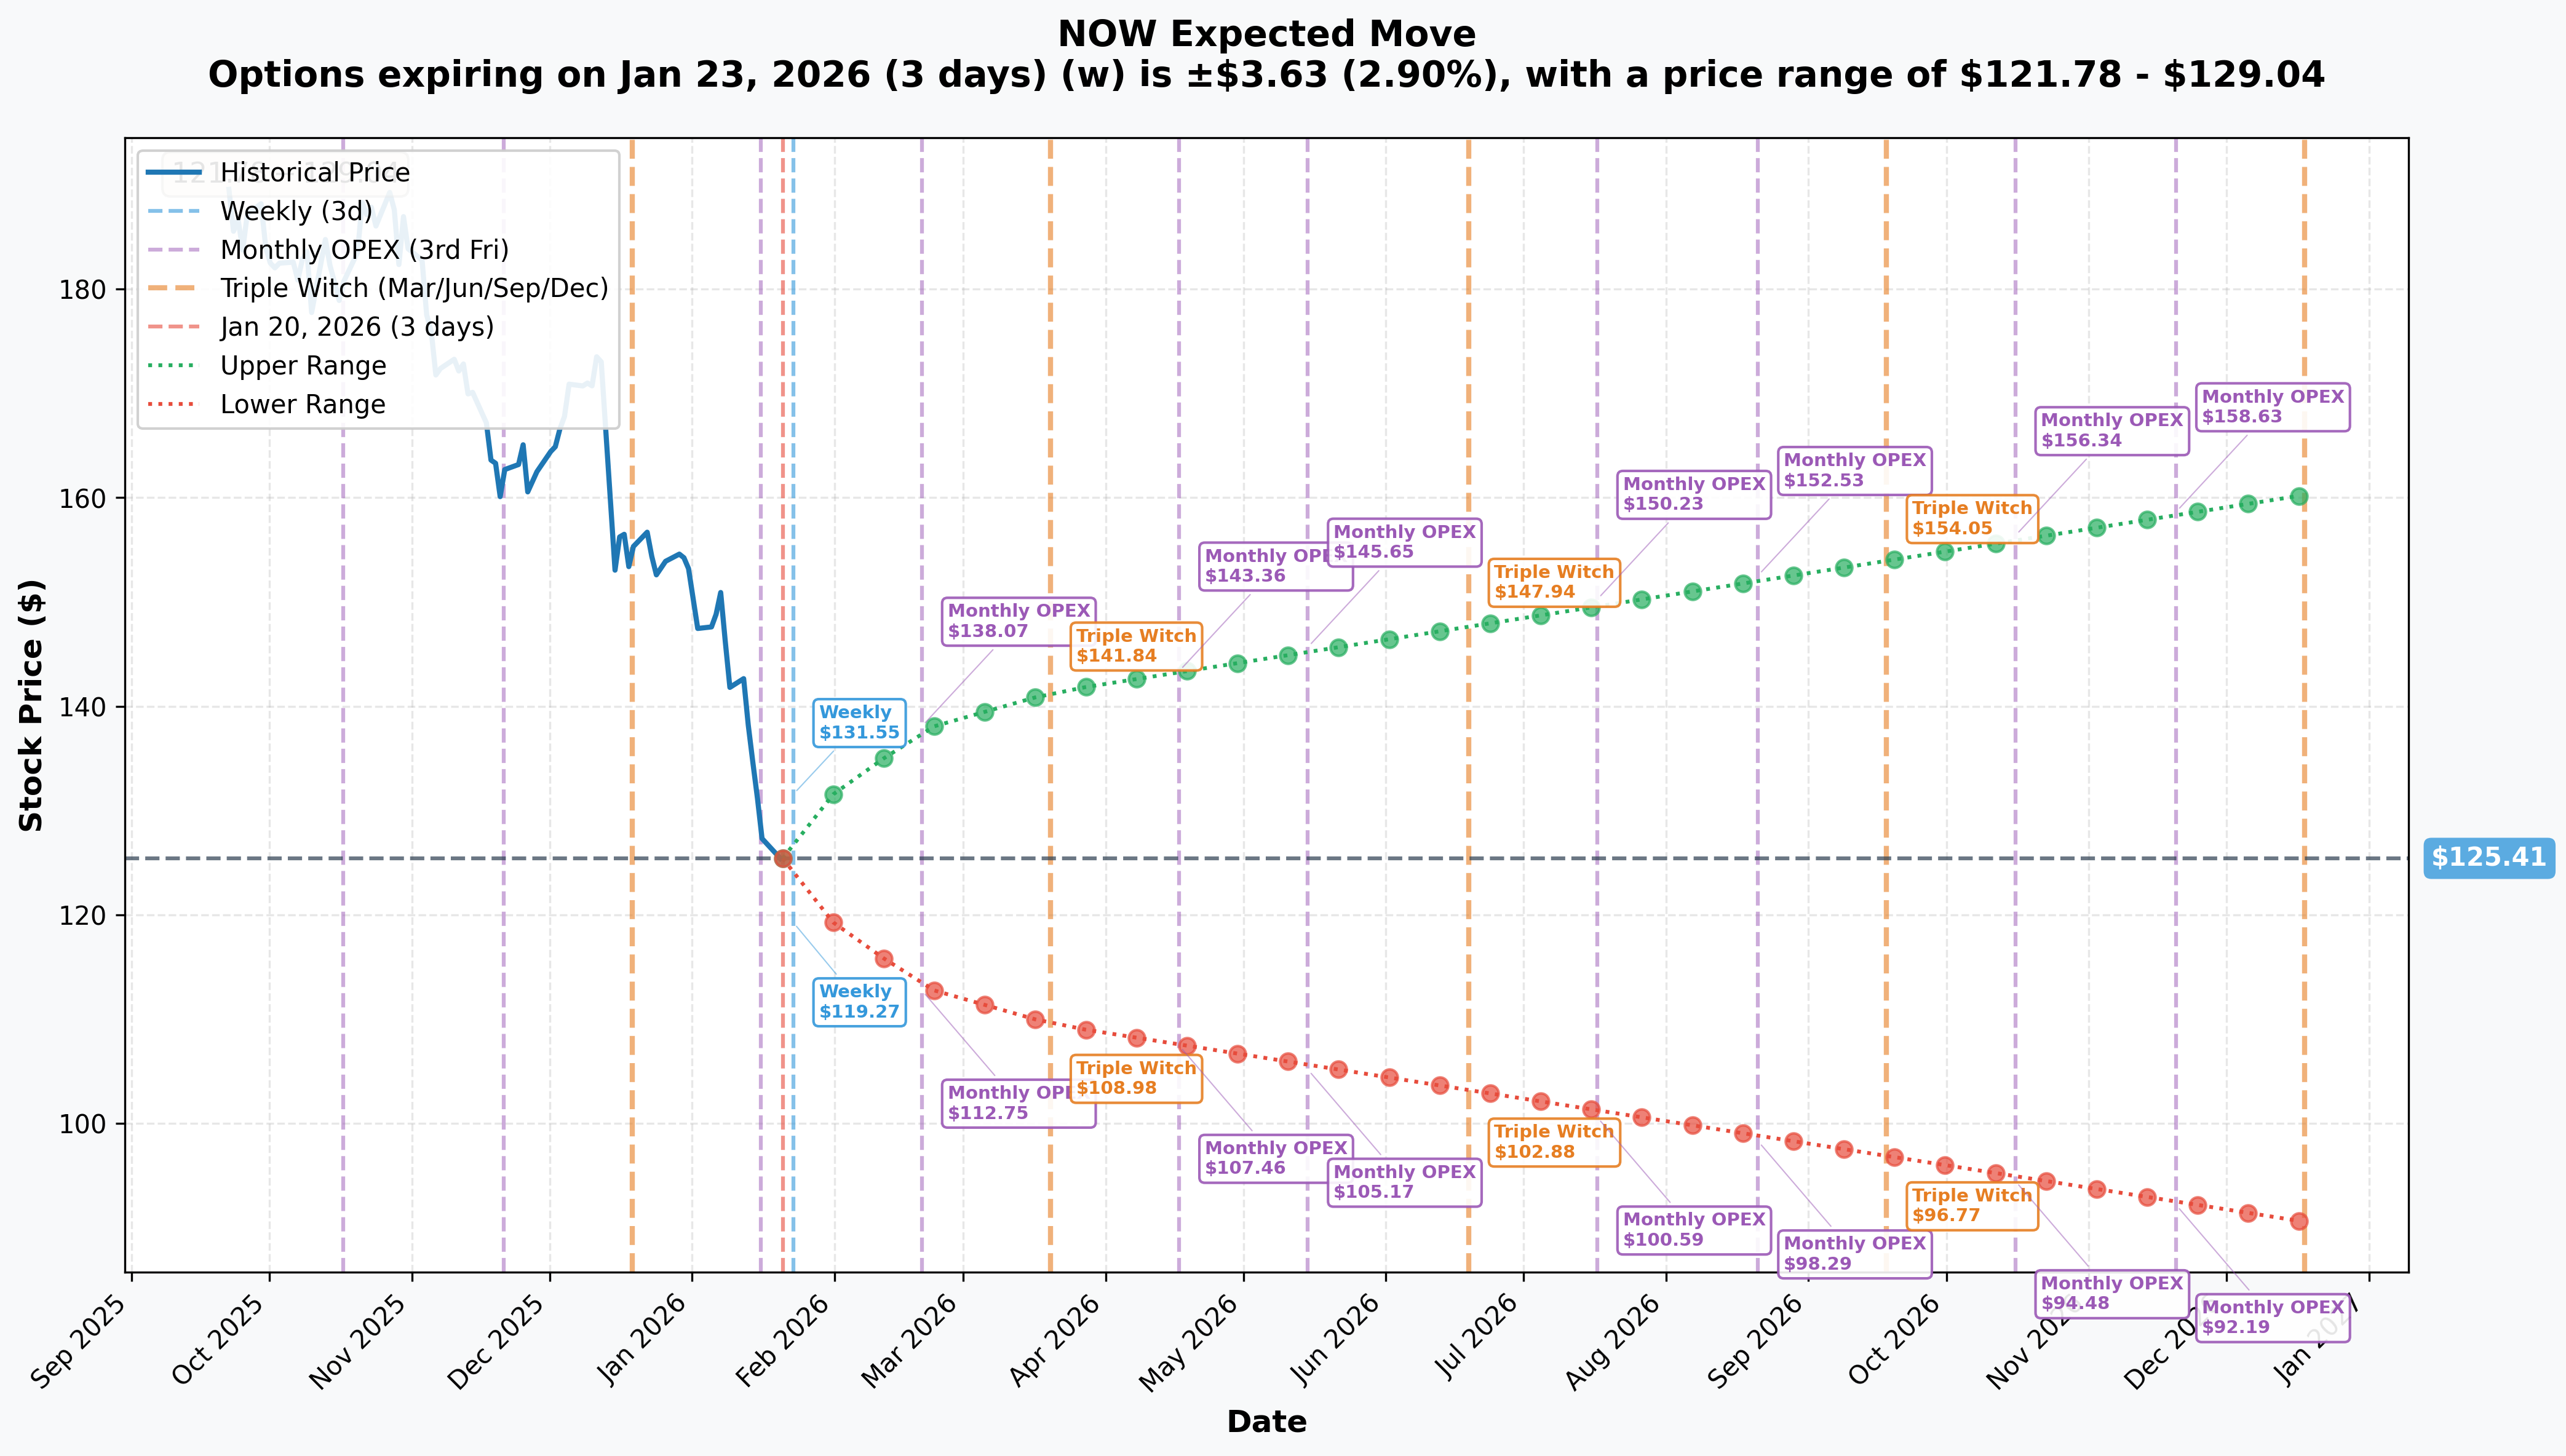
Options market pricing for upcoming expirations:
| Timeframe | Expiry Date | Days | Implied Move % | Implied Move $ | Upper Range | Lower Range |
|---|---|---|---|---|---|---|
| Weekly | 2026-01-23 | 3 | 2.9% | $3.63 | $129.04 | $121.78 |
| Monthly OPEX | 2026-02-20 | 31 | 9.9% | $12.41 | $137.82 | $113.00 |
| Triple Witch | 2026-03-20 | 59 | 12.7% | $15.94 | $141.35 | $109.47 |
| LEAPS | 2026-12-18 | 332 | 27.8% | $34.89 | $160.30 | $90.52 |
Translation: The options market expects a 9.9% move by February expiration (when the $128 puts expire) - that's a range of $113-$138. The $120 June put strike sits right at the lower boundary of the quarterly implied move ($109.47). This positioning suggests the trader expects NOW could test the low end of the implied range if earnings disappoint or DOJ news worsens.
Catalysts
Upcoming Catalysts
Q4 2025 Earnings Release - January 28, 2026 (8 DAYS AWAY!)
ServiceNow will report Q4 results after market close on Wednesday, January 28. This is the primary catalyst driving today's unusual options activity.
Consensus Expectations:
- EPS: $0.72 - $0.88 (estimates vary)
- Focus: Full-year 2025 results and 2026 guidance
Key Metrics to Watch:
- Subscription revenue growth trajectory toward $12.84B FY guidance
- Now Assist customer expansion beyond 1,700
- cRPO growth and deal pipeline commentary
- Initial FY2026 guidance (consensus: 18.1% revenue growth, 16.8% EPS growth)
- Integration timeline and cost updates for Armis/Moveworks acquisitions
- Federal sector commentary following DOJ investigation
Catalyst Probability: HIGH - Citi initiated "upside 30-day catalyst watch" citing channel checks indicating strong quarter-end close.
Armis Acquisition Closing - H2 2026
The $7.75B Armis acquisition is expected to close in the second half of 2026, subject to regulatory approvals. This is ServiceNow's largest deal ever and represents significant integration risk.
Knowledge 2026 Conference - May 5-7, 2026
ServiceNow's annual conference in Las Vegas will showcase the Australia release and agentic AI roadmap updates. Registration open with $200 discount before February 28.
Recent Catalysts (Already Happened)
Q3 2025 Earnings Beat (October 29, 2025)
ServiceNow delivered a strong beat on all key metrics:
- Revenue: $3.41B vs $3.36B consensus (+1.4% beat)
- Adjusted EPS: $4.82 vs $4.27 consensus (+13% beat)
- cRPO: $11.35B (+21% YoY)
- Now Assist: 1,700+ customers live on AI platform
5-for-1 Stock Split (December 2025)
Shareholders approved the split on December 4, trading began on split-adjusted basis December 18. First stock split in company history.
$12B+ Acquisition Spree (2025)
ServiceNow completed seven acquisitions in 2025, its most active year ever:
- Armis ($7.75B) - OT/IoT security
- Veza - Identity security
- Moveworks - Agentic AI copilot
- Data.World - Data catalog
- Logic.ai, Cuein AI - AI capabilities
DOJ Investigation & Executive Departures
ServiceNow reported potential compliance issues to the DOJ related to a government contract. President and COO CJ Desai resigned following an internal investigation.
Price Targets & Probabilities
Based on gamma levels, implied move data, and the earnings catalyst:
Bull Case (25% probability)
Target: $140-$150
How we get there:
- Q4 earnings beat with strong FY2026 guidance
- DOJ investigation concerns fade without material impact
- Now Assist AI adoption accelerates, demonstrating competitive moat
- Armis acquisition receives regulatory green light with clear integration roadmap
- Break above $130 gamma resistance triggers momentum buying
Key gamma level: $140 shows -1.47 net GEX - significant resistance that would require sustained buying to overcome.
Base Case (50% probability)
Target: $120-$130 range
Most likely scenario:
- Solid earnings meeting lowered expectations
- Conservative FY2026 guidance citing Armis integration costs
- Stock consolidates between strong support ($125) and resistance ($128)
- Market waits for more clarity on DOJ investigation and acquisition integration
- Implied move of 9.9% through February suggests range-bound trading
This aligns with the institutional positioning: The put diagonal structure profits if NOW stays between $110-$128 - essentially betting on continued uncertainty without a collapse.
Bear Case (25% probability)
Target: $105-$115
What could go wrong:
- Earnings miss or weak guidance disappoints
- DOJ investigation escalates with material consequences
- Armis integration concerns grow, deal delays announced
- Federal sector pullback impacts government contracts (DOGE budget cuts)
- Break below $120 support triggers stop-losses
Key support: $110 (where May puts were sold) represents a major floor where institutional buyers are willing to step in.
Trading Ideas
Conservative: Covered Position / Wait for Clarity
Play: If you own NOW, consider protective put or collar through earnings
Why this works:
- Earnings in 8 days creates binary event risk
- 23% YTD decline suggests negative sentiment already priced in
- DOJ overhang creates headline risk beyond fundamentals
- Implied volatility elevated - options expensive but protection warranted
Action plan:
- If long NOW, buy Feb $125 puts for earnings protection (~$5-6 per contract)
- Or sell Feb $135 calls against shares to create collar
- Wait for post-earnings clarity before adding to position
- Strong analyst consensus (51% upside to targets) suggests long-term value if near-term noise clears
Risk level: Low | Skill level: Beginner-friendly
Balanced: Put Spread Following Institutional Lead
Play: Buy February $125/$115 put spread
Why this works:
- Follows institutional flow direction (bearish lean)
- Defined risk through earnings event
- Break below $125 gamma support could accelerate move to $115
- Implied move suggests $113 lower bound by February - this trade profits if we get there
Structure:
- Buy Feb 20 $125 put (~$6.50)
- Sell Feb 20 $115 put (~$2.50)
- Net debit: ~$4.00 ($400 per spread)
P&L:
- Max profit: $600 if NOW at/below $115 at Feb expiration
- Max loss: $400 (premium paid)
- Breakeven: $121
Risk level: Moderate | Skill level: Intermediate
Aggressive: Earnings Put Calendar
Play: Sell Feb $120 put, buy June $120 put (replicating institutional trade)
Why this works:
- Mimics the institutional diagonal structure
- Collects elevated February IV while owning longer-dated protection
- Profits from IV crush post-earnings if stock stays above $120
- Maintains downside protection through June if stock weakens over time
Structure:
- Sell Feb 20 $120 put (~$3.00)
- Buy June 18 $120 put (~$9.60)
- Net debit: ~$6.60 ($660 per calendar)
P&L:
- If NOW above $120 at Feb expiration: Feb put expires worthless, June put retains value
- If NOW below $120: Complex outcome depending on timing and magnitude of move
- Max loss: Premium paid ($660) if NOW rallies significantly
Risk level: High | Skill level: Advanced
Risk Factors
Don't ignore these potential landmines:
-
Earnings binary event in 8 days: Q4 results January 28 after close create significant volatility risk. Implied move of 9.9% suggests $12+ swing possible.
-
DOJ investigation uncertainty: Compliance issues related to government contracts and executive departures create regulatory overhang. Resolution timeline unknown.
-
Acquisition integration risk: $12B+ in 2025 acquisitions requires significant integration effort. Armis ($7.75B) is largest deal in company history.
-
Federal sector exposure: DOGE contract terminations and 5.8% reduction in professional services spending could impact government revenue.
-
Competitive pressure: Salesforce Agentforce, Microsoft Agent 365, SAP Joule competing for enterprise AI dominance. GSA OneGov deal required 70% discounts to secure government contracts.
-
Insider selling: 64 sales, 0 purchases in 6 months including CEO McDermott selling 9,460 shares for ~$8.84M.
-
Bearish gamma environment: Net GEX bias is bearish with total put gamma exceeding call gamma. This could amplify downside moves if selling pressure emerges.
-
Premium valuation despite decline: Even after 23% YTD drop, NOW trades at premium multiples requiring strong execution to justify.
The Bottom Line
Real talk: Institutional traders just built a $19.2M multi-leg put structure heading into ServiceNow's earnings. They're not betting on a collapse - they're building sophisticated downside protection while collecting premium. The combination of long June $120 puts, February $128 puts, and short May $110 puts creates a hedge that profits from continued uncertainty in the $110-$128 range.
What this trade tells us:
- Smart money expects volatility around earnings but not necessarily catastrophe
- The $110-$120 range represents institutional "buy the dip" levels
- Current price ($125-$128) is considered vulnerable to downside pressure
- June expiration timeframe suggests concerns extend beyond just earnings
If you own NOW:
- Consider adding put protection through February earnings
- Strong analyst consensus (51%+ upside to average targets) suggests long-term value
- But near-term headline risk from DOJ and integration concerns warrants caution
- Use $120 as mental stop - strong gamma support but critical level
If you're watching from sidelines:
- January 28 after close is the moment of truth - mark your calendar
- Wait for earnings clarity before initiating long positions
- Post-earnings pullback to $115-$120 range would be attractive entry
- Knowledge 2026 in May and Armis close in H2 are longer-term catalysts
If you're bearish:
- Put spreads offer defined risk way to play downside
- $120 support and $110 floor are key levels to watch
- Don't fight momentum if earnings beat - institutional positioning suggests range-bound, not collapse
Key dates calendar:
- January 28, 2026: Q4 2025 earnings (after close)
- February 20, 2026: February options expiration (near-term puts expire)
- February 28, 2026: Knowledge 2026 registration discount deadline
- May 5-7, 2026: Knowledge 2026 Conference
- May 15, 2026: May options expiration (short $110 puts expire)
- June 18, 2026: June options expiration (long $120 puts expire)
- H2 2026: Armis acquisition expected close
Final verdict: This institutional activity signals caution, not panic. The sophisticated multi-leg structure suggests professionals expect continued volatility and are positioning accordingly. For retail traders, the safest approach is to wait for earnings clarity before making any directional bets. The 51% analyst upside suggests significant long-term value if ServiceNow executes on its AI and security strategy - but near-term headline risk is real. Be patient, protect existing positions, and look for better entry points post-earnings.
Disclaimer: Options trading involves substantial risk of loss and is not suitable for all investors. This analysis is for educational purposes only and not financial advice. Past performance doesn't guarantee future results. The extremely unusual Z-scores (33-2,620) reflect these trades' size relative to recent history - it does not imply the trades will be profitable or that you should follow them. Always do your own research and consider consulting a licensed financial advisor before trading. Earnings create binary event risk with potential for significant moves in either direction.
About ServiceNow, Inc.: ServiceNow is a leading provider of cloud-based workflow automation software with a $134.3B market cap, serving enterprises globally with IT service management, customer service, HR operations, and security solutions. The company is headquartered in Santa Clara, CA with 26,293 employees.