⚡ Nextracker Deep ITM Covered Call - $90M Institutional Exit Strategy! 💰
📅 October 27, 2025 | 🔥 Unusual Activity Detected
🎯 The Quick Take
Someone just sold 26,000 deep in-the-money calls on Nextracker for a whopping $90M in premium! This massive institutional trade at the $65 strike (while NXT trades at $99.48) suggests smart money is locking in profits after the stock's incredible 139% run in 2025. Translation: Big players are capping their upside and taking chips off the table ahead of November 12th Capital Markets Day!
📊 Company Overview
Nextracker Inc. (NXT) is a leading provider of intelligent, integrated solar tracker and software solutions with:
- Market Cap: $14.54 Billion
- Industry: Search, Detection, Navigation, Guidance, Aeronautical Systems (Solar Tracking Technology)
- Primary Business: Solar tracking systems and AI-powered software that optimize utility-scale solar projects globally
- Market Position: #1 global market share for 10 consecutive years (~26% of worldwide market)
📊 The Option Flow Breakdown
The Tape (October 27, 2025 @ 10:04:38):
| Time | Symbol | Side | Buy/Sell | Type | Expiration | Premium | Strike | Volume | OI | Size | Spot | Option Price |
|---|---|---|---|---|---|---|---|---|---|---|---|---|
| 10:04:38 | NXT | MID | SELL | CALL | 2026-01-16 | $90M | $65 | 26K | 30K | 26,000 | $99.48 | $34.80 |
🤓 What This Actually Means
This is a classic covered call strategy - institutional money monetizing their massive gains! Here's what's happening:
- Selling deep in-the-money $65 calls while stock trades at $99.48
- Collecting $90M in premium ($34.80 × 26,000 contracts)
- These calls have $34.48 in intrinsic value ($99.48 - $65) plus just $0.32 in time value
- Effective exit price: ~$99.80 per share ($65 strike + $34.80 premium received)
- Almost certainly a covered call against existing long stock position
What's the play? The seller is willing to cap their upside at roughly current levels (~$100) in exchange for immediate cash. With the stock up 139% YTD, this is smart profit-taking disguised as premium collection!
Unusual Score: High volume activity - 26K contracts against 30K open interest represents significant institutional positioning
📈 Technical Setup / Chart Analysis
YTD Performance Chart
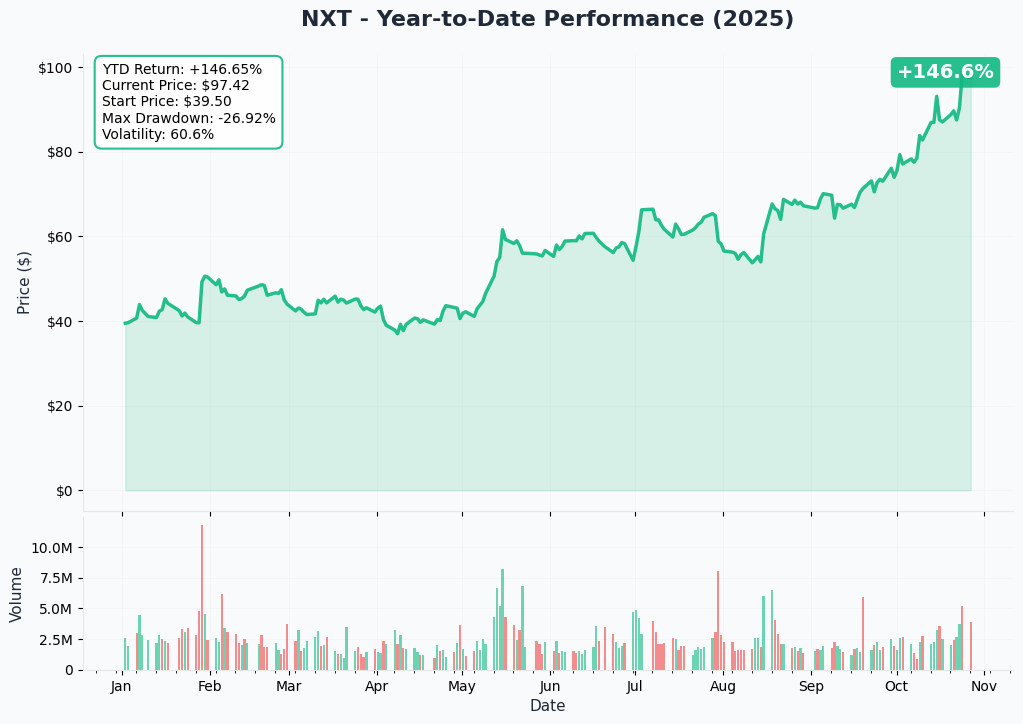
Nextracker has been an absolute monster in 2025! The stock has skyrocketed 139% year-to-date, climbing from the low $40s to nearly $100.
Key observations:
- Parabolic move: From $42 in early 2025 to $99.48 currently
- Recent momentum: Strong Q2 FY2026 earnings (October 23) drove latest surge
- Technical position: Trading at all-time highs with minimal resistance overhead
- Volume profile: Institutional accumulation throughout the year
Gamma-Based Support & Resistance Analysis
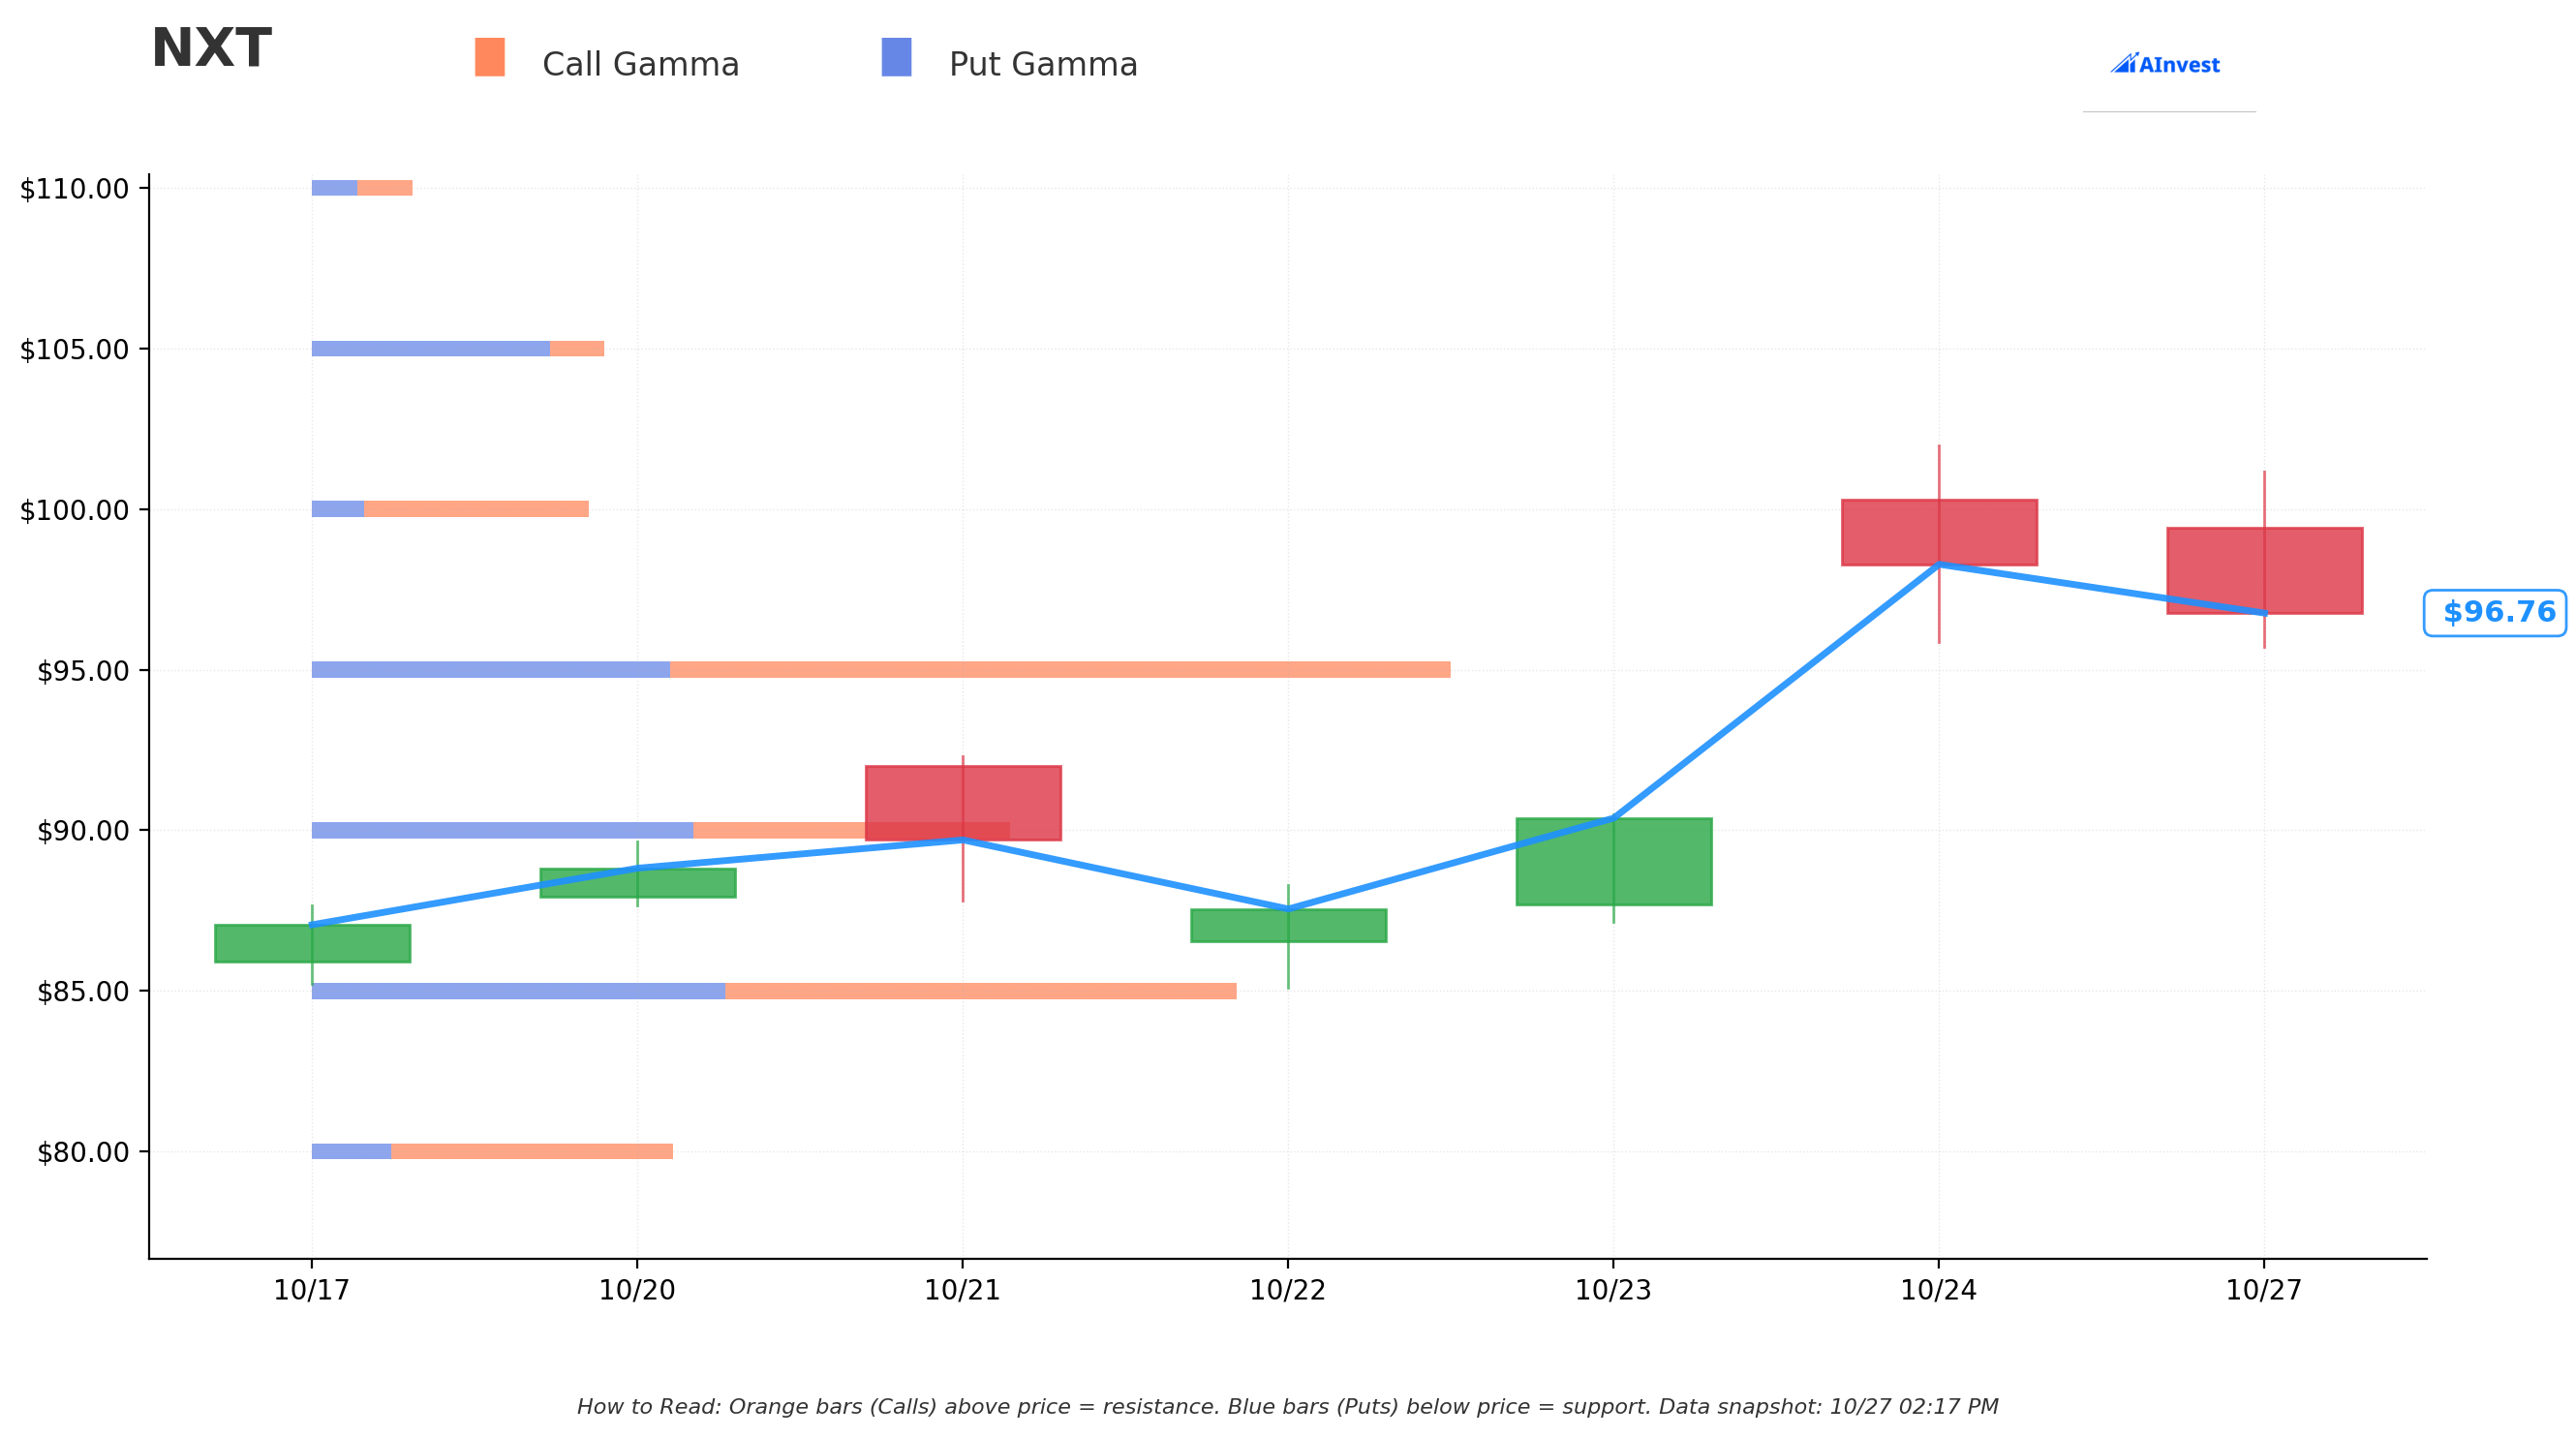
Current Price: $99.48
The gamma chart reveals critical levels that explain this profit-taking trade:
🔵 Support Levels (Put Gamma):
- $95 - Strongest Support: 2.04M total GEX with net positive 0.76M (just 1.8% below current price)
- $90: 1.25M total GEX at 7% below current price
- $85: 1.65M total GEX providing deep support at 12% below
- $80: 0.65M total GEX as last-resort floor at 17% below
🟠 Resistance Levels (Call Gamma):
- $100 - Nearest Resistance: 0.49M total GEX at psychological barrier (3.4% above)
- $105: 0.52M total GEX at 8.5% above current price
- $110: 0.18M total GEX at 13.7% above
- $115: 0.04M total GEX at 18.9% above
Gamma Bias: Bullish with 6.80M call GEX vs 4.37M put GEX - market makers positioned for upside
The tight $95-$100 range (just 5% wide) suggests the market expects consolidation around current levels - perfect for a covered call strategy!
⚡ Catalysts
Upcoming Events
Capital Markets Day - November 12, 2025
- Inaugural event at Fremont headquarters to unveil long-term vision
- Multi-year financial outlook and growth targets to be presented
- Platform expansion strategy beyond traditional trackers
- Tours of Center for Solar Excellence and R&D facilities
- Why it matters: Could provide significant catalyst if guidance impresses - or disappointment if expectations too high
Q3 FY2026 Earnings - Late January 2026
- Following blowout Q2 results (Revenue $905M, +42% YoY, EPS $1.19 beat by 17.4%)
- Raised FY2026 guidance to $3.28-3.48B revenue
- Backlog exceeds $5 billion with book-to-bill above 1.0
- Margins may face pressure from Section 232 tariffs (~300 bps impact)
Saudi Arabia JV Launch - Q1 2026
- Nextracker Arabia joint venture with Abunayyan Holding announced October 23
- Manufacturing facility in Riyadh to serve Saudi Vision 2030 (130 GW clean energy target)
- Expands MENA market access with established regional partner (Abunayyan's 75-year infrastructure expertise)
- Expected to contribute meaningfully to international revenue diversification
AI Data Center Energy Demand
- Data center electricity demand surging 160% by 2030 driven by AI workloads
- Goldman Sachs projects 123 GW data center demand by 2035 (up from 4 GW in 2024)
- Solar expected to provide 27.5% of new energy sources
- Structural tailwind for utility-scale solar installations
Recently Completed
Blowout Q2 FY2026 Results - October 23, 2025
- Revenue $905M (+42% YoY), beating expectations
- Adjusted EBITDA $224M (25% margin)
- Raised full-year guidance significantly
- Stock surged on results, setting up this profit-taking trade
Origami Solar Acquisition - September 2025
- $53M acquisition of roll-formed steel frame technology pioneer
- Expands addressable market by $750M+ in U.S. alone
- Secured $75M+ multi-year supply agreement with major U.S. solar manufacturer
- Enables transition from aluminum to steel frames (lower carbon, higher strength)
Analyst Upgrades Wave
- Goldman Sachs raised to $125 (from $89) - Buy rating
- Barclays raised to $105 (from $92) - Overweight
- Baird raised to $110 (from $87) - Outperform
- Roth Capital raised to $120 (from $100) - Buy
🎯 Price Targets & Probabilities
Using gamma levels, recent analyst upgrades, and upcoming catalysts:
🚀 Bull Case (30% chance)
Target: $110-$125
Catalysts needed:
- Capital Markets Day reveals aggressive multi-year growth targets
- Saudi JV exceeds expectations with additional MENA partnerships
- Q3 earnings show margin expansion despite tariff headwinds
- Major data center energy supply agreements announced
Gamma resistance: Needs to clear $100 psychological level and $105 gamma wall
Analyst support: Goldman $125 and Roth $120 targets provide roadmap
Risk to covered call: Stock could blast through $100 cap, leaving premium on table
😐 Base Case (50% chance)
Target: $90-$105 range
Most likely scenario:
- Stock consolidates gains in tight range around current $99.48 level
- Capital Markets Day provides solid but not spectacular outlook
- Gamma levels at $95 support and $100 resistance create natural boundaries
- Covered call strategy profits perfectly in this range
Why this makes sense: After 139% YTD gain, some digestion is healthy
Perfect outcome for this trade: Stock stays near $100, calls expire worthless or get assigned at effective $99.80
😰 Bear Case (20% chance)
Target: $75-$90
What could trigger:
- Capital Markets Day disappoints with conservative long-term guidance
- Tariff impacts worse than expected, compressing margins further
- Saudi JV delayed or restructured
- Broader solar sector selloff on policy uncertainty
- Profit-taking accelerates after parabolic 2025 run
Gamma support: Strong floor at $95, then $90 should provide buying opportunities
Still profitable for seller: Even at $75, this trade collected $90M - stock would need to fall to $65 to lose on the hedge
💡 Trading Ideas
🛡️ Conservative: Follow the Smart Money Exit
Play: Covered call if you own NXT stock
Sell January $100 calls against your shares
Why this works:
- Collect premium while capping gains at $100 (+0.5% from current)
- Stock up 139% YTD - taking some profit makes sense
- November 12 event could cause volatility
- Gamma resistance at $100 suggests natural ceiling
Risk: Miss out if stock surges past $100 on great news
Reward: Keep premium if stock stays below $100 or trades sideways
⚖️ Balanced: Range-Bound Iron Condor
Play: January expiration iron condor
Sell $95 puts / Buy $90 puts Sell $105 calls / Buy $110 calls
Why this works:
- Gamma levels show strong support at $95, resistance at $105
- Profit if stock stays in $95-$105 range through January
- Defined risk on both sides
- Capital Markets Day uncertainty makes range-bound play attractive
Risk: $5 per spread max loss if breaks out of range
Reward: Net credit collected if stays within bands
🚀 Aggressive: Contrarian Bull Call Spread
Play: Counter the institutional exit - bet on continued momentum
Buy $100 calls / Sell $115 calls (January expiration)
Why this works:
- If Capital Markets Day crushes it, stock could run to analyst targets ($110-$125)
- Saudi JV and platform expansion story just beginning
- Institutional selling creates contrarian opportunity
- Bull call spread limits cost while maintaining upside leverage
Risk: Premium paid if stock stays below $100
Reward: $15 spread pays off big if stock reaches analyst price targets
⚠️ Risk Factors
Valuation Premium: Trading at ~23x forward P/E - any stumble could lead to multiple compression
Tariff Uncertainty: Section 232 tariffs impacted Q2 margins by 300 bps - could worsen if trade policy changes
Profit-Taking Risk: Stock up 139% YTD - technical pullback could be sharp and sudden
Event Risk: November 12 Capital Markets Day is make-or-break catalyst in near term
Competition Intensifying: Array Technologies (ARRY) and other competitors fighting for market share
U.S. Market Concentration: Heavy reliance on U.S. solar market creates geographic risk despite Saudi JV
Sentiment Shift: Solar sector vulnerable to policy changes, especially around IRA tax credits
🏁 The Bottom Line
Real talk: This $90M covered call tells us someone with a MASSIVE Nextracker position is locking in profits after an incredible 139% gain this year. They're essentially saying "I'm happy to exit around $100 and pocket $90M in premium while I wait."
If you own NXT: This trade screams profit-taking. Consider trimming positions or selling covered calls to lock in gains. You've had an incredible ride - nothing wrong with taking some chips off the table!
If you're watching: Wait for post-Capital Markets Day clarity on November 12th. The gamma setup suggests $95-$105 range until then. Don't chase at all-time highs without a clear catalyst.
If you're bullish: Look for dips to the $95 support level as entry points, or use bull call spreads to limit risk while maintaining upside exposure. The long-term solar/AI data center story remains intact.
Mark your calendar: November 12th Capital Markets Day is THE event that will determine if this stock consolidates or breaks higher. Smart money is de-risking ahead of it - you should have a plan too!
Disclaimer: Options trading involves substantial risk of loss. This analysis is for educational purposes only and not financial advice. Consider your risk tolerance and investment objectives before trading options.
About Nextracker: Nextracker is a leading provider of intelligent, integrated solar tracker and software solutions used in utility-scale solar projects globally, with a $14.54 billion market cap and #1 worldwide market position for 10 consecutive years.