💎 OWL $2.4M In-The-Money Put Sale - Someone's Betting Big on a Bounce Before Earnings! 🐂
📅 February 2, 2026 | 🔥 Unusual Activity Detected
🎯 The Quick Take
Someone just SOLD $2.4 MILLION worth of in-the-money puts on Blue Owl Capital (OWL) - 20,000 contracts at the $14 strike expiring April 17th - while the stock sits at just $13.30. That's a 279x Z-score (a level of activity you might see a handful of times per year on this ticker) and a Vol/OI ratio of 29.7x. With Q4 earnings dropping in just 3 days on February 5th, this trader is essentially saying: "I'll gladly buy 2 million shares of OWL at an effective price of $12.55, and I'm collecting $2.4M in premium to do it."
📊 Company Overview
Blue Owl Capital (OWL) is one of the largest alternative asset managers in the world, specializing in private credit, digital infrastructure, and GP strategic capital:
- 💰 Market Cap: ~$21.3B
- 🏦 Industry: Investment Advice (Alternative Asset Management)
- 📊 AUM: $295.6B (up 24% YoY as of Q3 2025)
- 📈 Current Price: $13.30 (down ~47% from 52-week high of $26.35)
- 💸 Dividend Yield: 6.3% ($0.90/share annually)
- 🏢 Key Business: Direct lending, data center financing ($27B Meta deal), GP minority stakes
OWL has been crushed over the past 3 months, falling from $19+ to near 52-week lows on a combination of a failed OBDC/OBDC II merger, a shareholder lawsuit alleging hidden redemption concerns, and broader private credit sector fears.
💰 The Option Flow Breakdown
The Tape (February 2, 2026 @ 10:29:46):
| Time | Symbol | Side | Buy/Sell | Type | Expiration | Premium | Strike | Volume | OI | Size | Spot | Option Price |
|---|---|---|---|---|---|---|---|---|---|---|---|---|
| 10:29:46 | OWL | BID | SELL | PUT $14 | 2026-04-17 | $2.4M | $14 | 20K | 673 | 16,606 | $13.30 | $1.45 |
🤓 What This Actually Means
This is a Sell-to-Open (STO) naked or cash-secured put - a BULLISH trade! Here's the breakdown:
- 🐂 Bullish conviction: By selling the $14 put while OWL trades at $13.30, this trader is CHOOSING to sell an in-the-money put. They WANT the stock to rally above $14 by April 17th so the put expires worthless and they keep the full $2.4M premium.
- 💵 Premium collected: $1.45 per share x 16,606 contracts = $2.4M in immediate cash
- 🎯 Effective buy price: If the stock stays below $14 and they get assigned, their effective cost basis is $14 - $1.45 = $12.55 per share (5.6% below current price!)
- 📊 The math works: Even if OWL drops further, they're buying at $12.55 - a level not seen since... well, near the absolute bottom. And they're getting PAID to wait.
- 🏦 Institutional sizing: 20,000 contracts = 2,000,000 shares = roughly $26.6M in stock exposure at the $14 strike. This is NOT a retail trade.
- ⏰ Strategic timing: April 17th expiration captures Q4 earnings (Feb 5), OBDC earnings (Feb 18), 13F filings (Feb 14), and any Q1 2026 catalysts
Why sell an ITM put? Because this trader is EXTREMELY confident OWL bounces. An in-the-money put at $14 has $0.70 of intrinsic value baked in (stock at $13.30 vs $14 strike). They're getting paid $1.45 total, meaning only $0.75 is time value. The market is paying them handsomely because of earnings fear and elevated volatility. If OWL rallies above $14 by April, they pocket the full $2.4M. If it doesn't, they own OWL at $12.55 with a 6.3% dividend yield - not a bad consolation prize.
Unusual Score: 🔥 Z-Score of 279 with volume 20,000 vs open interest of just 673 (29.7x ratio). To put this in context, this level of activity on OWL $14 puts is roughly 279 standard deviations above normal - the kind of outsized positioning you'd see maybe a few times per year on this ticker. Someone has very strong conviction here.
📈 Technical Setup / Chart Check-Up
YTD Performance Chart
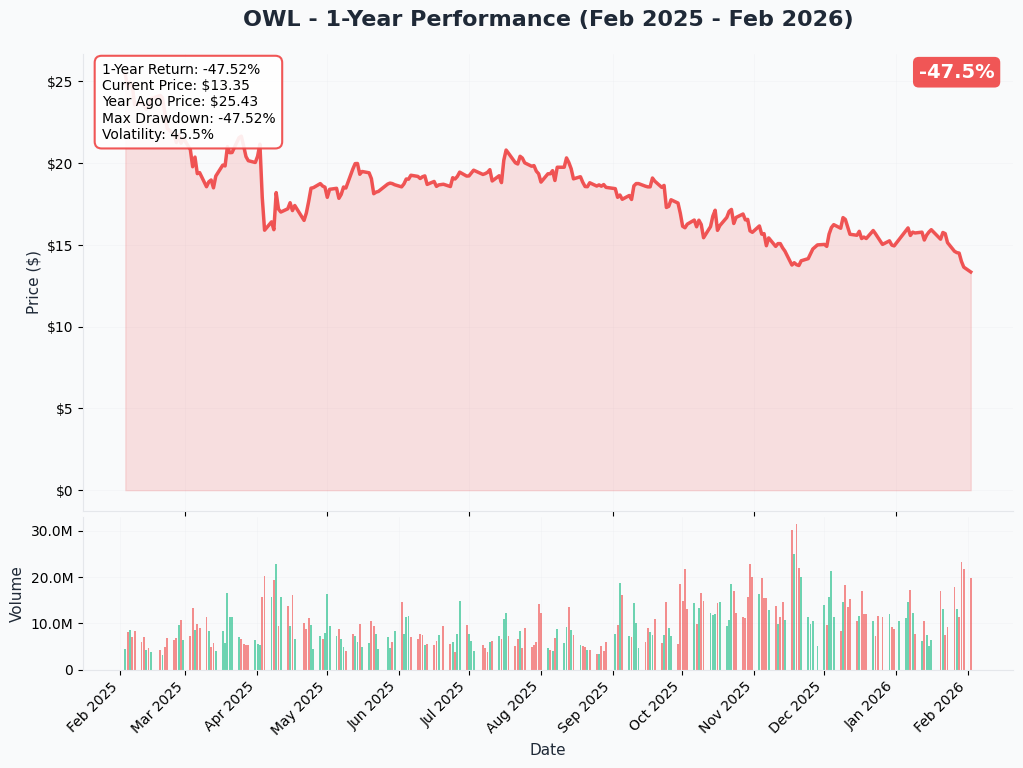
OWL has been in a brutal downtrend, trading near 52-week lows at $13.30 after falling ~47% from its high of $26.35. The 50-day moving average sits at $15.39 and the 200-day at $16.84 - both well overhead, confirming the bearish trend. However, the stock is deeply oversold at these levels, which is exactly what makes this put sale interesting from a contrarian perspective.
Key observations:
- 📉 Steep decline: From $19+ in early November to $13.30 - roughly 30% in 3 months
- 🛡️ Near 52-week low: $13.20 low provides a potential floor
- 💸 6.3% dividend yield at these prices acts as a natural support magnet for income investors
- 📊 Insider buying: Management purchased $15M+ in shares during the selloff, plus $50M+ in buybacks
- ⚠️ Below key moving averages: 50-day ($15.39) and 200-day ($16.84) both overhead resistance
Gamma-Based Support & Resistance Analysis
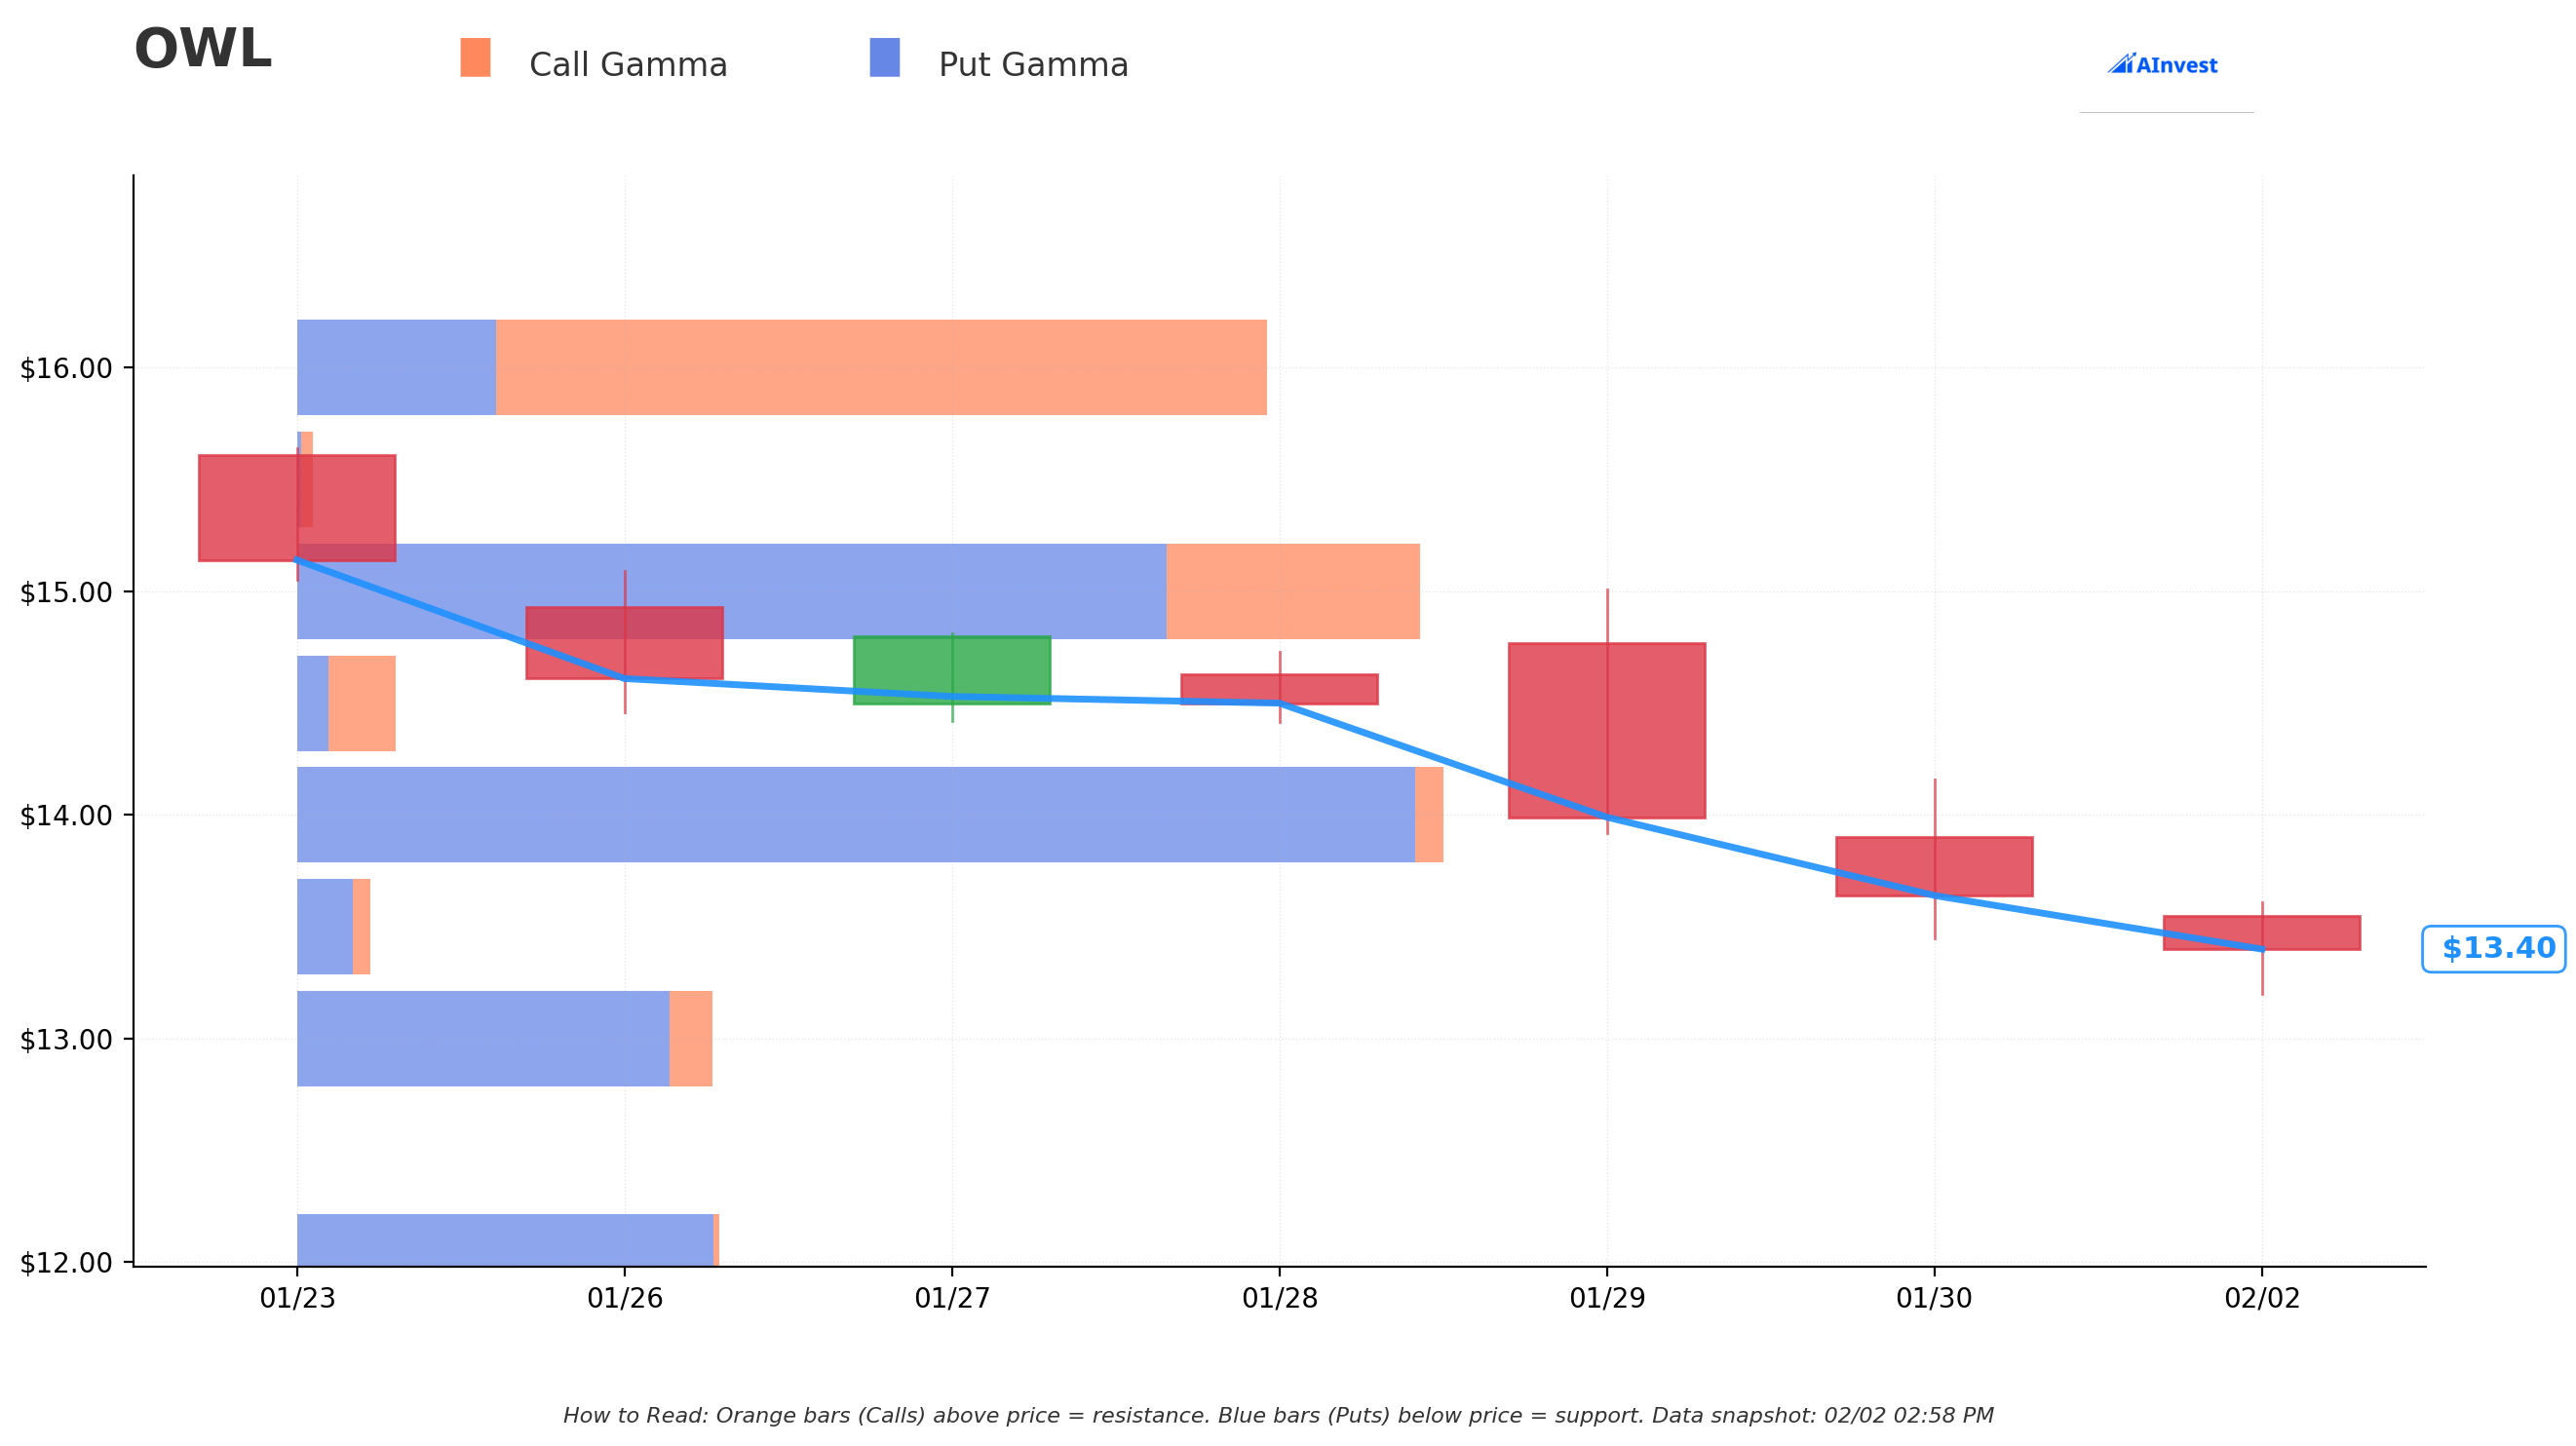
Current Price: $13.42
The gamma exposure map shows where the big options positioning creates natural price magnets and barriers:
🔵 Support Levels (Below Price):
- $13.00 - Immediate support with 4.6B total gamma (strongest nearby floor, just 3.1% below)
- $12.50 - Secondary support at 0.03B gamma (lighter level, 6.8% below)
- $12.00 - Major deep support with 4.7B gamma (strong floor, 10.5% below)
- $11.00 - Extended support at 0.5B gamma (disaster scenario, 18% below)
🟠 Resistance Levels (Above Price):
- $13.50 - Immediate resistance with 0.8B gamma (just 0.6% above - first hurdle!)
- $14.00 - MASSIVE resistance with 12.7B gamma (THE put sale strike! 4.4% above - this is the LINE IN THE SAND)
- $14.50 - Secondary resistance at 1.1B gamma (8.1% above)
- $15.00 - Major ceiling with 12.5B gamma (11.8% above)
- $16.00 - Extended resistance at 10.8B gamma (19.3% above)
What this means for traders: The $14 strike where this massive put was sold is ALSO the single largest gamma level on the board at 12.7B. This is not a coincidence - the trader knows that $14 is the most important price level for OWL right now. If the stock can reclaim $14, there's a wall of gamma that could help stabilize price action. Below $13, there's solid support, and the $12.00 level (4.7B gamma) aligns closely with the put seller's effective entry of $12.55.
Net GEX Bias: Bearish (21.7B call gamma vs 37.4B put gamma) - Put-heavy positioning reflects the fear in this name. But that fear is exactly what's paying this trader $1.45 per share in premium.
Implied Move Analysis
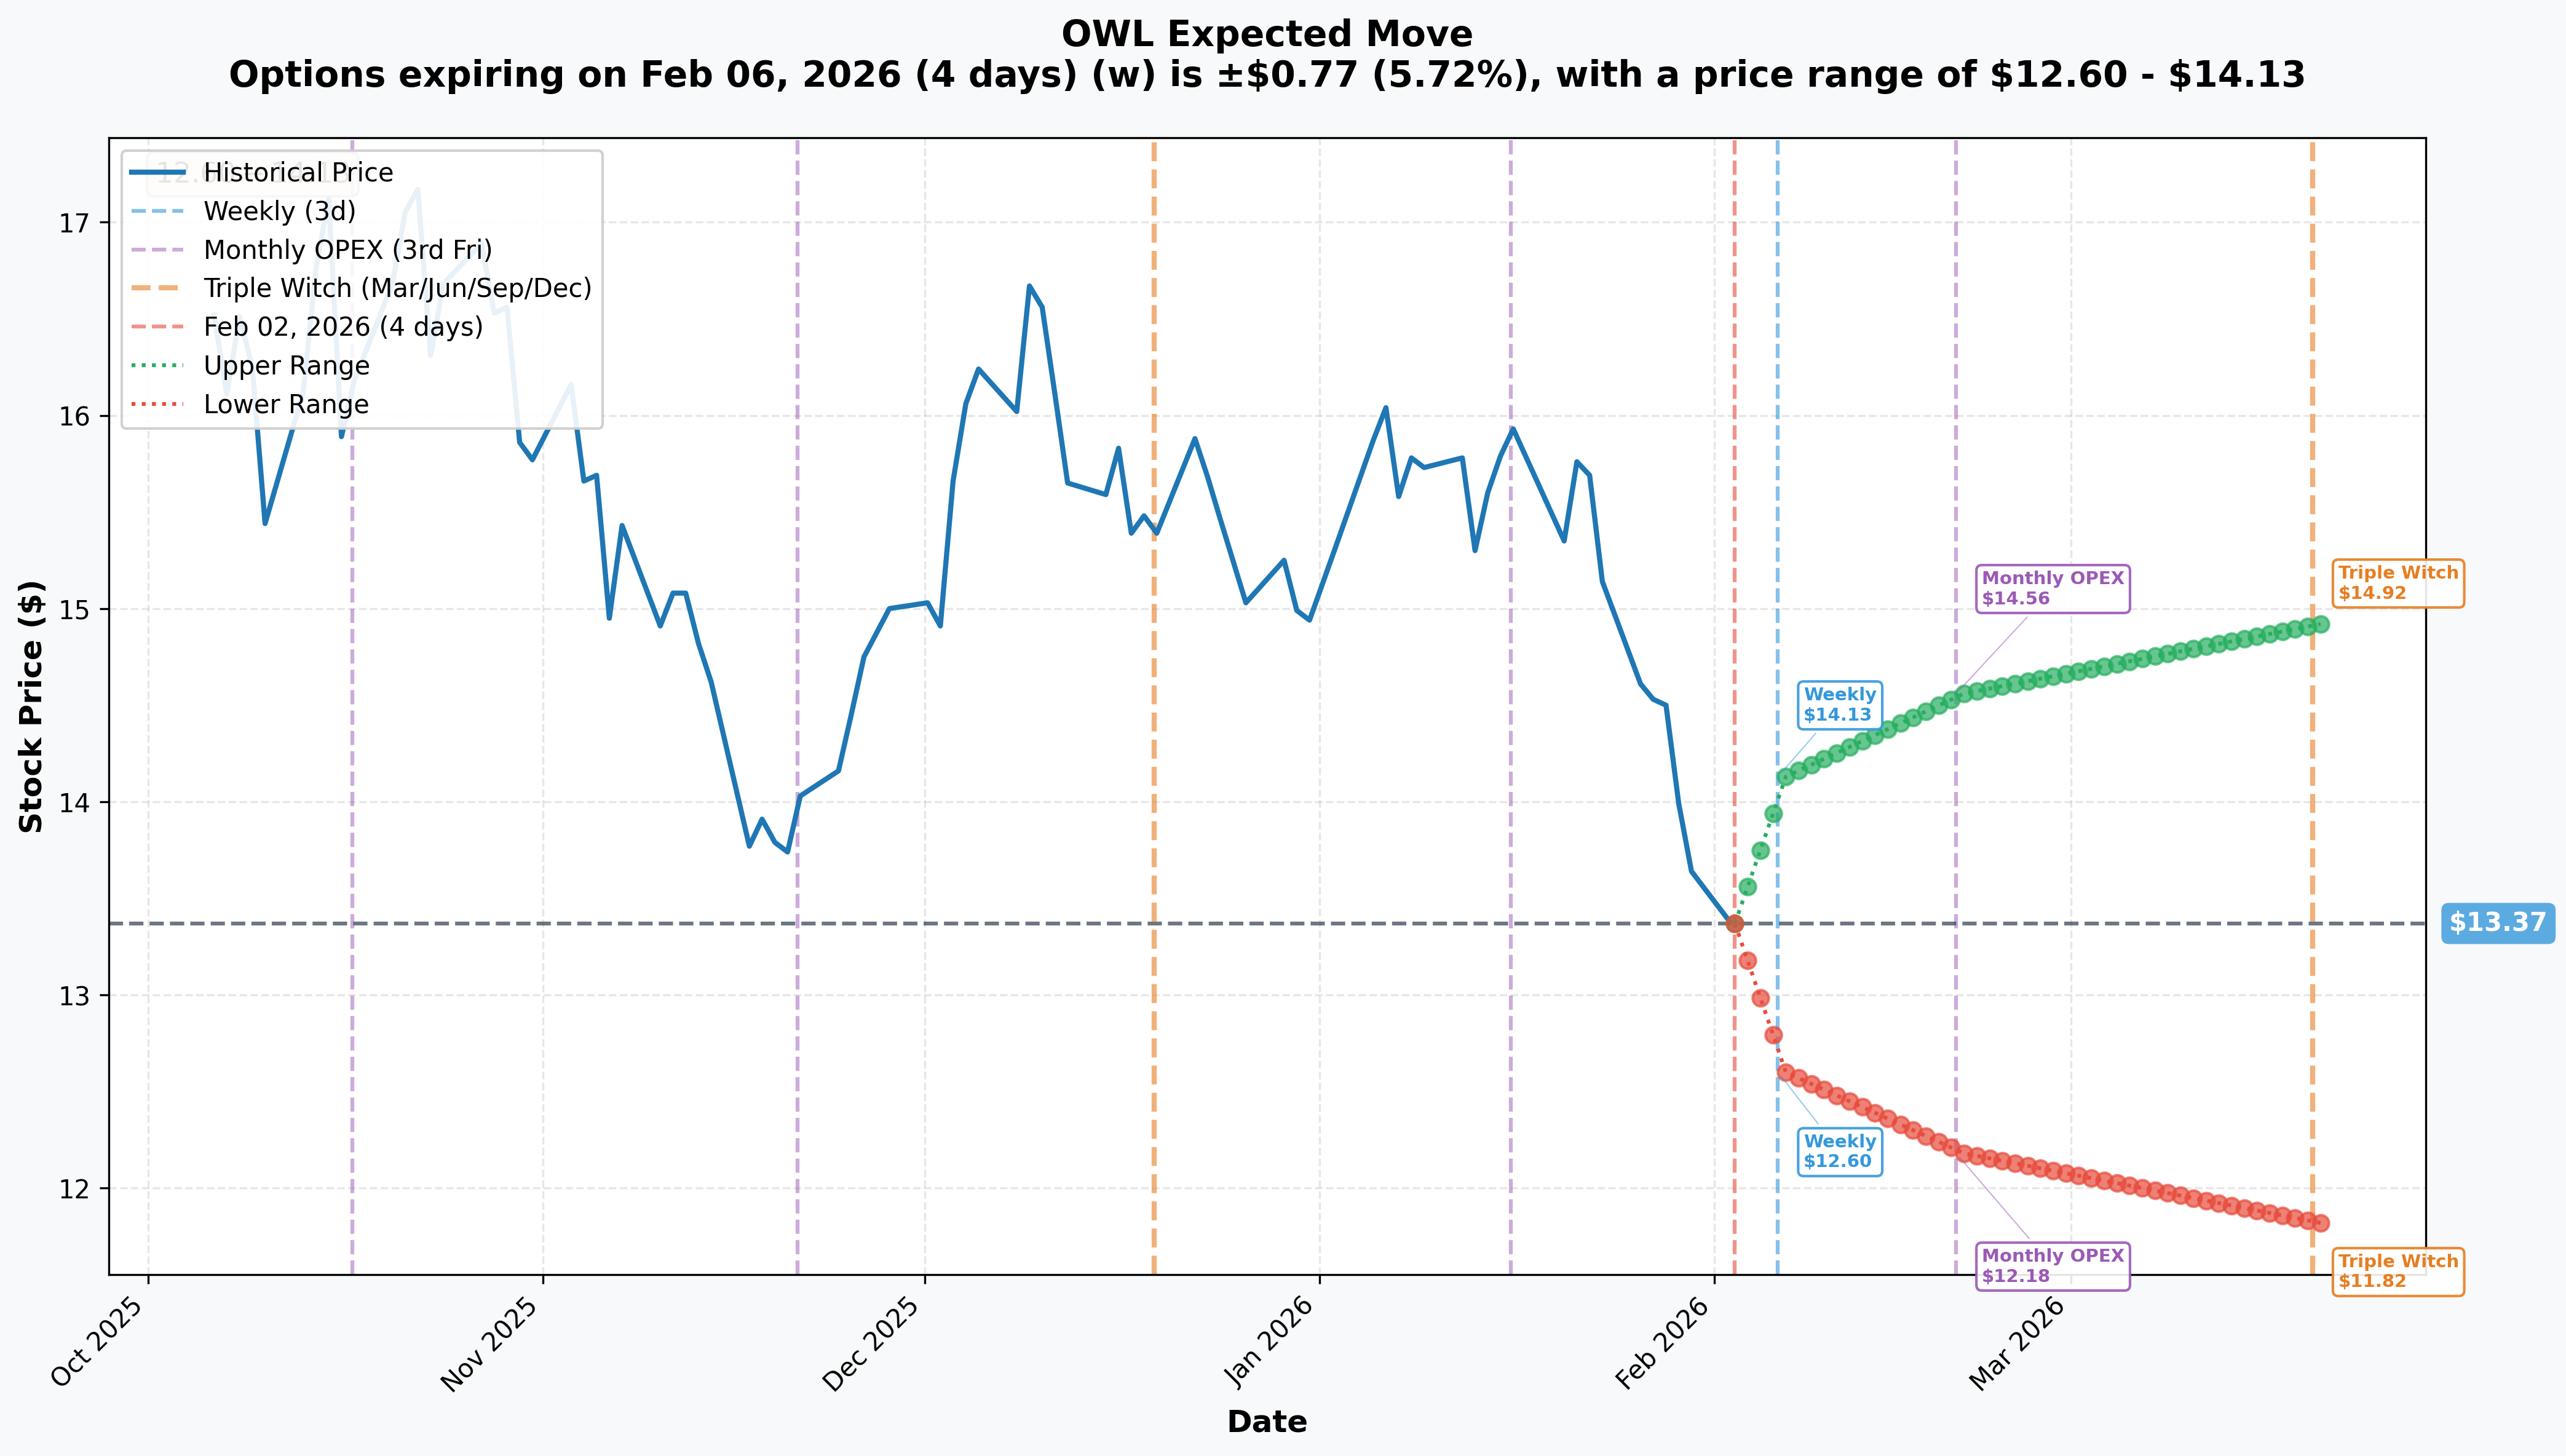
Options market pricing for upcoming expirations:
- 📅 Weekly (Feb 6 - 4 days, INCLUDES EARNINGS!): +/-$0.77 (+/-5.7%) -> Range: $12.60 - $14.13
- 📅 Monthly OPEX (Feb 20 - 18 days): +/-$1.19 (+/-8.9%) -> Range: $12.18 - $14.56
- 📅 Triple Witch (Mar 20 - 46 days): +/-$1.55 (+/-11.6%) -> Range: $11.82 - $14.92
Translation for regular folks: The options market expects OWL to move about 5.7% ($0.77) by this Friday around earnings - that could put the stock anywhere from $12.60 to $14.13. Notice that the $14 put strike sits RIGHT at the top of the weekly implied range. The put seller is basically saying, "I think the stock moves to the upper end of its range after earnings."
Looking further out, the April expiration (when this trade expires) isn't shown, but extending the implied move curve suggests a range of roughly $11.50-$15.50. The put seller's $12.55 effective entry is near the low end of that expected range, giving them a nice margin of safety.
🎪 Catalysts
🔥 Upcoming Catalysts
Q4 2025 Earnings - February 5, 2026 (3 DAYS AWAY!) 📊
- Conference call at 10:00 AM ET on February 5th
- Consensus Revenue: ~$648.3M; Consensus EPS: ~$0.20 (distributable)
- Key watchpoints: Q4 fundraising totals, OCIC redemption rates (market expects <7%), Digital Infrastructure Trust inflows, FRE margin trajectory (57-58% guided), any lawsuit commentary
- This is THE catalyst - management needs to demonstrate that the selloff has been overdone
13F Filing Deadline - February 14, 2026 📋
- Q4 2025 institutional ownership changes disclosed - will reveal if institutions were buying or selling during the crash
OBDC Q4 Earnings - February 18, 2026 📊
- Earnings call February 19th - focus on credit quality, dividend sustainability, and whether the tender program restarts
OBDC II Tender Program Restart - Q1 2026 🔄
- Pending Board approval, OBDC II intends to resume its tender program - critical for restoring investor confidence after the failed merger
📜 Recent Catalysts (Already Happened)
Q3 2025 Results (October 30, 2025) - BEAT estimates:
- Revenue $687M, up 20.9% YoY, beating consensus by 0.66%
- AUM $295.6B, up 24% YoY; 18th consecutive quarter of FRE growth
- New capital commitments $14B in Q3, $57B LTM (up 60% YoY)
Meta $27B Data Center JV (October 21, 2025):
- Largest private credit transaction ever - Blue Owl funds own 80%, Meta 20%
- Financed through $27B in A+-rated debt plus $2.5B equity
OBDC/OBDC II Merger Collapse (November 2025):
- Merger announced November 5, abandoned November 19 - triggered investor panic over redemptions
- Stock dropped ~15% in weeks following the news
Oracle Data Center Exit (December 17, 2025):
- Blue Owl pulled out of $10B Oracle/Stargate data center financing citing unfavorable terms - shows discipline but lost a headline deal to Blackstone
Shareholder Lawsuit (January 19, 2026):
- Lawsuit alleges executives hid BDC redemption concerns between February and November 2025
- Lead plaintiff deadline: February 2, 2026 - early stage, no court determination on merits
Raymond James Upgrade (December 10, 2025):
- Upgraded to Strong Buy with $20 price target, citing attractive valuation (~17x forward P/E vs 19x 3-year average)
Insider Buying (November-December 2025):
🎲 Price Targets & Probabilities
Using gamma levels, implied move data, and the earnings catalyst, here are the scenarios through the April 17th put expiration:
📈 Bull Case (30% probability)
Target: $16-$18
How we get there:
- 💪 Q4 earnings on February 5th show redemption rates below 7%, calming investor fears
- 🚀 AUM crosses $300B, validating the growth trajectory despite the stock selloff
- 📈 Management reaffirms Investor Day targets: 20%+ FRE/share growth, FRE margins expanding
- 🏦 Institutional buying disclosed in February 14th 13F filings confirms smart money accumulated during the crash
- 📊 Stock reclaims $14 gamma wall, then pushes toward 50-day MA ($15.39) and 200-day MA ($16.84)
- 💸 6.3% dividend yield attracts income investors as rate environment shifts
- 🤝 New digital infrastructure deals announced, building on $27B Meta JV and QIA partnership
Put seller outcome: Full $2.4M profit - puts expire worthless. Home run.
🎯 Base Case (45% probability)
Target: $13-$15 (Range-bound with upward bias)
Most likely scenario:
- ✅ Earnings are fine - not spectacular, not terrible. Revenue near $648M consensus, redemptions manageable
- ⚖️ Stock bounces off lows but struggles to break above $14-$15 gamma resistance
- 📊 Market digests the lawsuit news, waiting for more clarity before re-rating
- 🔄 OBDC II tender program restart in Q1 helps sentiment gradually
- 💤 Volatility compresses post-earnings, time decay works in the put seller's favor
- 📈 Gradual recovery toward $14-$15 as fear premium dissipates
Put seller outcome: Likely profitable. If stock is at $14+ by April, puts expire worthless. If stock is between $12.55-$14, they get assigned but at a price below where the stock traded. Time decay is their friend.
📉 Bear Case (25% probability)
Target: $11-$12.50
What could go wrong:
- 😰 Earnings reveal redemption rates above 7%, confirming investor fears
- 📉 FRE/share growth decelerates to 11-14% as UBS projects, shattering the growth premium
- 🚨 Shareholder lawsuit gains traction, creating settlement risk
- 💸 Broader private credit "bubble" narrative accelerates, dragging sector lower
- 🇺🇸 Tariff uncertainty creates broader market selloff
- 🔨 Break below $13 gamma support triggers cascade to $12 (4.7B gamma level)
Put seller outcome: Gets assigned at $14, effective cost $12.55. If stock drops to $11, they're underwater by $1.55/share ($3.1M loss on position). However, they'd own OWL at $12.55 with a 7.2% dividend yield - which many income investors would find attractive.
💡 Trading Ideas
🛡️ Conservative: "The Dividend Collector" - Wait and Accumulate
Play: Wait for Q4 earnings on February 5th, then buy OWL shares on any post-earnings dip toward $12-$12.50 (near the gamma support floor)
Why this works:
- ⏰ Earnings in 3 days creates binary risk - no need to front-run
- 💸 At $12.50, you'd be buying OWL at a 7.2% dividend yield with 4 consecutive years of dividend growth
- 📊 Forward P/E of ~17x vs peers at 20-30x gives valuation cushion
- 🛡️ $12.00 gamma support (4.7B) provides technical floor
- 🏦 Insider buying at higher prices ($15+) suggests management sees value here
- 📈 Analyst consensus $22.13 target implies ~48% upside even from current levels
Position size: Start with 1/3 position post-earnings, add on dips to $12.00
Risk level: Low-Moderate | Skill level: Beginner-friendly
⚖️ Balanced: "Copy the Whale" - Cash-Secured Put at $12.50
Play: Sell the April 17th $12.50 put (same expiration as the whale trade, one strike lower for extra cushion)
Why this works:
- 🐋 You're following the same thesis as the $2.4M trader, but with MORE margin of safety
- 💵 Estimated premium: ~$0.60-$0.80 per share (collect ~$60-$80 per contract)
- 🎯 Effective entry if assigned: ~$11.70-$11.90 (near the 52-week low)
- 📊 $12.00 gamma support (4.7B) sits between you and disaster
- ⏰ April expiration gives 74 days for the thesis to play out across multiple catalysts
- 💸 If NOT assigned, you keep the premium - roughly 5-6% return on capital in 74 days
Max risk: If assigned, you own OWL at ~$11.80 (worse than current $13.30, but that's the cost of the extra safety)
Position size: Only sell puts you can cover with cash (1 contract = $1,250 in collateral)
Risk level: Moderate | Skill level: Intermediate
🚀 Aggressive: "Earnings Bounce" - Short-Dated Call Spread
Play: Buy the February 20 $13/$14.50 call spread after earnings (enter February 5th or 6th ONLY if earnings are positive)
Why this works:
- 💥 IV crush after earnings makes call spreads cheaper - buy AFTER volatility drops
- 📈 If OWL gaps up on earnings, the $13-$14.50 range captures the move toward the $14 gamma wall and beyond
- 📊 Defined risk: max loss is the debit paid (~$0.40-0.60 per spread)
- 🎯 Max profit: $1.50 spread width minus premium = ~$0.90-$1.10 per spread
- ⏰ 18 days to monthly OPEX gives time for post-earnings momentum
- 🚀 Risk/reward roughly 2:1 if earnings deliver
CRITICAL: Only enter IF earnings show manageable redemptions and positive guidance. Do NOT buy before the report.
Position size: Risk 2-3% of portfolio max
Risk level: HIGH (directional bet, time decay works against you) | Skill level: Advanced
⚠️ Risk Factors
Don't ignore these potential landmines:
-
⏰ Earnings in 3 days create binary event risk: Q4 results on February 5th could gap the stock 5-10% in either direction. The implied weekly move of +/-5.7% means the market is pricing in real uncertainty. If redemption rates exceed 7%, this stock could break below $12.50 fast.
-
⚖️ Shareholder lawsuit creates headline risk: The January 19th lawsuit alleging hidden redemption concerns is early stage with no court ruling, but it adds uncertainty and could lead to settlement costs. Lead plaintiff deadline is TODAY (February 2) - expect more news flow.
-
📉 The trend is firmly down: Stock is below BOTH 50-day ($15.39) and 200-day ($16.84) moving averages. Fighting a downtrend is dangerous - "catching a falling knife" is a real risk here. The put seller has deep pockets; retail traders may not.
-
💸 Private credit sector headwinds: Banks are re-entering the lending market as rates decline, increasing competition. The "bubble" narrative around private credit is gaining media traction, which could keep institutional investors cautious.
-
📊 Growth deceleration concerns: UBS projects FRE/share growth decelerating to 11-14% from 25%+ historically. If the growth premium fades, the valuation re-rating could have further to go.
-
🔨 Bearish GEX bias: Net gamma exposure is bearish (37.4B put gamma vs 21.7B call gamma), indicating dealers are positioned for continued downside. This creates natural selling pressure on rallies.
-
🌐 Macro uncertainty: Tariff announcements and shifting AI infrastructure spending sentiment could pressure alternative asset manager valuations broadly.
🎯 The Bottom Line
Real talk: Someone with very deep pockets just put $2.4M on the line saying OWL is oversold at $13.30. By selling 20,000 in-the-money puts at the $14 strike, they're either going to pocket $2.4M if the stock recovers above $14 by April, or they'll own 2 million shares at an effective price of $12.55 - below where the stock has traded recently.
What this trade tells us:
- 🎯 This is a BULLISH bet disguised as a put trade. The seller wants OWL above $14 (the biggest gamma level on the board)
- 💰 They're comfortable owning OWL at $12.55 in a worst-case scenario - that's a 7.2% dividend yield and a ~13x forward P/E
- ⏰ The April 17th expiration captures Q4 earnings (Feb 5), OBDC earnings (Feb 18), 13F filings (Feb 14), and Q1 developments
- 📊 A Z-score of 279 means this activity is roughly 279 standard deviations above normal volume for this strike - the kind of outsized positioning that appears only a few times per year
- 🏦 The timing right before earnings suggests they have strong conviction the report will be at least decent
If you're watching OWL:
- 👀 February 5th earnings is EVERYTHING. Wait for the report before committing capital
- 🎯 If earnings show redemptions <7% and solid fundraising, this stock could snap back to $15-$16 fast given how oversold it is
- 📉 If redemptions disappoint, $12.00 gamma support is the next major floor
- 💸 At 6.3% yield and ~17x forward P/E vs 20-30x for peers, the valuation argument is compelling IF the business stays on track
- 🛡️ Insiders bought $15M+ and the company repurchased $50M+ during the selloff - they're putting their money where their mouth is
Mark your calendar - Key dates:
- 📅 February 5 (Thursday) - Q4 2025 earnings release + conference call at 10 AM ET
- 📅 February 14 - 13F filing deadline (institutional ownership changes revealed)
- 📅 February 18 - OBDC Q4 earnings
- 📅 February 20 - Monthly OPEX
- 📅 March 20 - Triple Witch quarterly OPEX
- 📅 Q1 2026 - OBDC II tender program restart expected
- 📅 April 17 - This $2.4M put trade expires
The big picture: OWL is a high-quality alternative asset manager that's been caught in a perfect storm of bad headlines - failed merger, lawsuit, Oracle deal exit, sector fears. But underneath the noise, the business is still growing AUM 24% YoY, collecting fees on $295.6B in assets, and paying a growing 6.3% dividend. The $2.4M put sale is a vote of confidence that the worst is priced in. Whether that confidence is justified depends heavily on what we hear Thursday morning.
Be smart with your sizing. Let earnings tell the story. And remember - even the whale is comfortable owning this at $12.55 if things go sideways. 💪
Disclaimer: Options trading involves substantial risk of loss and is not suitable for all investors. This analysis is for educational purposes only and not financial advice. Past performance doesn't guarantee future results. The 279 Z-score reflects this specific trade's size relative to recent OWL history - it does not guarantee the trade will be profitable or that you should follow it. Selling puts carries the risk of being assigned stock at a loss, and naked put selling requires significant margin. Always do your own research and consider consulting a licensed financial advisor before trading. Earnings create binary event risk with potential for significant gaps in either direction.
About Blue Owl Capital: Blue Owl Capital Inc. is one of the world's largest alternative asset managers with $295.6B in AUM, operating across three core platforms: Credit ($152.1B), Real Assets ($74.7B), and GP Strategic Capital ($68.8B). The company is listed on the NYSE in the Investment Advice industry.