PDD: $2.7M Put Bet Signals Institutional Caution Ahead of Q4 Earnings
2026-01-13 | Unusual Activity Detected
The Quick Take
Someone just dropped $2.7 million on PDD puts expiring in March - that's a serious bearish bet on the Temu parent company. With a Z-score of 15.75 (EXTREMELY UNUSUAL), this trade ranks in the top tier of unusual activity we track. The timing is notable: just 10 weeks before Q4 2025 earnings on March 23, 2026, amid ongoing regulatory headwinds in China, Europe, and the U.S.
Company Overview
PDD Holdings Inc. (NASDAQ: PDD) operates commerce platforms across more than 80 countries. The company's primary revenue drivers include:
- Pinduoduo - Social commerce platform operating in China with 900+ million users
- Temu - Worldwide e-commerce marketplace (now in 80+ countries)
- Community-based group purchasing business in China
| Metric | Value |
|---|---|
| Market Cap | $168.6B |
| Employees | 23,465 |
| Industry | E-Commerce / Retail Trade |
| Current Price | ~$111.44 |
| 52-Week Range | $87.11 - $139.41 |
| Forward P/E | 9.4x - 9.6x |
Track PDD on Ainvest
The Option Flow Breakdown
What Just Happened
| Date | Time | Type | Strike | Expiration | Premium | Volume | OI | Spot | Order | Option |
|---|---|---|---|---|---|---|---|---|---|---|
| 2026-01-13 | 12:43:26 | PUT | $110 | 2026-03-20 | $2.7M | 5,500 | 14,000 | $111.41 | BTO | PDD20260320P110 |
Strategy Detected: Long Put (Standalone Bearish Bet)
Trade Characteristics:
- Volume/OI Ratio: 0.39x (moderate activity level)
- Z-Score: 15.75 - This is EXTREMELY UNUSUAL
- Trade Size: 4,897 contracts at $5.55 per contract
- Classification: OPEN position (new money entering)
Track this option: PDD 2026-03-20 $110 Put
What This Actually Means
Translation for us regular folks: Someone with deep pockets is betting PDD drops below $110 before March 20, 2026. At $2.7M, this isn't your neighbor's Robinhood account - this is institutional money positioning for downside.
Why $110 Strike?
- Currently just $1.41 out-of-the-money (1.3% below spot)
- Aligns with the strongest gamma support level (see technical analysis below)
- March 20 expiration gives 66 days to play out - right past Q4 earnings on March 23
The Risk/Reward Math:
- Breakeven: $104.45 (stock needs to drop ~6.3%)
- Max loss: $2.7M if PDD stays above $110
- Max gain: Theoretically unlimited to the downside (realistically capped around $80-90 based on historical support)
Technical Setup / Chart Check-Up
YTD Price Action
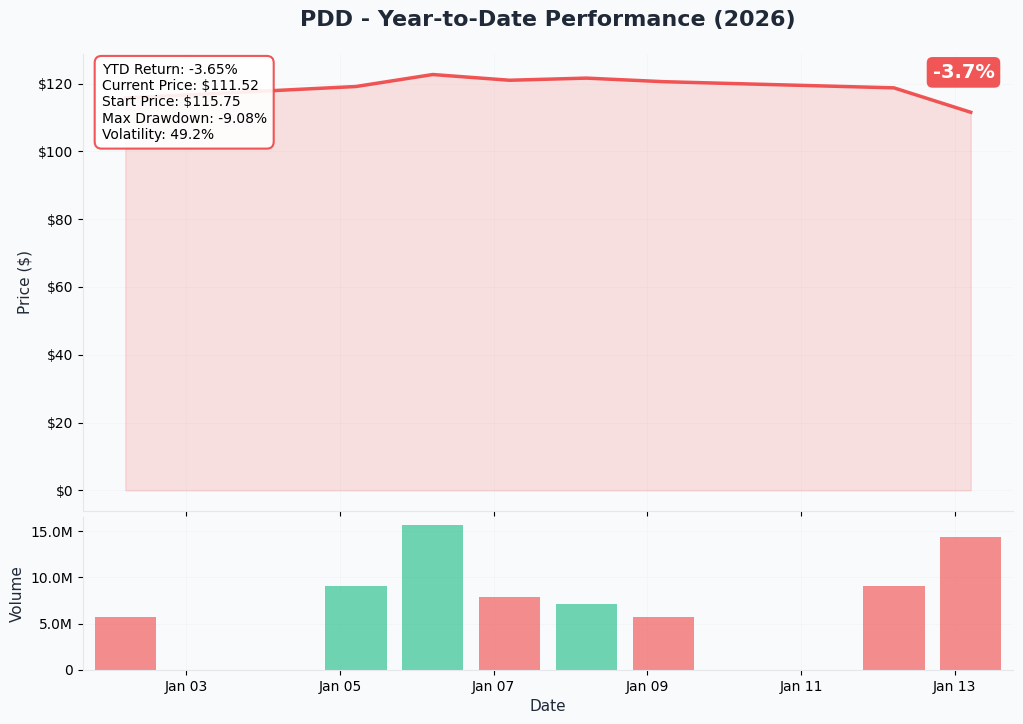
PDD has been on a roller coaster in 2025-2026:
- Rebounded from the $87 lows (August 2025 tariff shock)
- Currently trading at $111.44, up ~25% from 52-week lows
- Still ~20% below the 52-week high of $139.41
- Trading near the middle of its range - a classic consolidation pattern
Gamma-Based Support & Resistance Analysis
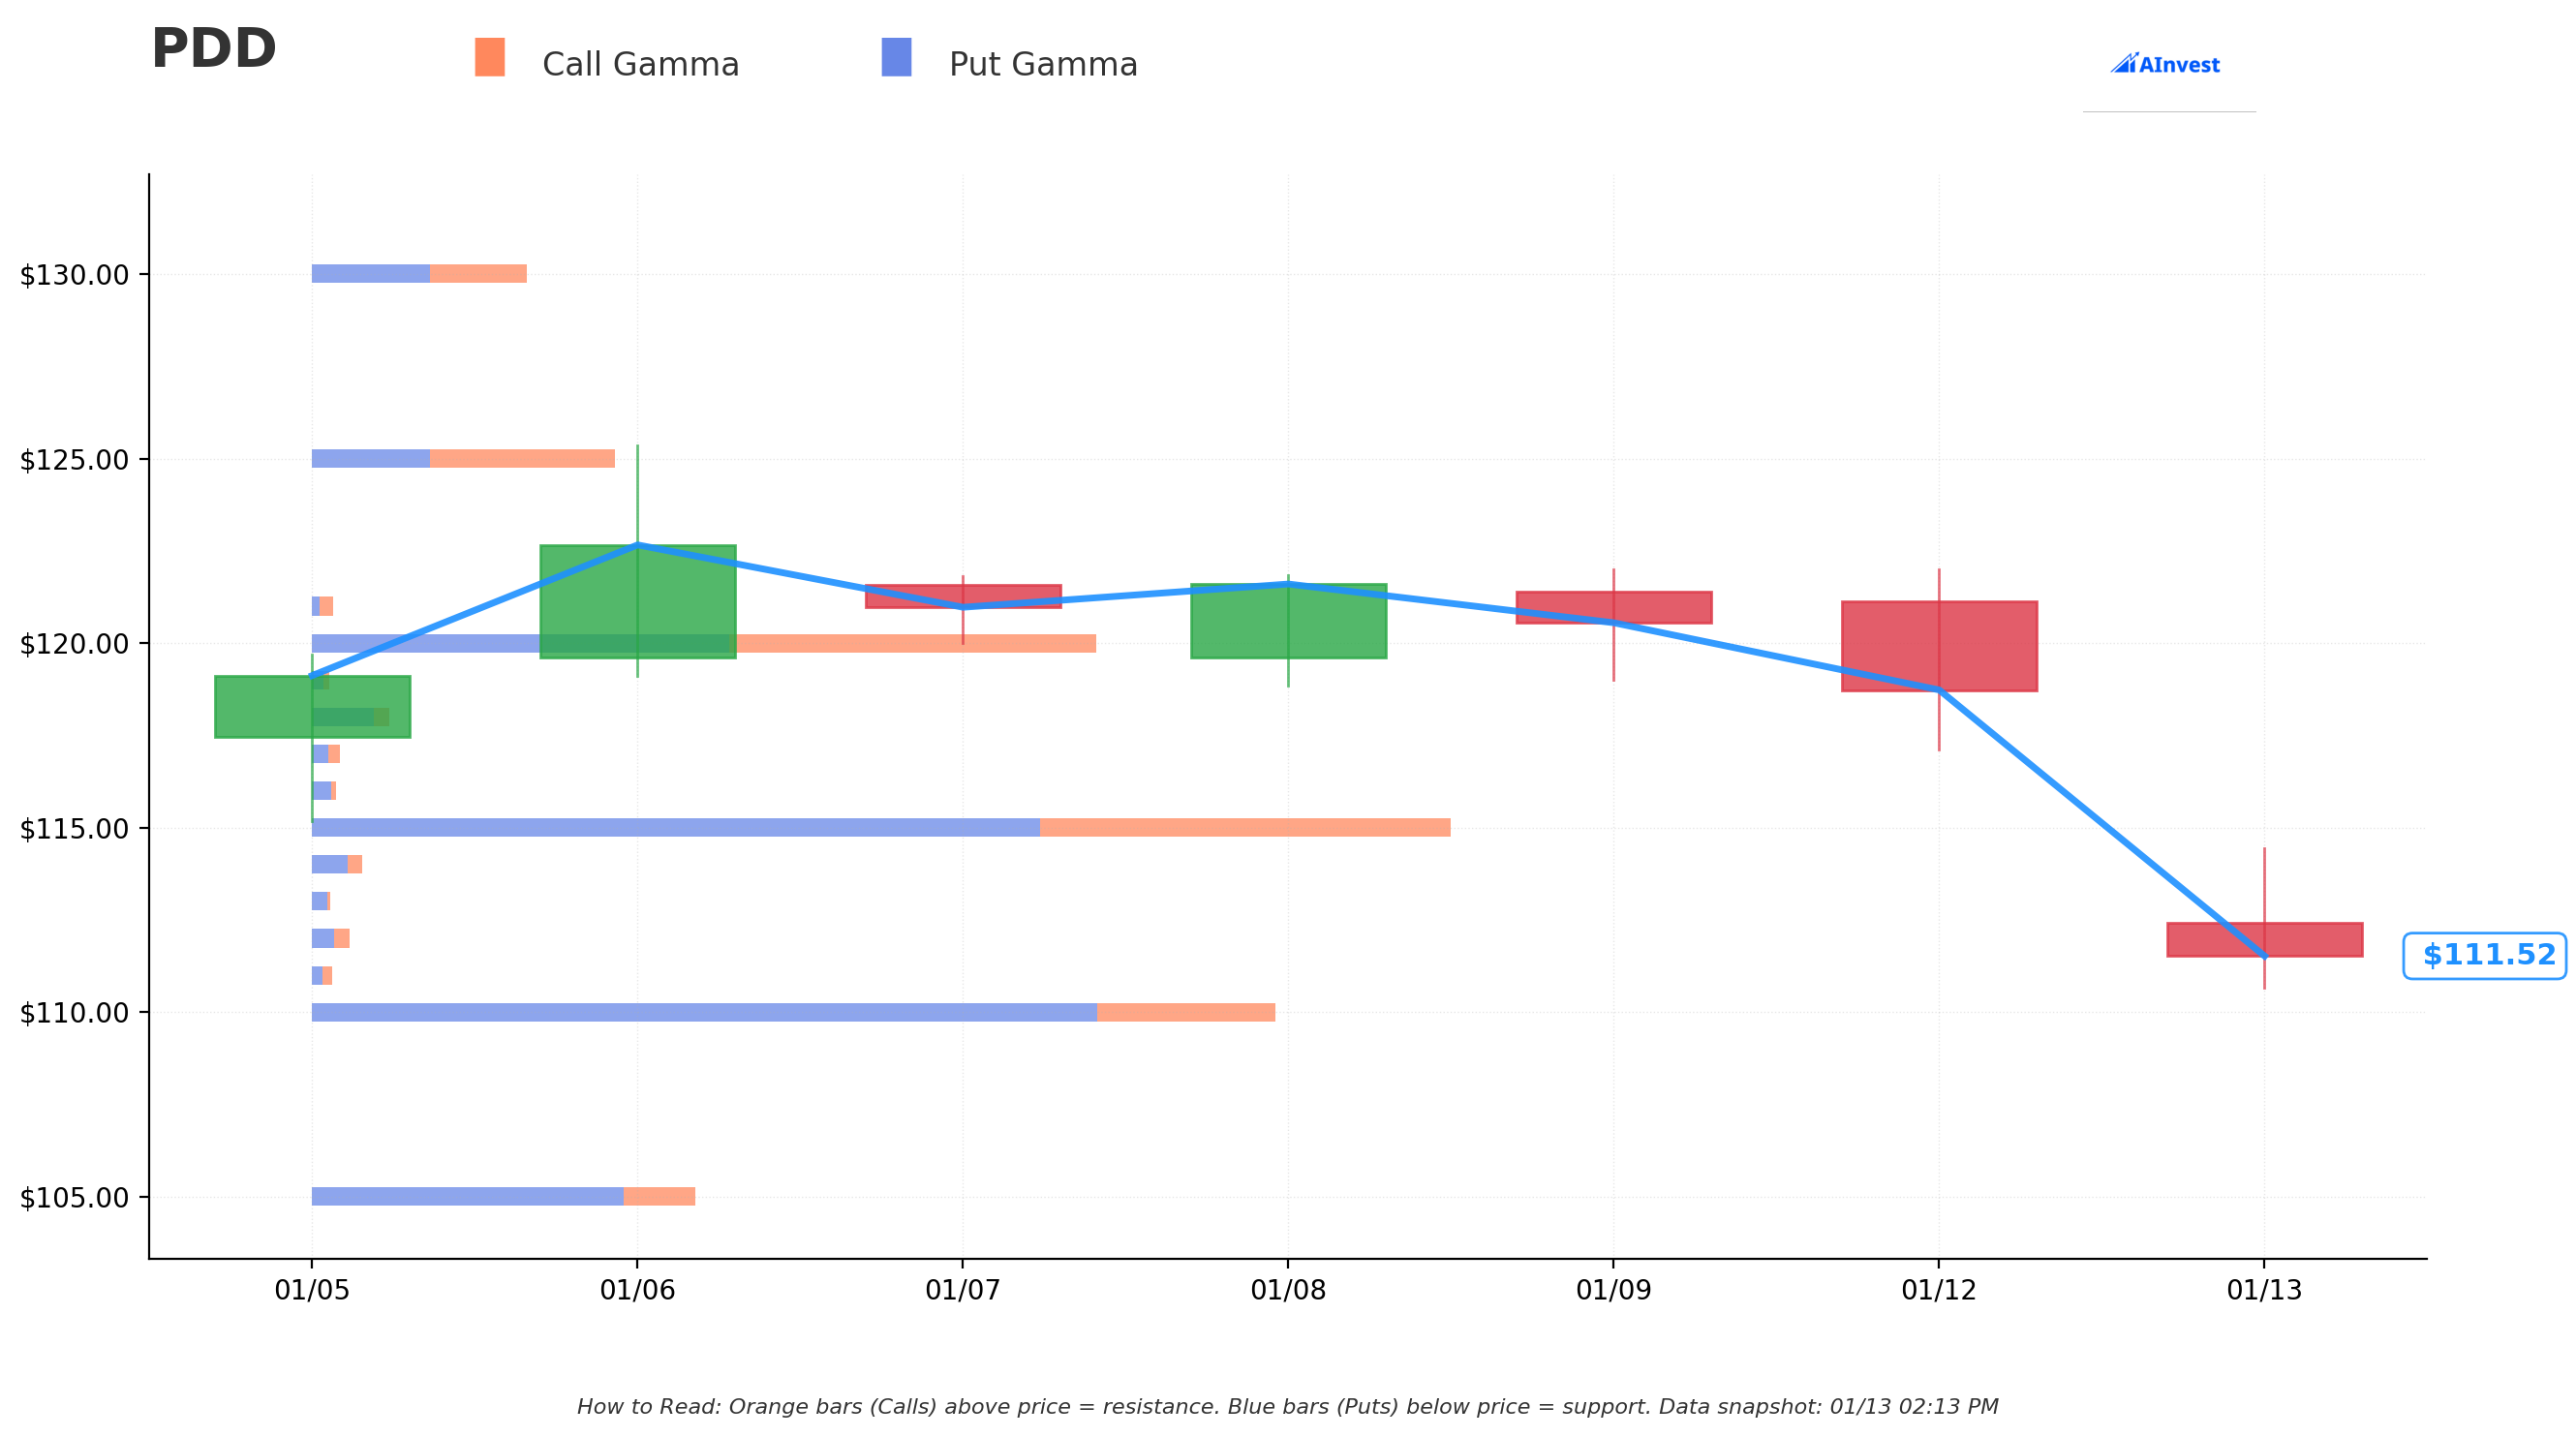
What the Gamma Tells Us:
The options market is showing a bearish net gamma bias with total put gamma (150.97) significantly exceeding call gamma (88.20).
Key Gamma Support Levels (Blue Bars):
| Strike | Distance | Total Gamma | Significance |
|---|---|---|---|
| $110 | -1.3% | 46.68 | STRONGEST - Heavy put concentration |
| $105 | -5.8% | 18.60 | Secondary support floor |
| $100 | -10.3% | 13.28 | Major psychological level |
| $95 | -14.8% | 2.79 | Distant support |
Key Gamma Resistance Levels (Orange Bars):
| Strike | Distance | Total Gamma | Significance |
|---|---|---|---|
| $115 | +3.2% | 54.36 | STRONGEST - Major resistance wall |
| $120 | +7.7% | 37.39 | Secondary resistance |
| $125 | +12.2% | 14.56 | Upper target if breakout occurs |
What This Means: The $110 strike has massive put gamma - this is exactly where the big put bet was placed. Market makers holding these positions will need to sell stock as price approaches $110, potentially accelerating any downside move. Conversely, the $115 resistance is formidable with call gamma creating a ceiling.
Implied Move Analysis
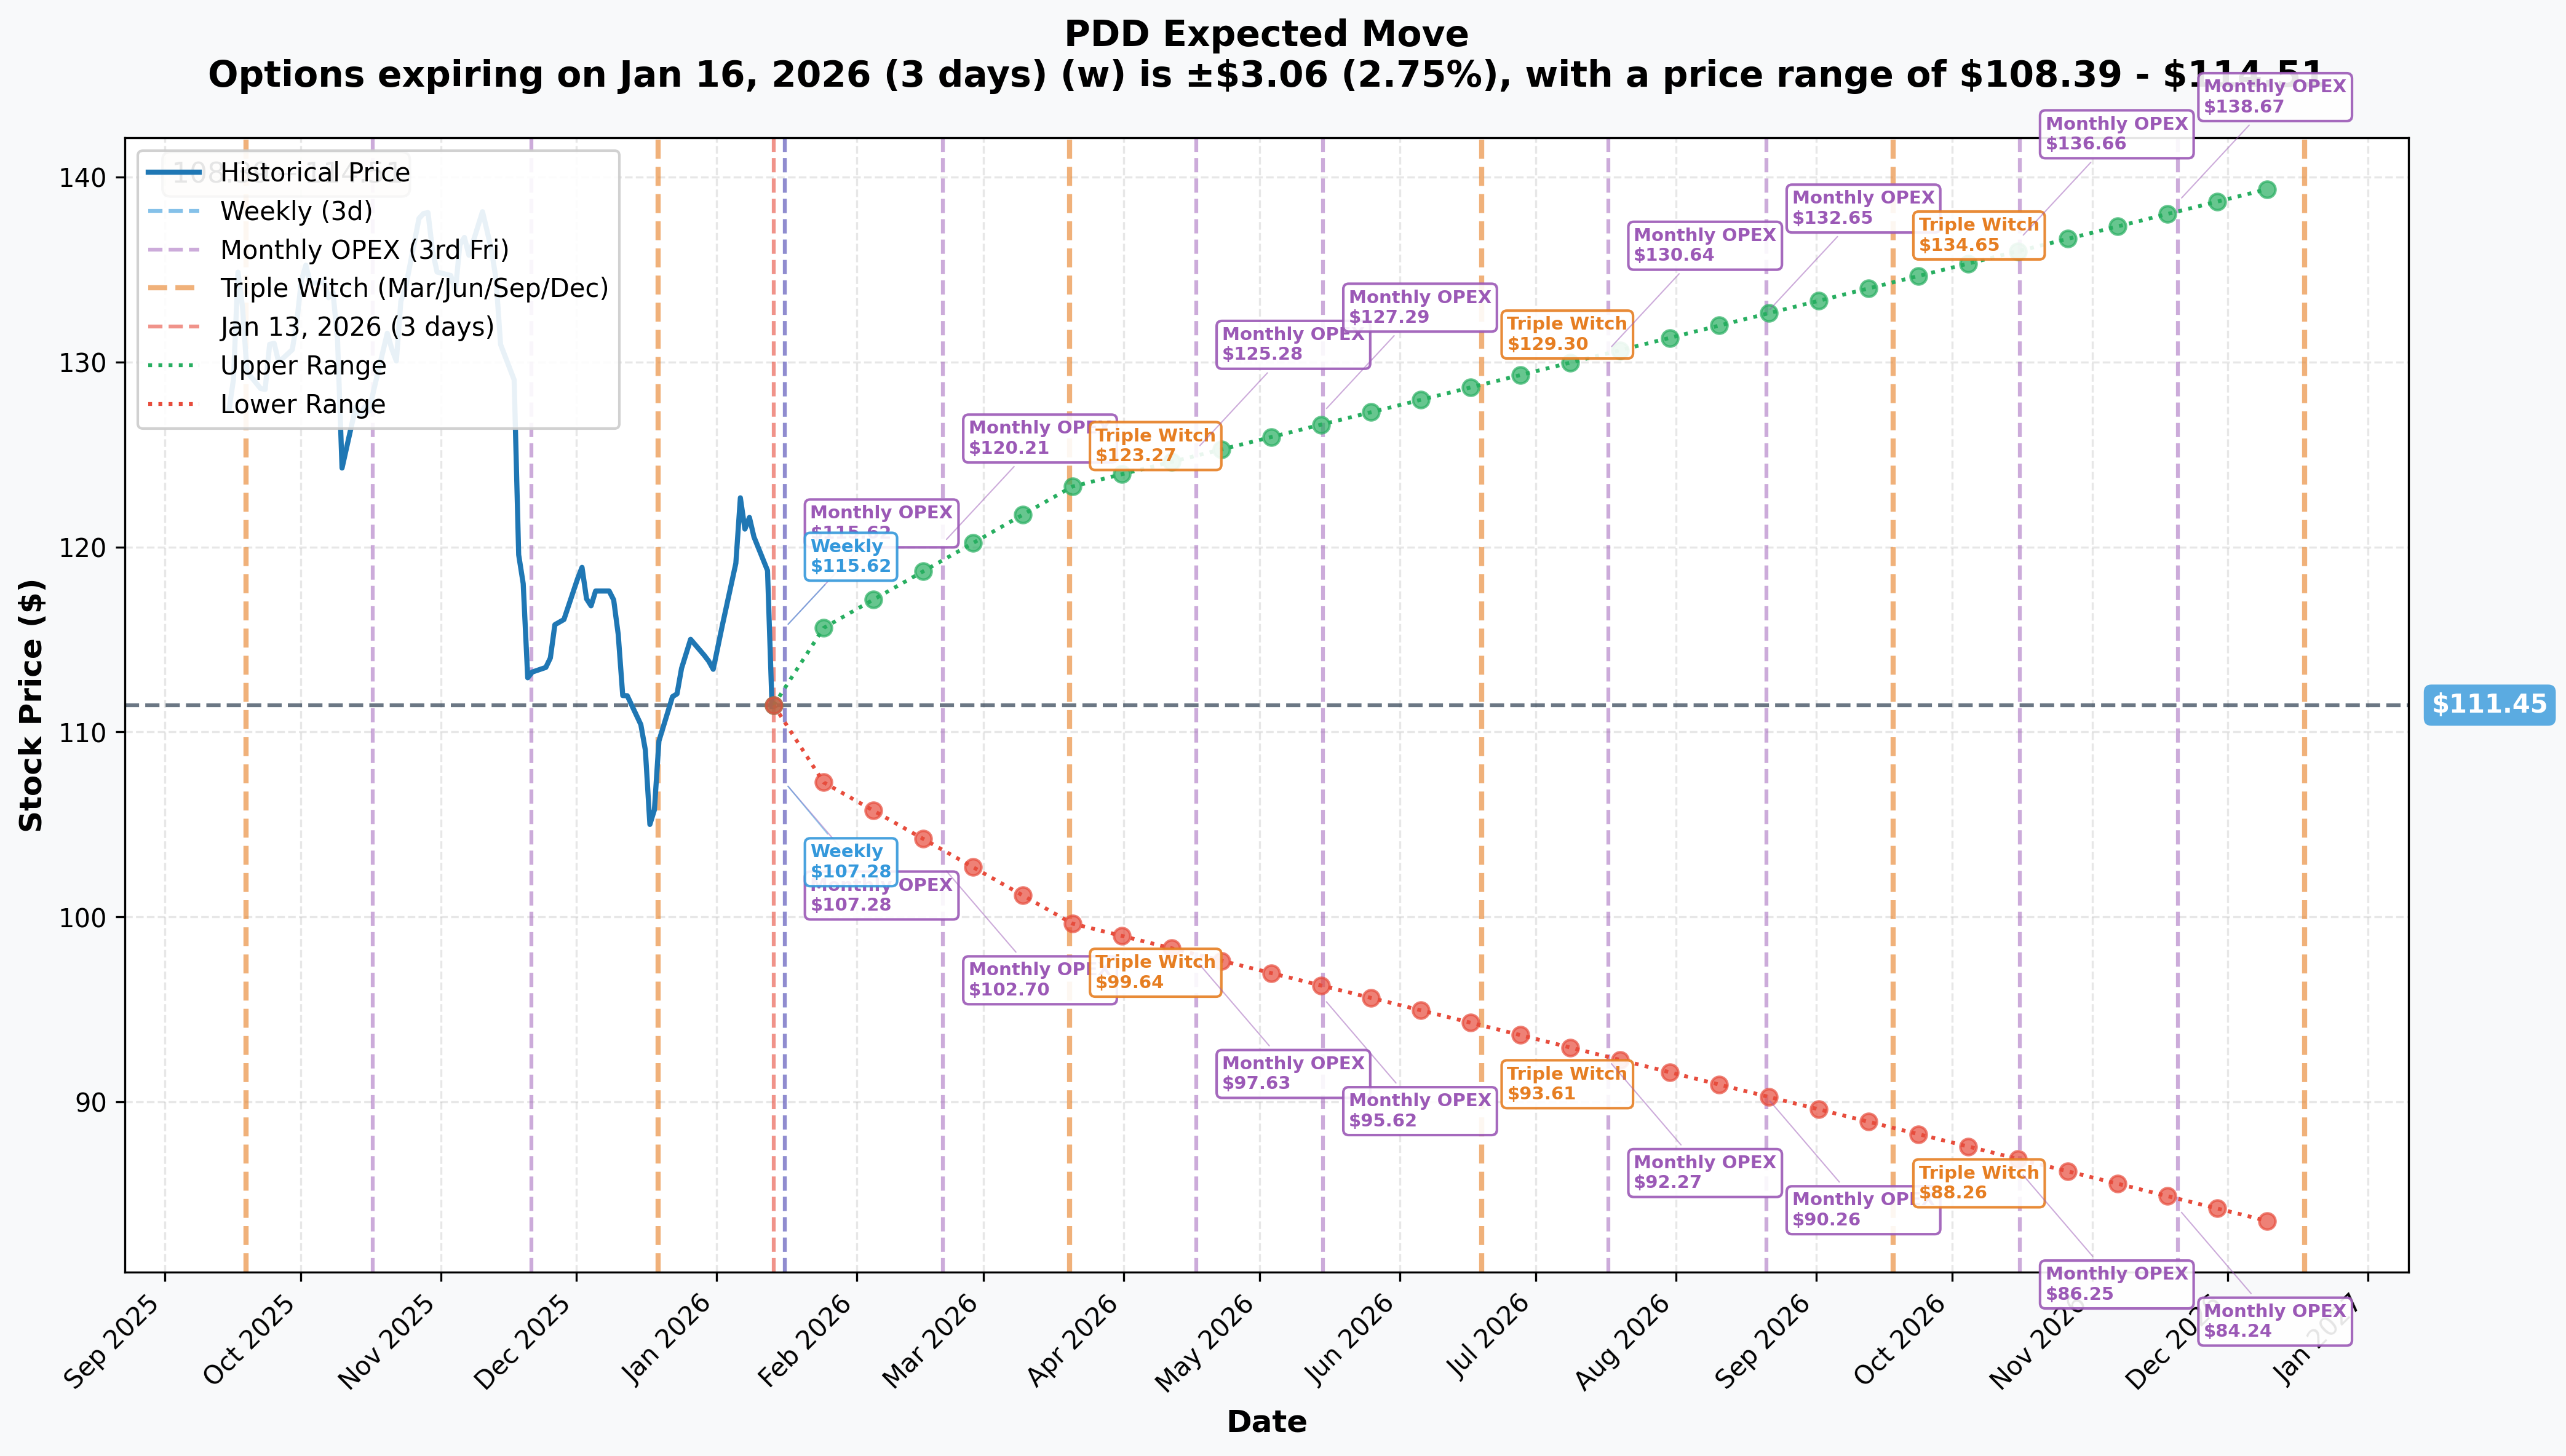
Options-Implied Price Ranges:
| Timeframe | Expiry | Implied Move | Range |
|---|---|---|---|
| Weekly | 2026-01-16 | +/- 2.75% | $108.39 - $114.51 |
| Monthly | 2026-02-20 | +/- 7.9% | $102.70 - $120.21 |
| Quarterly (March OPEX) | 2026-03-20 | +/- 10.6% | $99.64 - $123.27 |
| LEAPS | 2026-12-18 | +/- 25.5% | $83.02 - $139.89 |
Critical Insight: The $110 put strike sits right at the lower boundary of the weekly implied move ($108.39). By March 20 expiration, the implied range expands to $99.64 - $123.27. The trader is betting PDD moves toward the lower end of this expected range.
Catalysts
Upcoming Events (Next 6 Months)
| Date | Event | Impact Potential |
|---|---|---|
| March 23, 2026 | Q4 2025 / FY2025 Earnings | HIGH - Temu profitability update critical |
| Q1 2026 | EU DSA Investigation Update | MEDIUM - Potential fines up to 6% of revenue |
| Q1-Q2 2026 | China SAMR Resolution | HIGH - December 2025 incident outcome |
| Mid-2026 | EU Customs Duty Decision | MEDIUM - Impact on European growth |
Q4 Earnings Expectations:
- EPS Consensus: $2.89 - $2.93 (vs. $3.00 in Q3)
- Key focus: Temu GMV growth, U.S. vs. Europe revenue mix, margin pressure
Recent Events (Past 3 Months)
Q3 2025 Earnings (November 18, 2025):
- Revenue: RMB 108.3B (+9% YoY) - significant deceleration from triple-digit growth
- Net Income: RMB 29.3B (+17% YoY)
- Management warned of "ongoing evolution of competitive landscape and external uncertainties" - PDD Holdings IR
Regulatory Confrontation (December 2025):
- Physical altercations between PDD employees and SAMR officials during audit - Bloomberg Law
- PDD dismissed its government relations team following the incident
- Investigation related to alleged fraudulent deliveries on platform
U.S. Tariff Impact:
- De minimis exemption ended August 2025 - Marketplace
- U.S. DAUs dropped 52% in May vs. March 2025 - CNBC
- Temu app rank fell from top 3 to #132 on Apple App Store
Analyst Activity:
- Freedom Finance raised PT to $170 (January 6, 2026) - Yahoo Finance
- New Street downgraded to Neutral
- Consensus: 7 Buy / 4 Hold / 0 Sell with average PT of $131.73 - $148.64 - TipRanks
Price Targets & Probabilities
Based on gamma levels, implied move ranges, and catalyst timing:
Bull Case: $125+ (Probability: 25%)
Conditions Required:
- Q4 earnings beat with improved Temu profitability
- Positive SAMR investigation resolution
- Continued European GMV acceleration
- U.S.-China trade tensions ease
Technical Path: Need to break through $115 gamma wall, then $120 resistance. The $125 strike shows positive net gamma (call-heavy), suggesting a magnet effect if momentum builds.
Base Case: $105 - $115 (Probability: 50%)
Conditions:
- Mixed Q4 results (beat on EPS, miss on revenue growth)
- Ongoing regulatory uncertainty
- European growth offsets U.S. weakness
Technical Path: Stock oscillates between $110 gamma support and $115 gamma resistance. This is the "chop zone" where the big put buyer may see modest profits if price dips to $108-110 range.
Bear Case: $95 - $105 (Probability: 25%)
Conditions Required:
- Earnings miss or weak forward guidance
- Negative SAMR ruling (fines, operational restrictions)
- EU DSA investigation escalation
- Further tariff increases
Technical Path: Break below $110 gamma support triggers dealer hedging (selling), pushing toward $105, then $100 psychological floor. The implied move to $99.64 by March OPEX suggests this is within the expected range.
Trading Ideas
Conservative: "Sleep Well" Cash-Secured Put
Strategy: Sell the March 20, 2026 $100 Put
- Premium collected: ~$2.00-2.50 per contract
- Max profit: $200-250 per contract if PDD stays above $100
- Assignment risk: Own PDD at $97.50-98 effective cost basis (10% below current)
- Why this works: $100 is a major psychological and gamma support level. You get paid to wait for a better entry while the stock trades sideways.
Balanced: Put Spread Hedge
Strategy: Buy March 20 $110 Put / Sell March 20 $100 Put
- Net cost: ~$3.00-3.50 per spread
- Max profit: $10 per spread ($1,000 per contract) if PDD below $100
- Max loss: Premium paid (~$350)
- Why this works: Mirrors institutional positioning at lower cost. Defined risk, defined reward. Profits if regulatory concerns materialize into earnings.
Aggressive: Follow the Smart Money
Strategy: Buy March 20, 2026 $110 Puts
- Cost: ~$5.50 per contract ($550 per contract)
- Breakeven: $104.45 (-6.3% from current)
- Max profit: Theoretically unlimited to downside
- Why this works: Directly replicates the $2.7M institutional trade. High risk but potentially high reward if bearish thesis plays out.
Risk Factors
For Bears (Betting Against PDD):
- Valuation cushion: Forward P/E of 9.4x with $60B+ cash provides significant downside protection
- European pivot working: Temu's EU GMV now exceeds U.S. (40% vs. 31%) - Tech Buzz China
- Analyst consensus bullish: 28%+ upside to average price target
- Short squeeze potential: If bad news doesn't materialize, shorts could get squeezed
For Bulls (Betting On PDD):
- Regulatory overhang: SAMR investigation, EU DSA probe, U.S. lawsuits all pending - eMarketer
- Revenue deceleration: Q3 growth of 9% YoY vs. triple-digit during Temu launch
- Institutional selling: Major funds (Tiger Global, Mirae Asset, FMR) significantly reduced positions in 2025 - HedgeFollow
- VIE structure risk: ADR delisting concerns persist for Chinese companies
- No capital return: Despite $38B+ cash, no dividends or buybacks
The Bottom Line
Real talk: A $2.7M put bet on PDD is a significant signal, but context matters. This trade is:
- Hedging, not panic: The March expiration and slightly OTM strike suggest this is likely portfolio protection ahead of earnings, not a conviction short
- Aligned with risks: Regulatory troubles in three jurisdictions, slowing growth, and tariff headwinds provide fundamental backing
- Not betting on collapse: The $110 strike is only 1.3% below current price - this is cautious positioning, not a crash prediction
Action Plan:
If You Already Own PDD:
- Consider buying protective puts (March $105 or $100) to hedge earnings risk
- Set a mental stop at $105 (gamma support breakdown level)
- Watch March 23 earnings closely for Temu margin commentary
If You're Watching PDD:
- Wait for a dip toward $108-110 range before initiating long positions
- The $100-105 zone offers better risk/reward entry if reached
- Consider selling cash-secured puts at $100 to get paid while waiting
If You're Bearish on PDD:
- The March $110/$100 put spread offers defined-risk downside exposure
- Mark your calendar: March 23 earnings is the key catalyst
Key Levels to Watch:
- Upside resistance: $115 (gamma wall), $120 (secondary), $125 (breakout target)
- Downside support: $110 (critical), $105 (secondary), $100 (floor)
- Implied range by March 20: $99.64 - $123.27
Disclaimer: This analysis is for informational purposes only and does not constitute investment advice. Options trading involves substantial risk of loss and is not suitable for all investors. Past performance does not guarantee future results. Always conduct your own research and consult with a qualified financial advisor before making investment decisions.
Analysis generated: 2026-01-13 Data sources: Options flow data, PDD Holdings IR