🔻 PYPL: $14.4M in Put Activity as PayPal Crashes 20% on CEO Exit & Earnings Miss
📅 February 3, 2026 | 🔥 Extremely Unusual Activity Detected
🎯 The Quick Take
Three massive put trades totaling $14.4M in premium hit the tape today as PayPal nosedived 20% following a Q4 earnings miss and the sudden firing of CEO Alex Chriss. These aren't random bets -- they tell a story of institutional positioning gone right, gone wrong, and hedged to perfection. With the stock now trading at $41.94 (hitting 52-week lows), the options market reveals how the big money was positioned for this collapse.
🏢 Company Overview
PayPal Holdings, Inc. (NASDAQ: PYPL) operates as a global digital payments processor, facilitating electronic transactions for both merchants and consumers. The company was spun off from eBay in 2015 and has since built a portfolio that includes the popular Venmo peer-to-peer payment service.
| Metric | Value |
|---|---|
| Market Cap | $48.96B (post-crash) |
| Employees | 24,400 |
| Headquarters | San Jose, CA |
| 52-Week Range | $41.92 - $89.71 |
| Active Users | 434M accounts |
| Sector | Business Services / Digital Payments |
💰 The Option Flow Breakdown
📊 What Just Happened
Three standalone put trades with a combined $14.4M in premium -- each telling a different story:
| Time | Type | Expiration | Strike | Premium | Order | Z-Score | Signal |
|---|---|---|---|---|---|---|---|
| 09:37:35 | BUY PUT | 2026-06-18 | $80 | $4.6M | BTC | 6.24 | 📈 Hedge Closed |
| 10:13:41 | BUY PUT | 2026-12-18 | $40 | $1.8M | BTO | 300.53 | 🐻 New Bear Bet |
| 11:04:15 | SELL PUT | 2026-02-06 | $49 | $8M | STC | 5.33 | 📈 Position Exit |
Total Premium: $14.4M across 3 trades
🤓 What Each Trade Actually Means
Trade 1: $4.6M June $80 Put (Buy to Close) 📈
- What it is: Someone is CLOSING an existing short put position at the $80 strike
- Translation: This trader previously sold (wrote) puts at $80, betting the stock would stay above that level. Now they're buying back that position at a massive profit since PYPL crashed to $41.94
- The math: With PYPL at ~$42, these $80 puts are now worth roughly $38 intrinsic value each. The original seller likely collected pennies when the stock was higher, and now they're closing before expiration to lock in gains
- What it signals: Someone made a fortune on this collapse and is cashing out
Trade 2: $1.8M December $40 Put (Buy to Open) 🐻
- What it is: A NEW bearish position betting PYPL falls below $40 by December
- Z-Score of 300.53: This is extreme -- roughly 300x the average daily volume for this contract. Activity this unusual happens only a few times per year
- Vol/OI Ratio of 4.455: Massive fresh positioning, not just rolling existing positions
- Translation: Someone is betting $1.8M that PayPal continues bleeding. With shares at $41.94, this strike is nearly at-the-money
- What it signals: Institutional conviction that the worst isn't over. They're giving this trade 10 months to play out
Trade 3: $8M February $49 Put (Sell to Close) 📈
- What it is: The LARGEST trade of the day -- someone is CLOSING a put they previously bought
- Timeline context: This put was likely purchased BEFORE earnings when PYPL was trading ~$52-55
- Translation: A trader who bought downside protection is now selling it at a massive profit after the 20% crash
- The math: These $49 puts are now ~$7 in-the-money. If they paid $1-2 for this protection, they're looking at 300-700% returns
- What it signals: The "smart money" hedged their long positions perfectly and is now banking profits
🎭 The Complete Picture
These three trades paint a clear narrative:
- Pre-earnings hedgers (Trade 3) bought puts before the crash and are now cashing out at massive profits
- Put sellers (Trade 1) who bet against volatility are closing their underwater positions
- New bears (Trade 2) see this crash as the beginning, not the end, and are loading up for more downside
📈 Technical Setup
YTD Chart Analysis
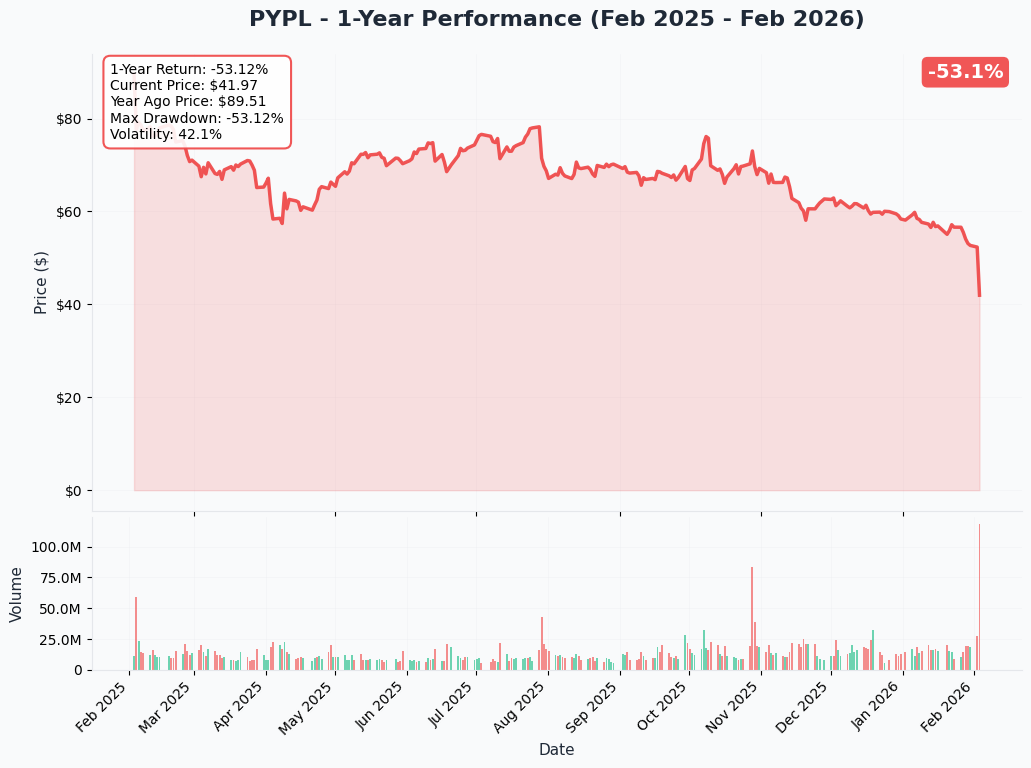
PayPal has been in a brutal downtrend throughout 2025-2026. The stock peaked near $90 in early 2025 and has systematically broken every support level. Today's 20% gap down represents a capitulation event, with the stock now trading at levels not seen since the COVID crash.
Key Observations:
- 📉 Down 53% from 52-week high of $89.71
- 📉 Broke below the critical $50 psychological support
- 📉 Gap down through multiple moving averages
- ⚠️ No clear technical support until the $35-40 zone
🎯 Gamma-Based Support & Resistance Analysis
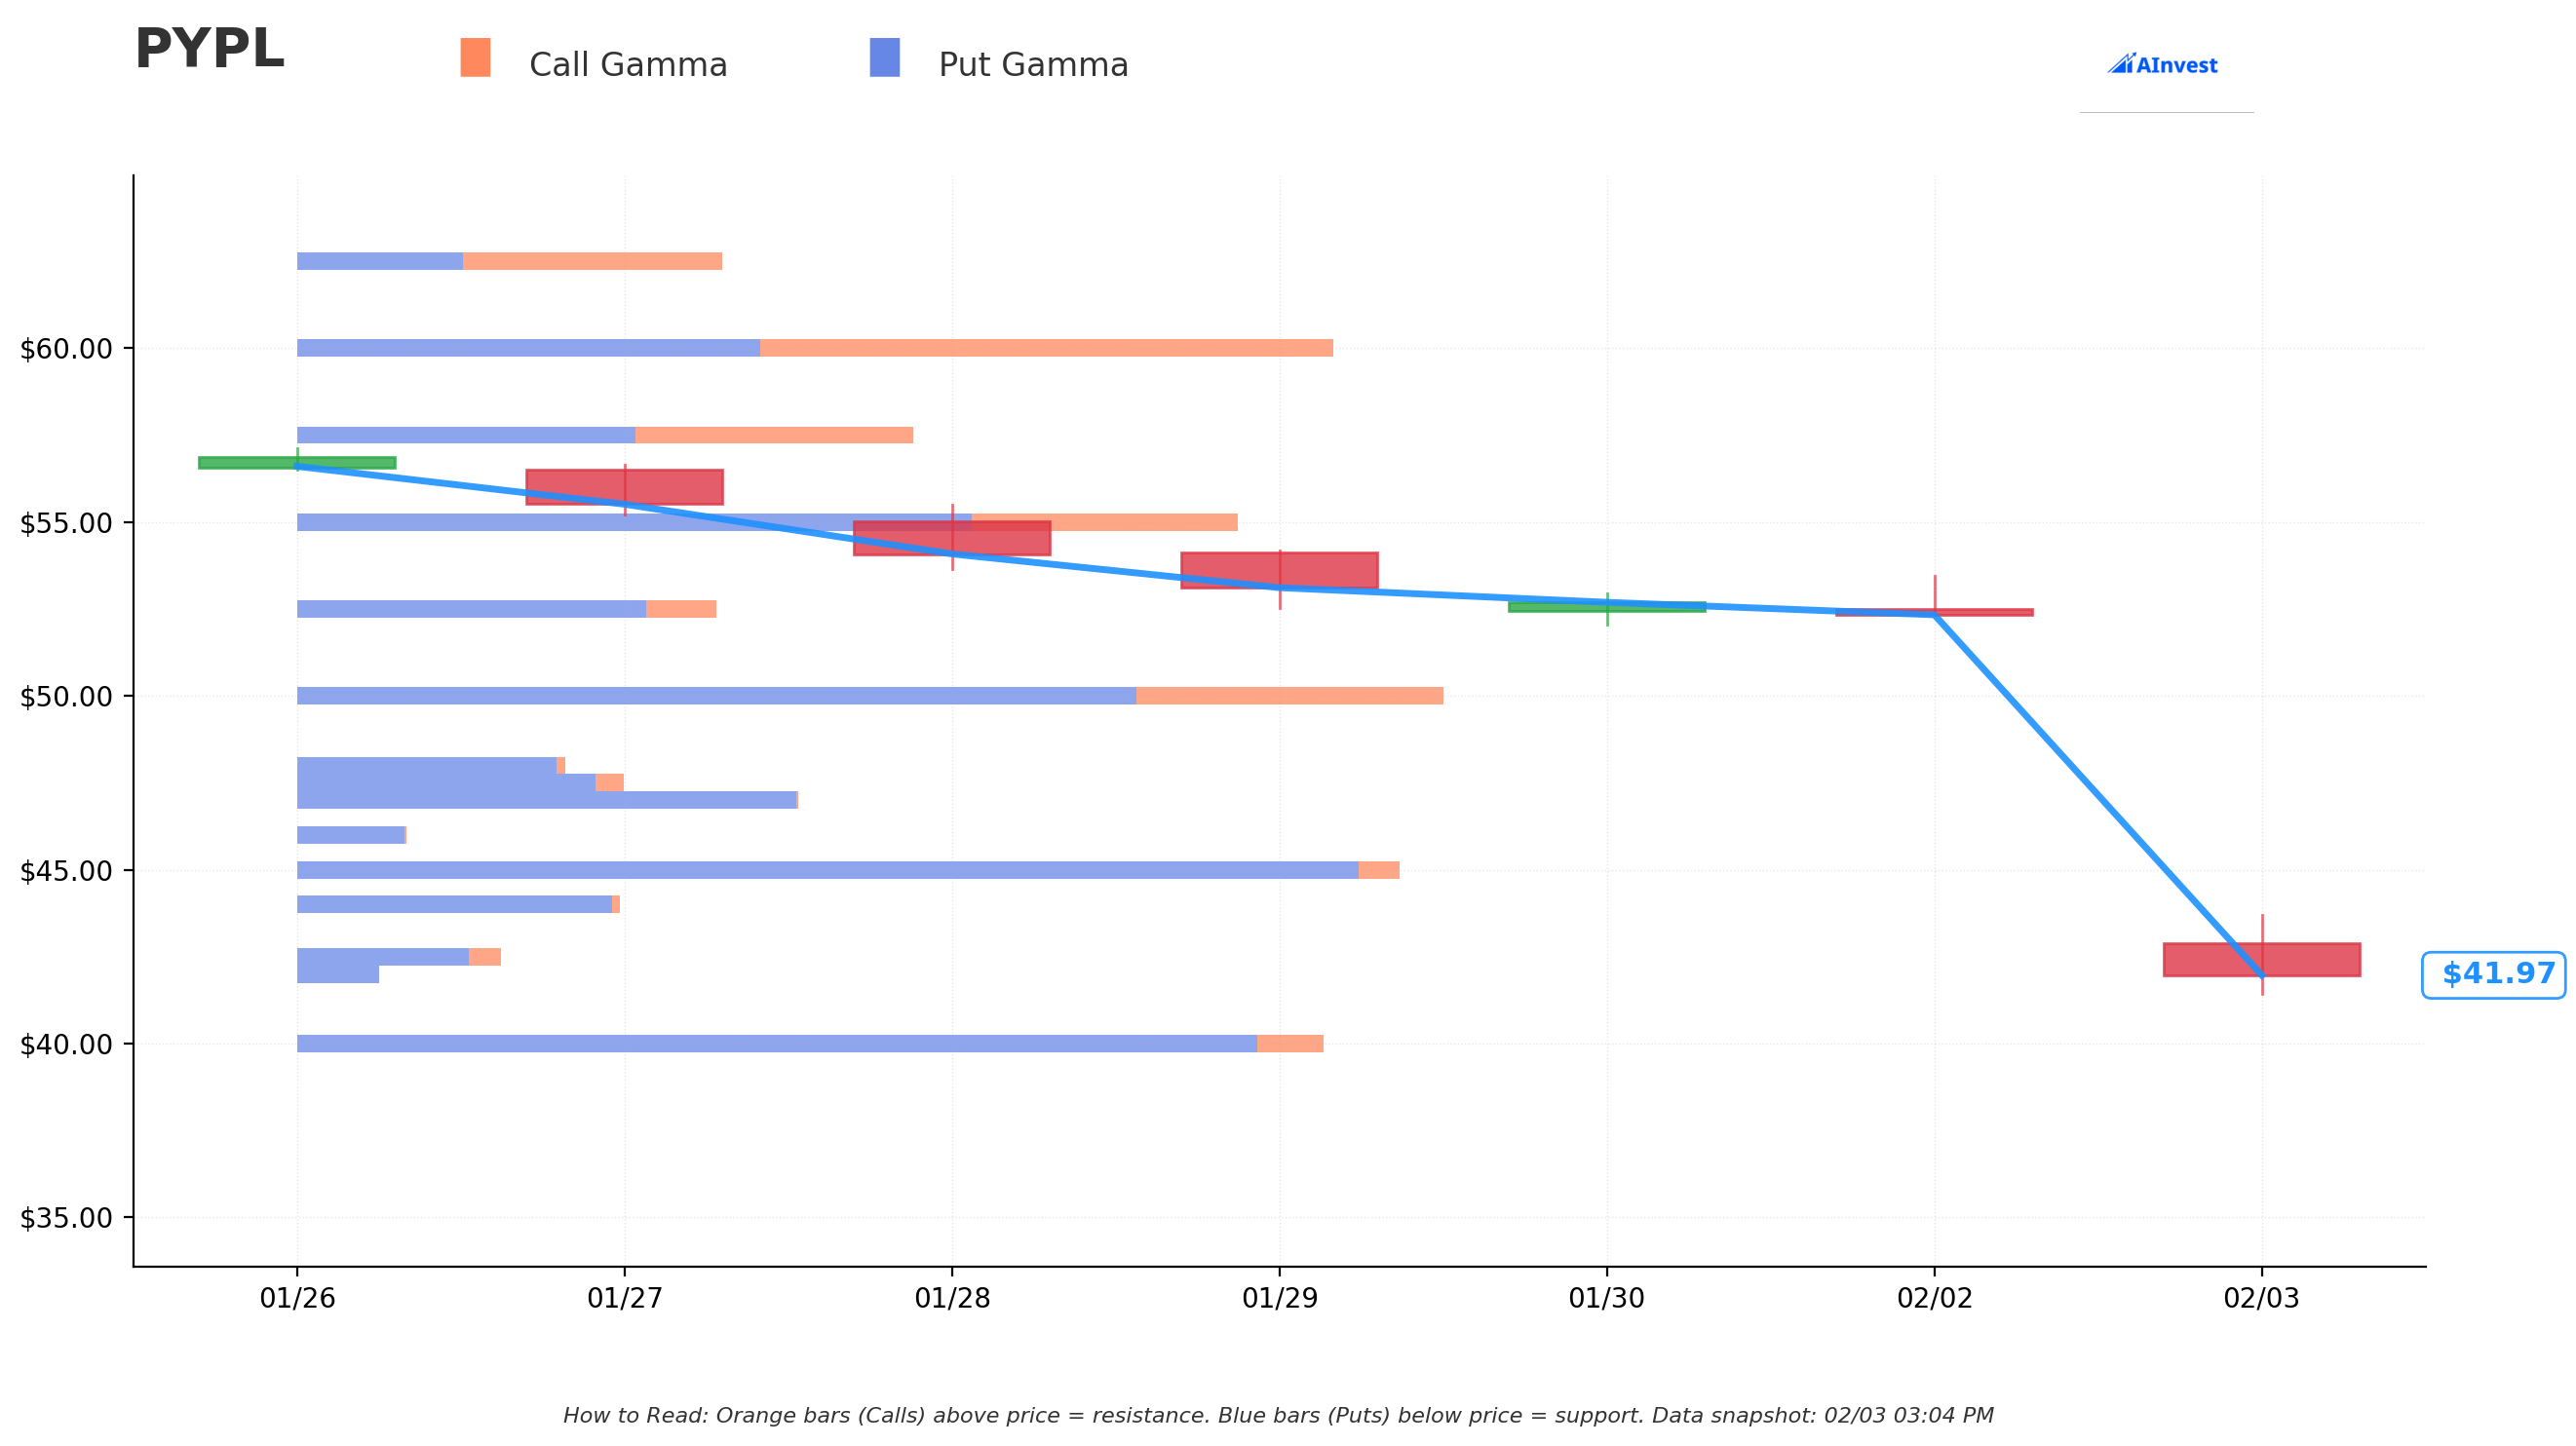
Current Price: $41.94
| Level | Type | Gamma Exposure | Distance | Strength |
|---|---|---|---|---|
| $40 | 🔵 Support | $8.8B | -4.6% | Strong |
| $45 | 🟠 Resistance | $9.4B | +7.3% | Strong |
| $50 | 🟠 Resistance | $10.7B | +19.2% | Major Wall |
| $55 | 🟠 Resistance | $8.2B | +31.1% | Strong |
| $60 | 🟠 Resistance | $8.9B | +43.1% | Strong |
What This Means:
- 🔵 $40 is the only significant support below -- if this breaks, there's minimal gamma cushion until much lower
- 🟠 $45 is the first resistance hurdle -- market makers will likely sell into any bounce here
- 🟠 $50 is a brick wall -- the largest gamma concentration creates massive selling pressure at this level
- ⚠️ Limited downside protection -- the gamma profile suggests freefall risk if $40 breaks
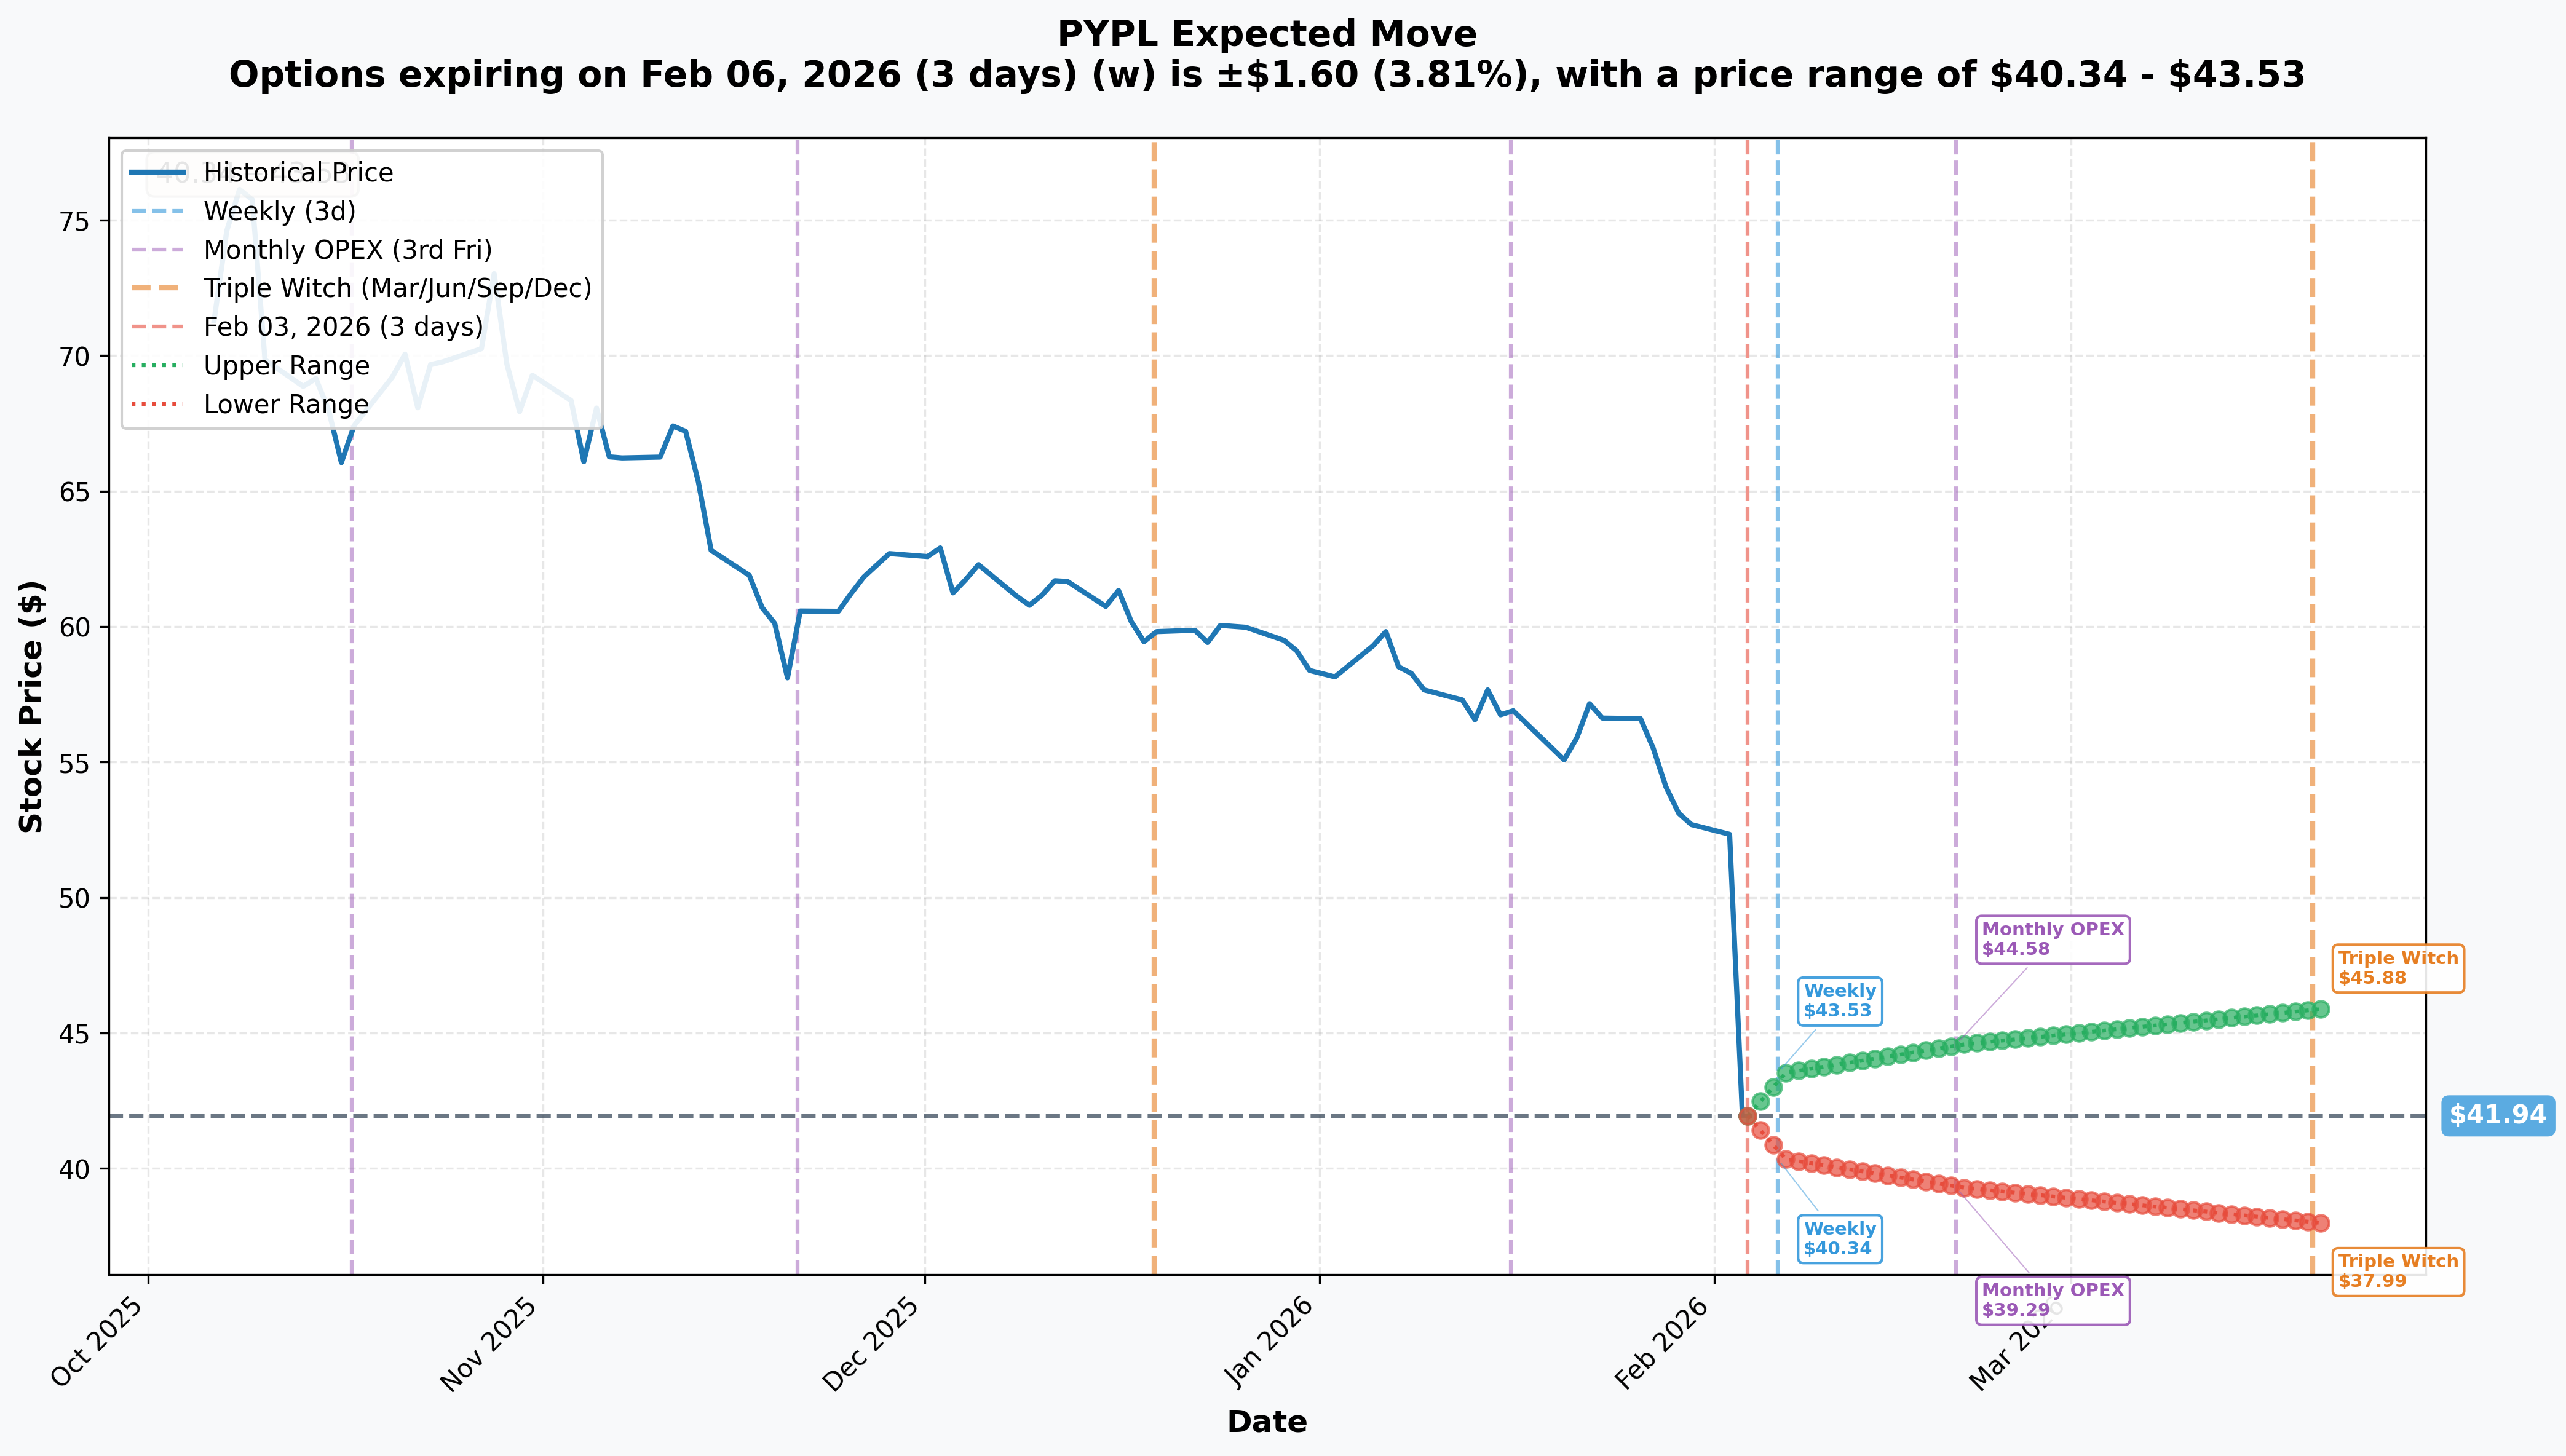
📊 Implied Move Analysis
| Timeframe | Expiry | Expected Move | Range |
|---|---|---|---|
| Weekly | 2026-02-06 | +/- 3.8% | $40.34 - $43.53 |
| Monthly OPEX | 2026-02-20 | +/- 6.3% | $39.29 - $44.58 |
| Quarterly | 2026-03-20 | +/- 9.4% | $37.99 - $45.88 |
Key Insight: Today's 20% move was nearly 3x the expected volatility. Options were pricing in ~7.3% earnings move, and PYPL delivered a 20% collapse. This explains why pre-positioned puts made massive profits.
🎪 Catalysts
✅ Recent Events (Already Happened)
| Date | Event | Impact |
|---|---|---|
| Feb 3, 2026 | Q4 Earnings Miss | Revenue $8.68B vs $8.79B expected; EPS $1.23 vs $1.29 expected |
| Feb 3, 2026 | CEO Fired | Alex Chriss out after 2.5 years; HP's Enrique Lores appointed |
| Feb 3, 2026 | 2026 Guidance Cut | Low single-digit EPS decline vs. prior growth expectations |
| Feb 3, 2026 | Stock Crash | -20% single-day decline, erasing ~$10B in market cap |
Why the CEO Change Matters: According to PayPal's official announcement, the Board stated "the pace of change and execution under Chriss was not in line with expectations." When a Board fires a CEO on earnings day, it signals deep problems beyond a single quarter miss.
📅 Upcoming Catalysts
| Date | Event | Potential Impact |
|---|---|---|
| Mar 1, 2026 | New CEO Starts | Enrique Lores takes over; potential strategic reset announcement |
| Apr 28, 2026 | Q1 2026 Earnings | First results under new leadership; consensus EPS $1.38 |
| Nov 2026 | EU CCD II Regulation | BNPL compliance costs increase |
🎲 Price Targets & Probabilities
Based on gamma levels, implied move ranges, and catalyst analysis:
🐻 Bear Case: $35-38 (30% probability)
Scenario: New CEO announces strategic review, potential restructuring charges, or competitive headwinds continue. The $40 gamma support breaks, triggering stop-losses and margin calls.
Supporting evidence:
- $1.8M December $40 put (BTO) suggests institutions see sub-$40 as realistic
- Limited gamma support below current price
- Branded checkout growth collapsed to 1% -- structural problem
- Morgan Stanley's $50 target now looks optimistic post-crash
⚖️ Base Case: $40-45 (45% probability)
Scenario: Stock consolidates around current levels as market digests the earnings miss and leadership change. Gamma support at $40 holds, resistance at $45 caps rallies.
Supporting evidence:
- Weekly implied move suggests $40.34 - $43.53 range
- $40 has $8.8B in gamma support -- meaningful floor
- 10x forward P/E creates value buyer interest
- $6B buyback provides technical support
🚀 Bull Case: $50-55 (25% probability)
Scenario: New CEO Lores announces aggressive turnaround plan, Fastlane adoption accelerates, or activist investor emerges. Stock rallies to test the $50 gamma wall.
Supporting evidence:
- Stock trades at 72% discount to historical P/E
- Venmo (+20%) and BNPL (+20%) growth remains strong
- Analyst consensus target remains $75-77 despite downgrades
- Dividend initiation and $6B buyback signal capital return focus
💡 Trading Ideas
🛡️ Conservative: "Damaged Goods Income Play"
Strategy: Sell Cash-Secured Put at $35 strike, March 20 expiration
Details:
- Collect ~$1.00-1.50 premium per contract
- Effective cost basis if assigned: $33.50-34.00 (20% below current)
- Max gain: Premium collected (~3-4% in 45 days)
- Break-even: $33.50
Why this works: If PYPL is a broken stock heading lower, you get paid to wait. If it stabilizes, you keep premium. Only get assigned if stock falls another 15%+ from already depressed levels.
Risk: Unlimited downside if PYPL collapses further
⚖️ Balanced: "Dead Cat Defense" Put Spread
Strategy: Buy $40/$35 Put Spread, April expiration
Details:
- Buy $40 put, sell $35 put
- Net debit: ~$1.50-2.00 per spread
- Max gain: $5.00 - premium = ~$3.00-3.50 per spread (175-200% return)
- Max loss: Premium paid
Why this works: Captures further downside move to the $35-40 zone that the $1.8M December put buyer is targeting. Defined risk, limited capital at stake.
Risk: Stock stabilizes above $40 and you lose premium
🚀 Aggressive: "Capitulation Bounce" Call Spread
Strategy: Buy $42.50/$47.50 Call Spread, February 20 expiration
Details:
- Buy $42.50 call, sell $47.50 call
- Net debit: ~$1.00-1.50 per spread
- Max gain: $5.00 - premium = ~$3.50-4.00 per spread (250-300% return)
- Max loss: Premium paid
Why this works: Massive single-day drops often see relief bounces. The monthly implied move suggests upside to $44.58 is within range. Quick trade for potential snap-back.
Risk: Stock continues bleeding or consolidates sideways
⚠️ Risk Factors
🔴 Execution Risk
- CEO transition creates strategic uncertainty
- New CEO Lores has no fintech experience -- he ran a printer company
- Management rescinded multi-year guidance, providing only single-year outlook
🔴 Competitive Pressure
- Apple Pay integration expanding across browsers (Chrome, Firefox, Edge)
- Branded checkout growth collapsed to 1% from 6% -- structural market share loss
- Stripe gaining share in online checkout
🔴 Valuation Trap Risk
- Stock looks cheap at 10x forward P/E
- But earnings declining, not growing
- "Value trap" where cheap gets cheaper
🔴 Technical Damage
- Broke below major support levels
- Gap down creates overhead resistance
- Momentum traders will short rallies
🔴 Institutional Sentiment
- Hedge fund confidence rated "Very Negative"
- 40% bearish options flow vs 52% bullish on Feb 3
- Multiple analyst downgrades (Rothschild: Sell, Morgan Stanley: Underweight)
🎯 The Bottom Line
Real talk: PayPal just had a terrible day -- 20% crash, CEO fired, guidance cut, and competitive concerns mounting. The $14.4M in put activity tells us that institutions were positioned for this. The $8M STC profit-taking shows hedges worked. The $1.8M BTO at $40 shows bears see more downside ahead.
Here's the deal:
📉 If you're bearish: The $1.8M December $40 put buyer has 10 months for their thesis to play out. They're betting the turnaround fails. Consider defined-risk put spreads to join this view without unlimited downside.
🤝 If you're neutral: Let the dust settle. Wait for the new CEO to outline his strategy (March 1 start date). The implied move suggests $40-44 range for the next few weeks -- no rush to act.
📈 If you're bullish: This is a contrarian play requiring conviction. The stock is cheap (10x P/E), has buyback support ($6B), and analyst targets averaging $76 suggest massive upside. But you're fighting the tape and the CEO change narrative.
Mark your calendar:
- 🗓️ March 1: New CEO Lores officially starts
- 🗓️ April 28: Q1 2026 earnings -- first report under new leadership
The lesson here: When a stock crashes 20% AND the CEO gets fired on the same day, the options market usually has it figured out before the news drops. Pay attention to unusual activity -- it's often the early warning system.
📊 Option Flow Summary
| Metric | Value |
|---|---|
| Total Premium | $14.4M |
| Highest Z-Score | 300.53 (December $40 Put) |
| Dominant Flow | Mixed -- profit-taking meets new bearish bets |
| Sentiment | Cautiously bearish |
View detailed option charts:
Disclaimer: Options involve significant risk of loss and are not suitable for all investors. The unusual options activity discussed here does not constitute a recommendation to buy or sell any security. Always conduct your own research and consider your risk tolerance before trading.
Data sources: PayPal Investor Relations, CNBC, TipRanks, Seeking Alpha, Benzinga Options