🔮 QQQ Calendar Put Spread - Smart Money's $51M Earnings Season Hedge! 🛡️
📅 December 2, 2025 | 🔥 Unusual Activity Detected
🎯 The Quick Take
Someone just executed a $51 MILLION calendar put spread on QQQ this morning at 11:54:56! This sophisticated institutional trade bought 10,500 contracts of April $625 puts for $32M while simultaneously selling 10,500 contracts of January $625 puts for $19M - creating a $13M net debit position betting on elevated volatility through Q4 2024 earnings season but stability into early 2026. With QQQ trading at $620.08 and the Nasdaq-100 facing three major December catalysts (Fed meeting 12/9-10, reconstitution 12/12, Q4 earnings), smart money is positioning for near-term chop followed by longer-term uncertainty. Translation: Institutions expect the first quarter to be bumpy, then REALLY bumpy in Q2!
📊 ETF Overview
Invesco QQQ Trust (QQQ) is the premier ETF for gaining exposure to the Nasdaq-100 index and the tech giants driving market returns:
- Fund Name: Invesco QQQ Trust, Series 1
- Primary Exchange: Nasdaq
- Current Price: $620.08 (up 20.14% YTD, near 52-week high of $637.01)
- Top Holdings: NVDA (14.10%), MSFT, AAPL, GOOGL, META, AMZN, TSLA
- Concentration: Magnificent 7 stocks comprise 44.9% of the index
- Beta: 1.15 (15% more volatile than broader market)
- Primary Exposure: Technology, AI infrastructure, growth mega-caps
💰 The Option Flow Breakdown
The Tape (December 2, 2025 @ 11:54:56):
| Time | Symbol | Buy/Sell | Call/Put | Expiration | Premium | Strike | Volume | OI | Size | Spot | Option Price | Option Symbol |
|---|---|---|---|---|---|---|---|---|---|---|---|---|
| 11:54:56 | QQQ | BUY | PUT $625 04/17 | 2026-04-17 | $32M | $625 | 11K | 6K | 10,500 | $620.08 | $30.51 | QQQ 625P 04/17 |
| 11:54:56 | QQQ | SELL | PUT $625 01/16 | 2026-01-16 | $19M | $625 | 11K | 1.5K | 10,500 | $620.08 | $18.14 | QQQ 625P 01/16 |
🤓 What This Actually Means
This is a calendar put spread (also called "time spread") - a sophisticated institutional volatility trade! Here's the breakdown:
- 📅 Structure: Buy April 17 $625 puts ($32M), Sell January 16 $625 puts ($19M) = $13M net debit
- 🎯 Same strike, different dates: Both legs at $625 (0.8% above current $620 price)
- ⏰ Time difference: 92 days between expirations (Jan 16 → Apr 17)
- 💡 The thesis: Expects volatility to INCREASE from Jan to Apr 2026
What's really happening here:
This trader is making a bet on the shape of volatility across time, not direction. If you're buying April puts and selling January puts at the SAME strike, you're essentially saying:
- 💭 "Volatility is too low in April relative to January"
- 📊 "The market is underpricing Q1 2026 risk"
- ⏰ "January expiration will see volatility crush, but April will stay elevated"
- 🎢 "Big tech earnings in late Jan/Feb will create uncertainty extending into April"
How this makes money:
- ✅ Best scenario: QQQ stays near $625 through Jan 16 (short puts expire worthless), then gets volatile heading into Apr 17 (long puts gain value as IV spikes)
- 📈 Moderate win: QQQ drifts lower to $600-615 by Jan (short puts have some value but long puts worth more due to extra time)
- 💰 Maximum profit: If IV in April rises 20-30% above January levels, spread can double or triple in value
- ⚠️ Loss scenario: QQQ crashes below $600 before January (both puts deep ITM, spread collapses), OR rallies hard above $640 (both puts OTM and worthless)
Unusual Score: 🔥🔥 EXTREMELY UNUSUAL
- Buy leg (April puts): Z-score of 12.84 = 555x larger than average QQQ put trade! This happens maybe a few times per year.
- Sell leg (Jan puts): Z-score of 65.71 = 2,840x larger than average! This is off-the-charts massive.
- Combined volume-to-OI ratios of 1.83x (April) and 7.33x (Jan) signal these are NEW positions opening, not closing.
Translation: This is institutional hedging on STEROIDS. Someone managing a multi-billion dollar portfolio is betting $13M that volatility term structure is mispriced heading into Q1 2026 earnings season.
📈 Technical Setup / Chart Check-Up
YTD Performance Chart
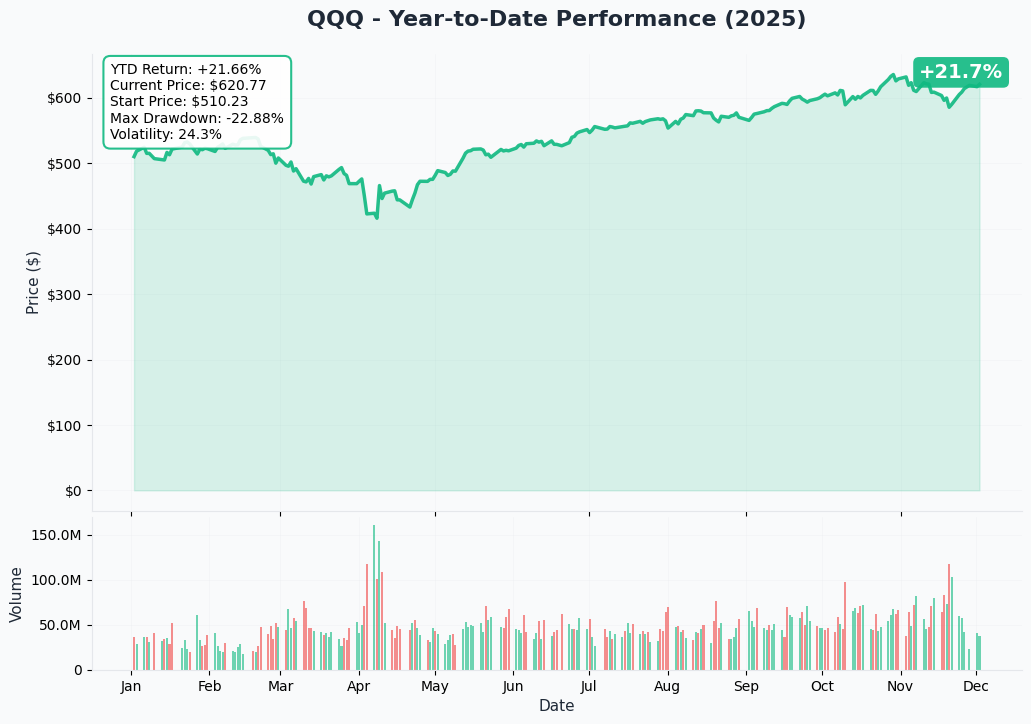
QQQ is riding high - up +20.14% YTD at $620.08, trading just 2.8% below its 52-week peak of $637.01. The chart shows a powerful year-long rally driven by AI optimism and tech sector earnings growth of 26.2% in Q4 2024.
Key observations:
- 🚀 Steady grind higher: Clean uptrend from $402 low to current $620 highs
- 📊 Recent consolidation: Trading in tight $610-637 range for past month after strong November rally
- ⚠️ Near ATH: Only 2.8% from 52-week highs creates limited upside runway without new catalysts
- 💪 Institutional support: $17.37B in 1-year net inflows demonstrates conviction despite short-term outflows of $1.88B over 5 days
- 📉 December opened weak: Tech tumbled with risk-off shift Dec 1, breaking typical year-end seasonal pattern
Gamma-Based Support & Resistance Analysis
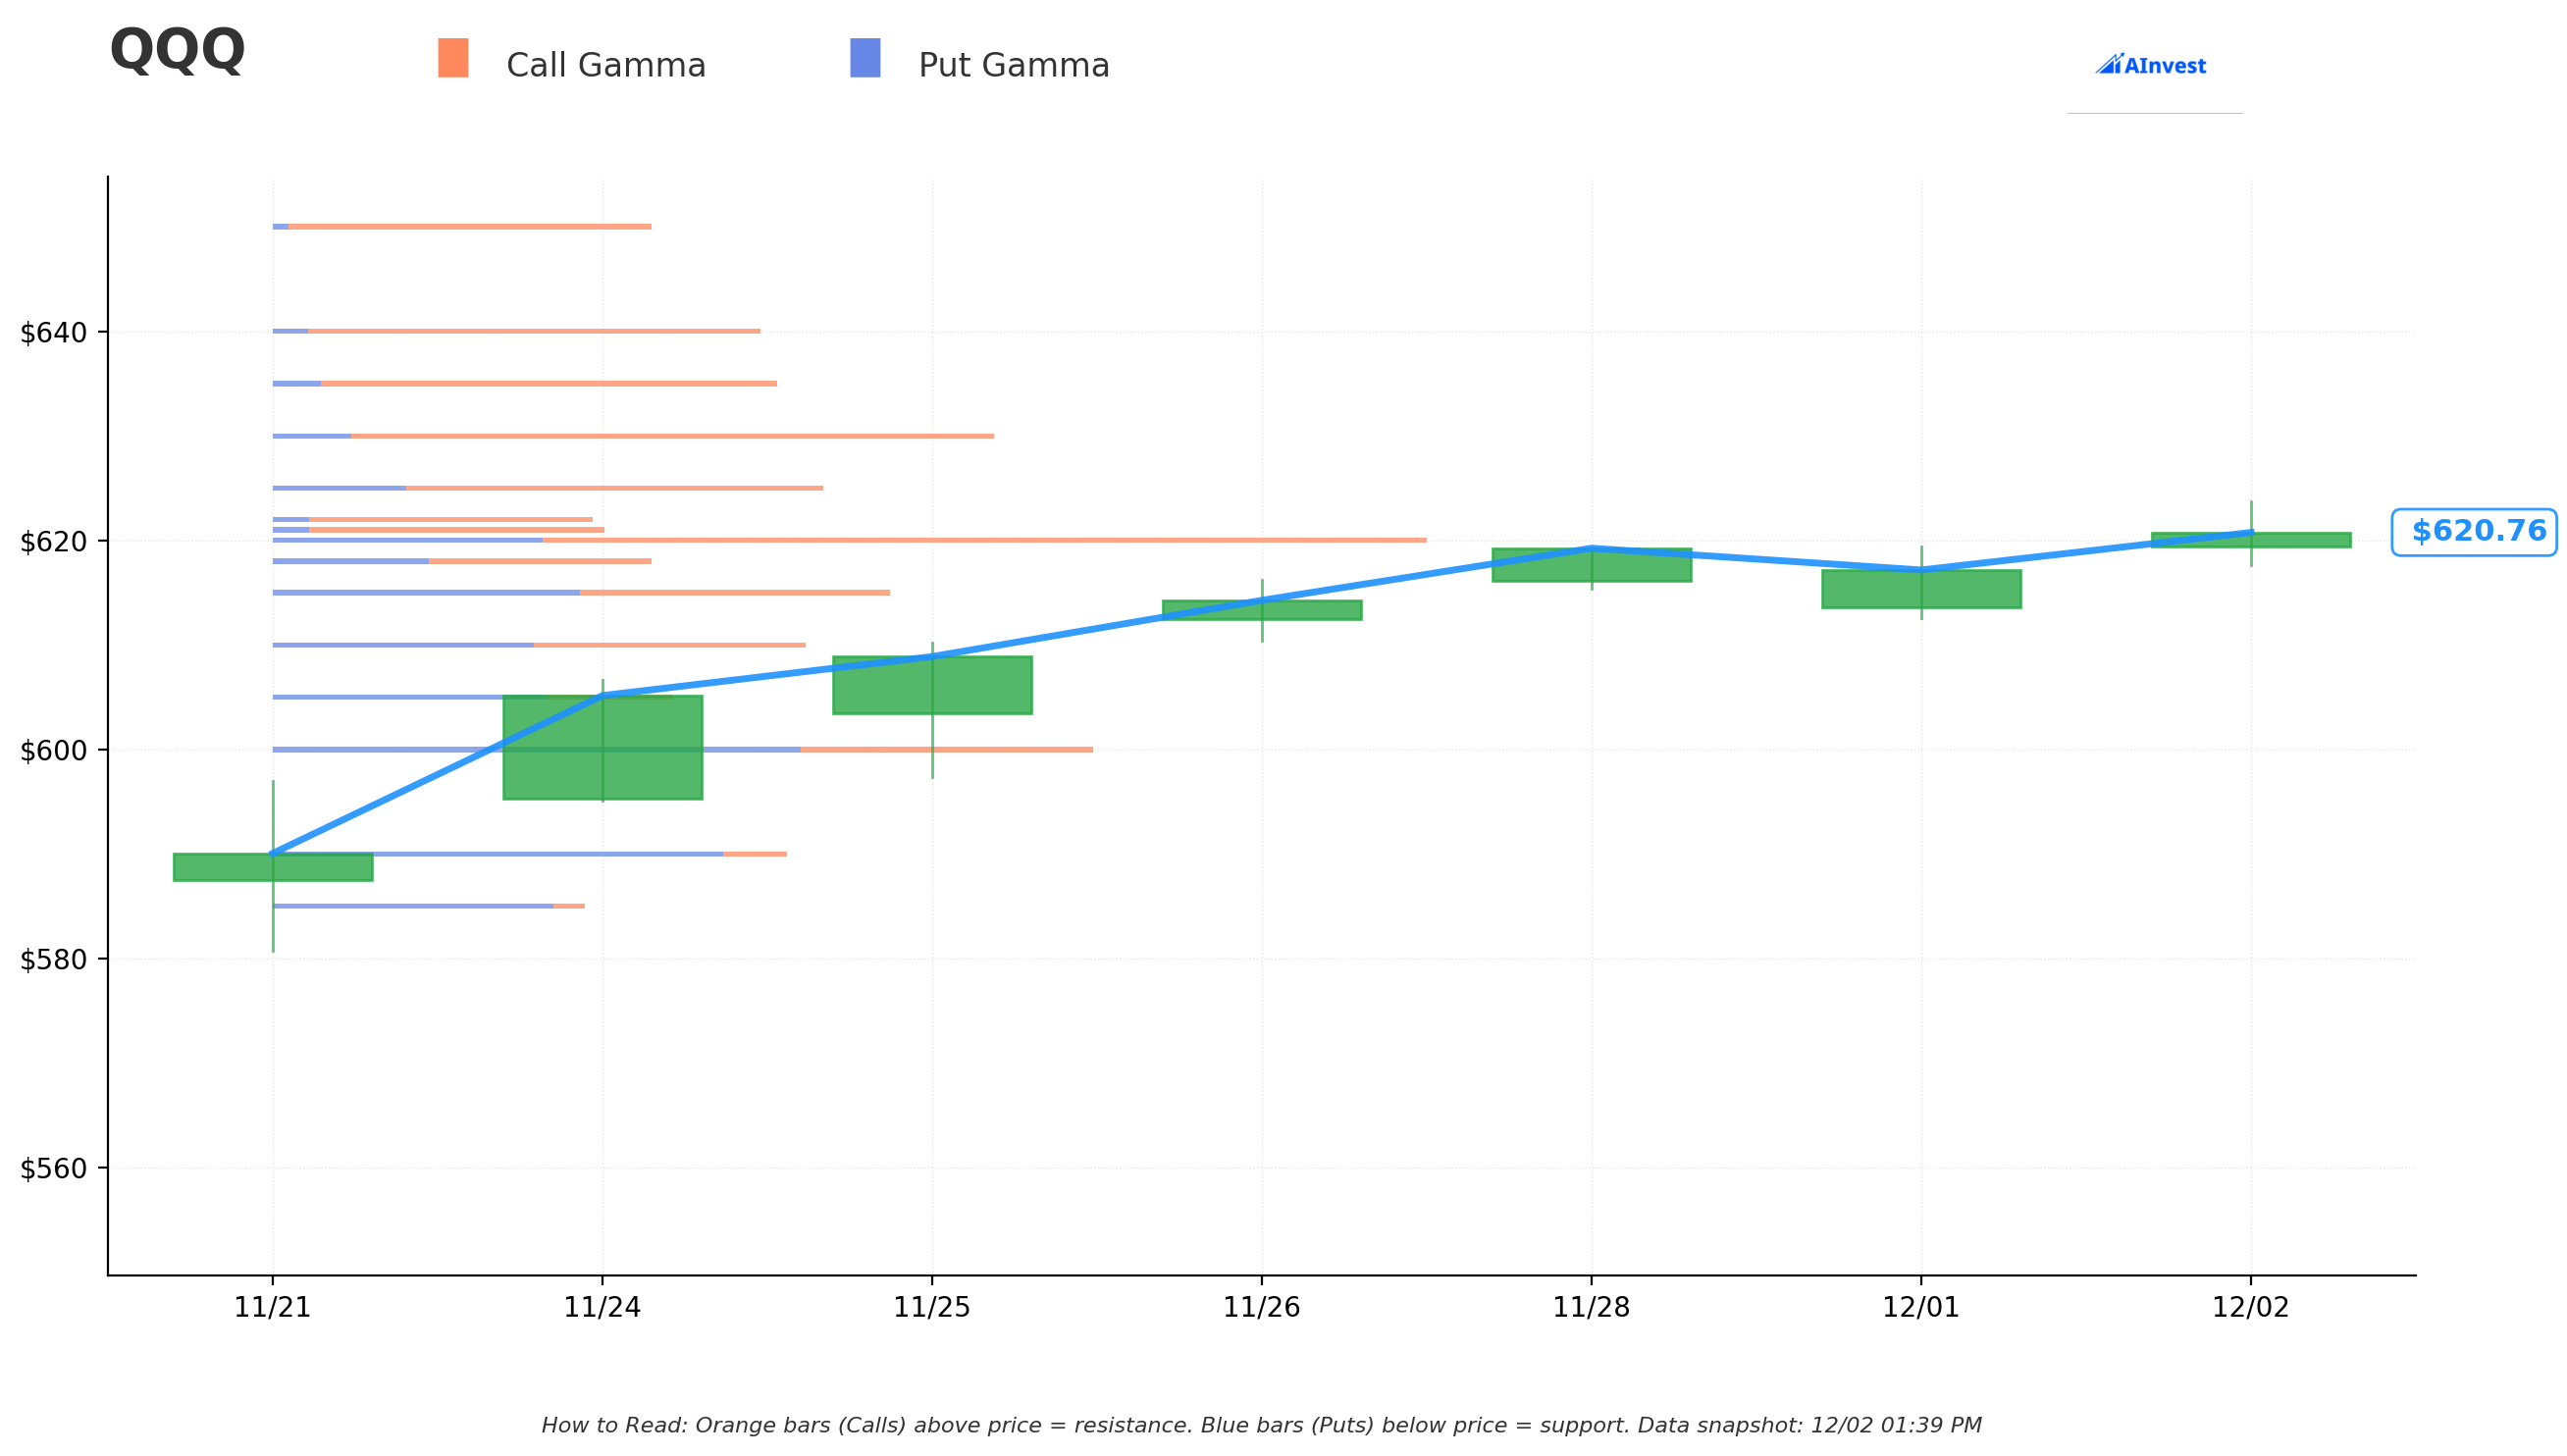
Current Price: $620.78
The gamma exposure map reveals critical dealer positioning that will act as price magnets and barriers:
🔵 Support Levels (Put Gamma Below Price):
- $620 - IMMEDIATE support with 267.6M total gamma (142.5M net call gamma) - THIS IS THE FLOOR
- $615 - Secondary support at 143.1M gamma (essentially neutral 0.6M net)
- $610 - Solid floor at 123.9M gamma (2.8M net call gamma)
- $600 - Major structural support with 190.3M gamma (-55.2M net PUT gamma - dealers will buy aggressively)
- $590 - Deep support zone at 119.7M gamma (-89.9M net put gamma)
🟠 Resistance Levels (Call Gamma Above Price):
- $621 - Immediate ceiling with 274.5M gamma (257.5M NET CALL - STRONGEST RESISTANCE!)
- $625 - Secondary resistance at 129.0M gamma (66.2M net call) - EXACTLY where this trade is struck!
- $630 - Major overhead barrier at 168.1M gamma (131.6M net call)
- $635 - Extended resistance at 117.9M gamma (95.4M net call)
- $640 - Upper ceiling zone at 113.7M gamma (97.2M net call)
What this means for traders:
QQQ is trading in an EXTREMELY tight range between massive $620 support and crushing $621 resistance - literally a $1 wide band! The options market shows market makers are loaded with short call positions at $621 (257.5M net - the LARGEST level on the entire chain). This creates natural selling pressure on any rally attempt.
Notice the $625 strike? That's exactly where this calendar spread is positioned - it sits at meaningful resistance (129M gamma) with decent call/put balance. The trader chose this level because:
- It's 0.8% above current price (slightly OTM for both legs)
- Represents a key technical barrier
- If QQQ consolidates here, time decay favors the spread
Net GEX Bias: Bullish (2.12B call gamma vs 1.29B put gamma) - Overall positioning remains constructive, but immediate action constrained by overhead $621 wall.
Implied Move Analysis
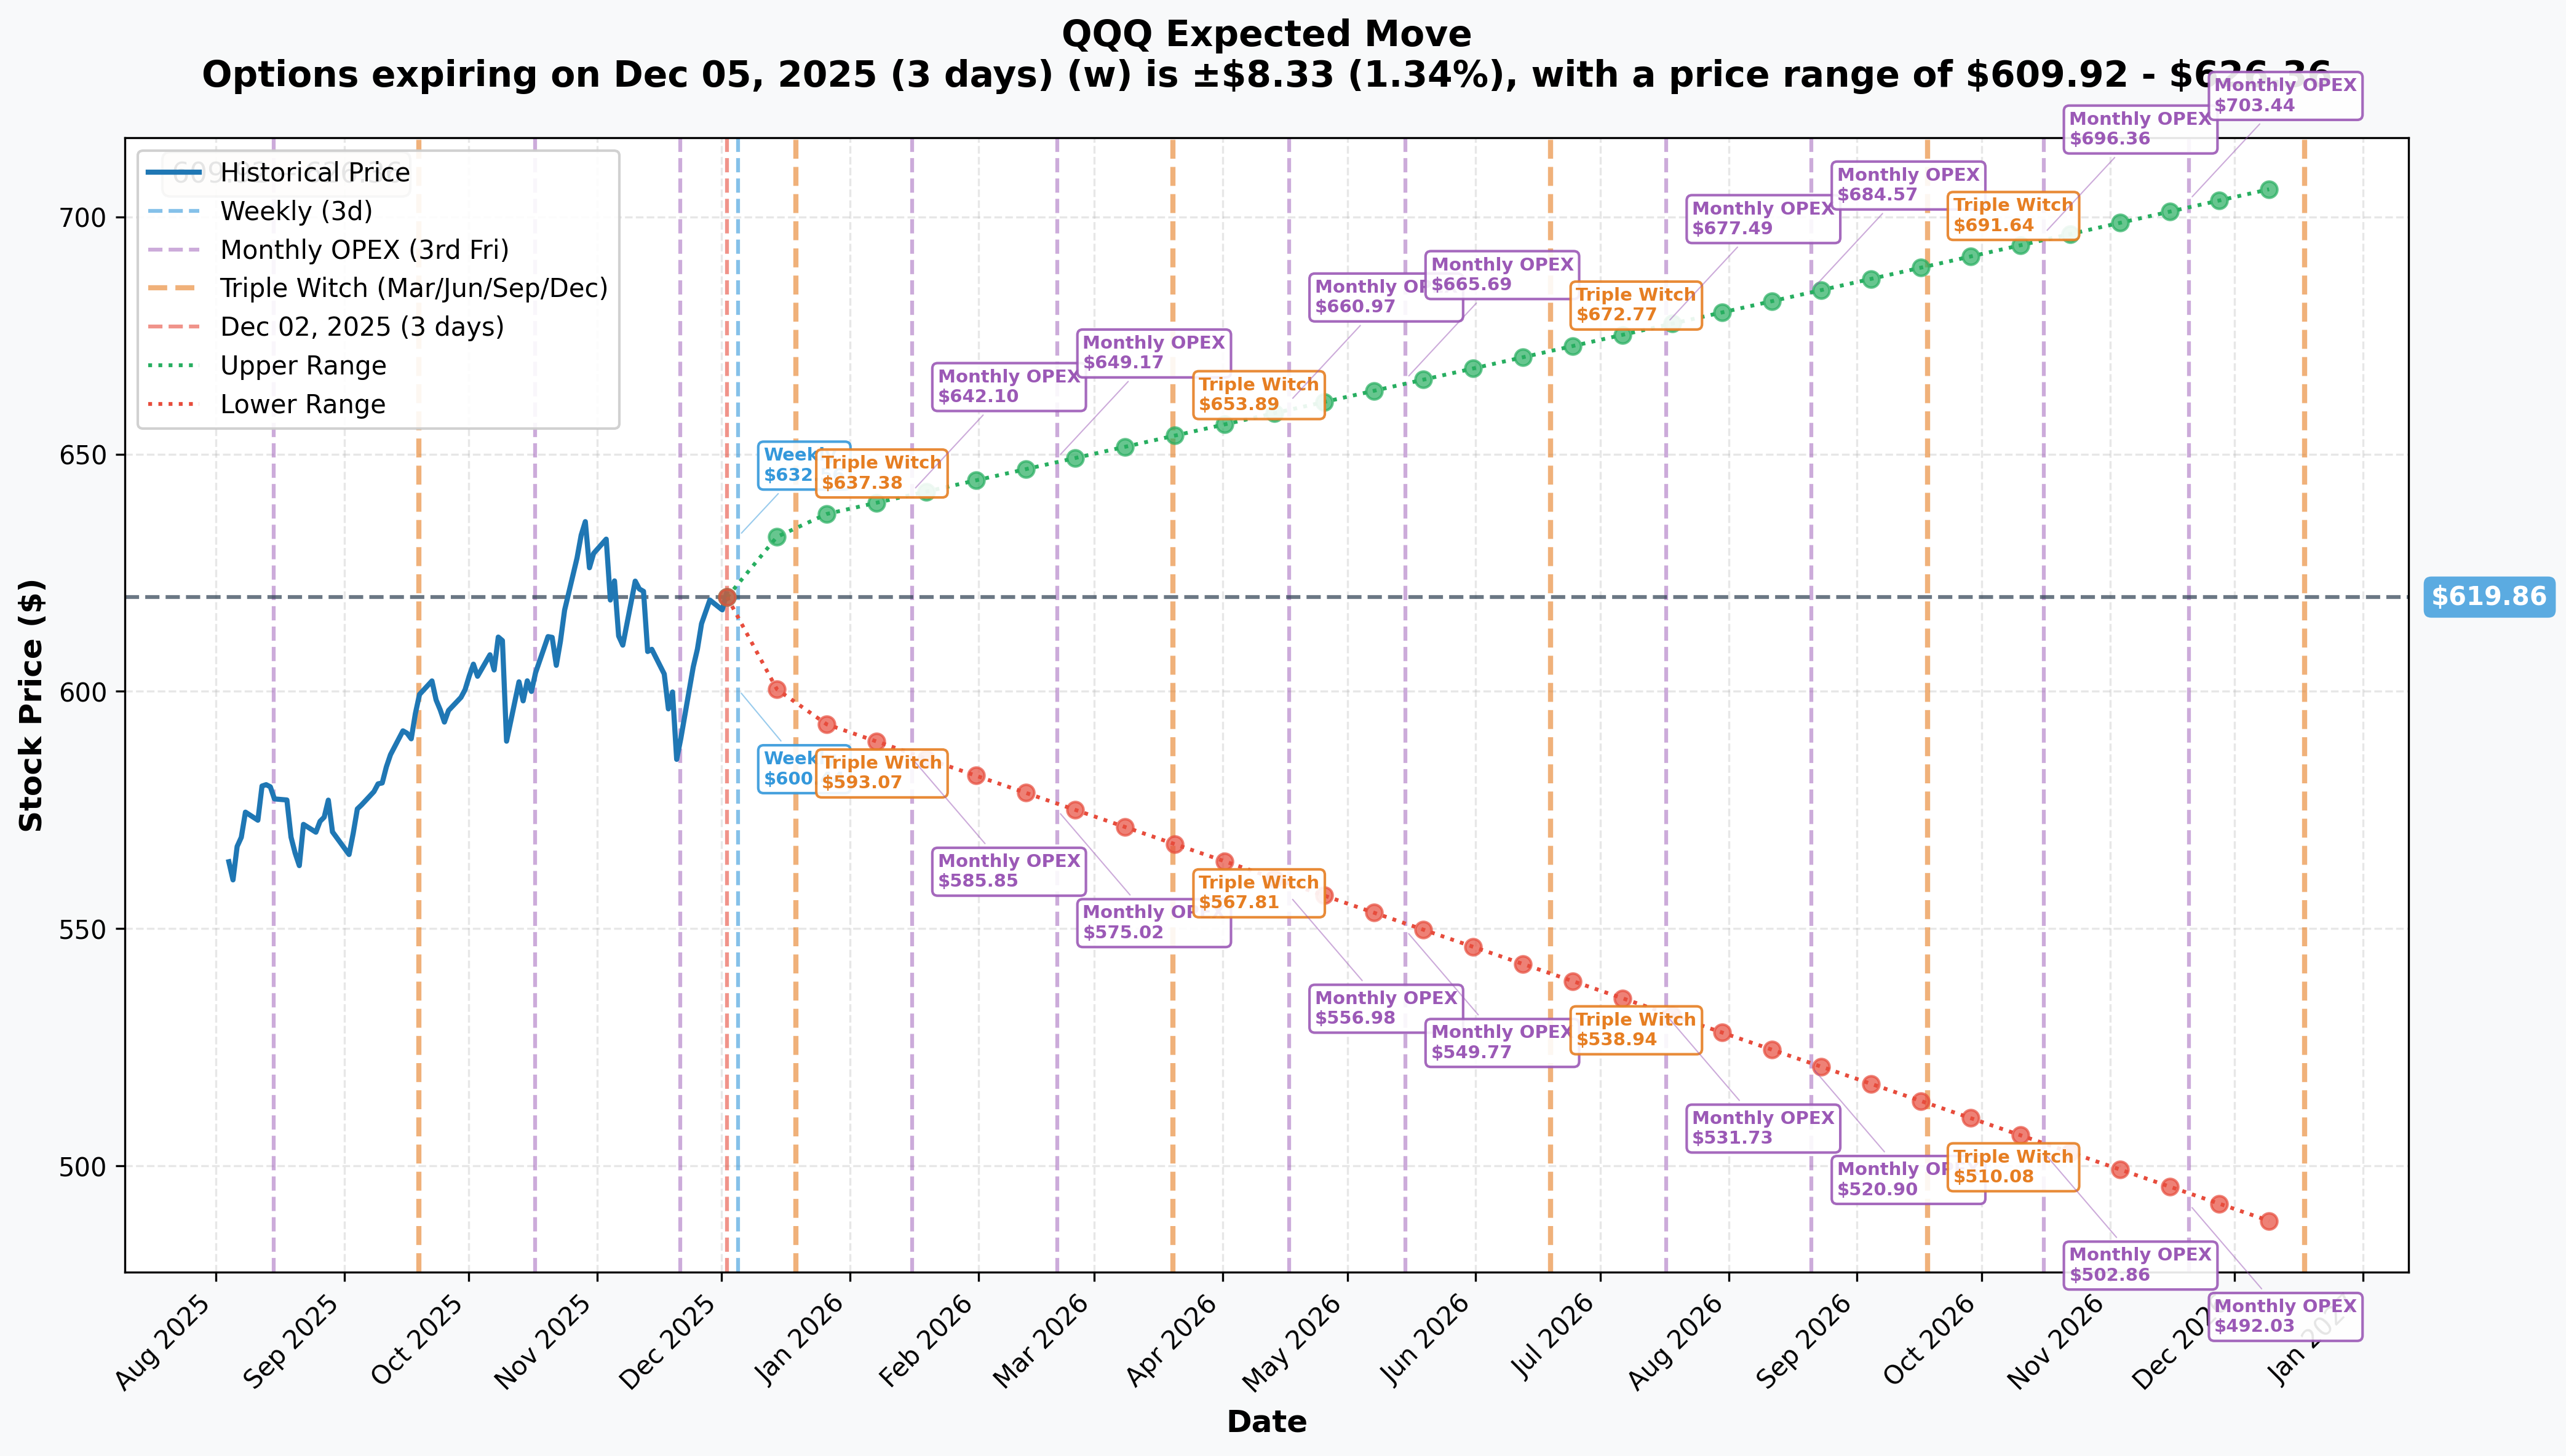
Options market pricing for upcoming expirations:
- 📅 Weekly (Dec 5 - 3 days): ±$8.33 (±1.34%) → Range: $609.92 - $626.36
- 📅 Monthly OPEX (Dec 19 - 17 days): ±$18.99 (±3.06%) → Range: $595.17 - $636.00
- 📅 Quarterly Triple Witch (Dec 19 - 17 days): ±$18.99 (±3.06%) → Range: $595.17 - $636.00
- 📅 January OPEX (Jan 16 - 44 days - SHORT LEG!): ±$28.13 (±4.54%) → Range: $585.85 - $642.10
- 📅 April OPEX (Apr 17 - 136 days - LONG LEG!): ±$52.83 (±8.52%) → Range: $556.98 - $660.97
Translation for regular folks:
The market expects relatively calm waters near-term (±1.3% move by Friday), but increasing uncertainty through December with Fed meeting Dec 9-10 and Nasdaq reconstitution Dec 12 driving a 3% expected swing through monthly OPEX.
The calendar spread setup is PERFECT for this environment:
- 🎯 Jan 16 implied move: ±4.5% ($28) suggests moderate volatility
- 🎯 Apr 17 implied move: ±8.5% ($53) suggests MUCH higher volatility
- 💡 The edge: If this IV term structure holds or steepens, the spread profits even if QQQ doesn't move much
Key insight: The spread is betting that Q4 2024 Magnificent 7 earnings (late Jan) will create uncertainty that PERSISTS into April rather than resolving quickly. This aligns with the catalyst timeline perfectly!
🎪 Catalysts
🔥 Already Happened (Past 90 Days)
Q4 2024 Tech Earnings Season (October-November 2025) 📊
The Nasdaq-100's recent rally was fueled by spectacular earnings:
- 💪 Tech sector achieved +26.2% earnings growth on +11.3% higher revenues in Q4 2024
- 🚀 Nasdaq-100 posted blended earnings growth rate of 13.2%, highest since Q4 2021
- 🎯 Magnificent 7 Q4 2024 earnings up 20.9% YoY on 12.2% higher revenues
- 📈 All major reports (MSFT, GOOGL, META, AAPL, AMZN, TSLA, NVDA) beat expectations through late November
This strong fundamental backdrop supports QQQ's 20% YTD gain, but the question is: Can they repeat this performance in Q1 2025 earnings?
AI Infrastructure Investment Wave 🤖
The mega-caps delivered on their massive capex commitments:
- 💰 Microsoft, Amazon, Alphabet collectively budgeting $250B+ in 2025 capex, primarily for AI
- 🏭 Meta raised capex outlook to as much as $72B for 2025
- ✅ Concerns about ROI were alleviated - tech giants demonstrating sustained commitment
Fund Flow Divergence 📉📈
Recent activity shows conflicting signals:
- ⚠️ Short-term weakness: $1.88B outflows over 5 days, $1.08B out in 1 month
- ✅ Long-term strength: $7.47B inflows over 3 months, $17.37B over 1 year
- 🏦 Institutional giants like JPMorgan (+42.4% position), Citadel, and Point72 increased stakes in Q2 2025
DeepSeek Disruption (Early 2025) 🇨🇳
A wild card that temporarily shook AI thesis:
- ⚡ Chinese startup DeepSeek claimed AI model parity with ChatGPT at fraction of cost
- 📉 Initially dampened enthusiasm around $300B+ U.S. capex spending narrative
- ✅ Market ultimately dismissed concerns, but shows vulnerability to AI competition narratives
🚀 Upcoming Catalysts (Next 6 Months)
Federal Reserve FOMC Meeting - December 9-10, 2025 (7 DAYS!) 💸
The most immediate catalyst that could rock QQQ:
- 🎯 72% probability of 25 basis point cut to 3.5% per market pricing
- 📊 CME FedWatch shows 85% probability per futures
- 🏦 Current Fed Funds Rate: 3.75% - 4.00%
- ⚠️ But it's NOT guaranteed: Fed Chair Powell stated December cut is "not a foregone conclusion"
Why this matters for QQQ:
- ✅ Bullish scenario: Rate cut confirmed → Growth stocks benefit from lower discount rates → QQQ rallies 2-3%
- ⚠️ Bearish scenario: No cut or hawkish guidance → Tech multiples compress → QQQ drops 3-5%
- 🎢 Volatility either way: This binary event perfectly sets up the calendar spread's January expiration
Nasdaq-100 Annual Reconstitution - December 12, 2025 (10 DAYS!) 📋
Major index rebalancing creates forced flows:
- 📅 Announcement December 12, effective week following (coinciding with quarterly OPEX)
- 🎯 Annual re-ranking ensures largest non-financial Nasdaq companies properly represented
- 💰 Affects $300B+ in assets that passively track the Nasdaq-100
Companies at risk of deletion:
- 📉 Lululemon (LULU): Down 50% YTD
- 📉 The Trade Desk (TTD): Down 66% YTD
- 📉 DexCom (DXCM), On Semiconductor (ON): Down 15%+ YTD
Impact on spread: Reconstitution creates short-term volatility (good for January leg IV) but typically resolves quickly (bad for April leg if uncertainty doesn't persist).
Q1 2025 Earnings Season - Late January/February 2026 📊
This is THE catalyst the calendar spread is positioned for!
Magnificent 7 Expected Timeline:
- 📅 Late January 2026: Tesla, Microsoft, Meta, Apple (typically last week of month)
- 📅 Early February 2026: Alphabet, Amazon
- 📅 Late February 2026: Nvidia
Consensus Expectations:
- 📊 Mag 7 earnings expected +17.1% growth in 2025 vs +36.8% in 2024 - DECELERATION
- 📈 Revenue growth expected +12.6% on +9.5% higher revenues
- ⚠️ Q4 2025 forecast shows 18% growth for Mag 7 vs 9% for other 493 S&P companies - gap narrowing
Why the calendar spread makes sense:
The January 16 expiration is PERFECT timing - it expires BEFORE the major earnings hits (Jan 20-30). The April 17 expiration captures ALL the post-earnings uncertainty, guidance debates, and Q2 outlook questions. If earnings create controversy or guidance disappoints, April IV spikes while January IV has already crushed. That's exactly what this spread wants!
AI Theme Evolution 🤖
Multiple developments will influence sentiment through Q1:
- 📈 Global IT spending projected +9.7% growth in 2025
- 🏭 Data center and software segments expected double-digit growth rates
- 🌐 Sovereign AI and AI agents to dominate 2025 attention
- 🔬 AI influence extending beyond Mag 7 to cybersecurity, healthcare, mobile advertising
Risk: Any signs that the $300B+ capex spending isn't generating ROI could crater sentiment. DeepSeek's low-cost model proved disruption is possible.
Year-End Seasonality vs Reality 🎄
- ✅ Historical pattern: Final months favor equities, especially large-cap growth
- ⚠️ Current reality: December opened with risk-off shift Dec 1 - all major tech names traded lower
- 📊 VIX at key support with high probability of bounce = volatility spike coming
- 🎯 QQQ at major resistance after 5-day rally into late November - reversal risk elevated
🎲 Price Targets & Probabilities
Using gamma levels, implied moves, and catalyst timing, here are the scenarios through April 17 expiration:
📈 Bull Case (30% probability)
Target: $650-$680 by April 2026
How we get there:
- ✅ Fed cuts 25bp in December, signals 2-3 more cuts in 2026 → growth stocks rally
- 🚀 Q1 2025 earnings BEAT with Mag 7 delivering 20%+ growth (exceeding lowered expectations)
- 🤖 AI capex spending shows tangible ROI - revenue acceleration in cloud/AI segments
- 📊 Nasdaq reconstitution brings in high-growth additions, removes deadweight
- 💪 Broader tech sector (beyond Mag 7) starts participating - validates AI theme expansion
- 🇨🇳 China trade tensions ease, removing macro overhang
- 📈 Technical breakout above $637 ATH triggers momentum chase to $650-680
Key metrics needed:
- Nasdaq-100 earnings growth sustains >15% in Q1 2025
- QQQ breaks above $640 resistance (highest gamma level) with conviction
- VIX drops back below 12 (risk-on mode)
- Tech sector revenue growth accelerates to 12-15% range
Calendar spread P&L: LOSS or small gain. In strong bull scenario, both puts expire worthless (lose full $13M premium) or April puts hold minimal value while January puts already expired worthless. This trade is NOT betting on upside - it loses in this scenario.
Probability: Only 30% because it requires Fed accommodation, earnings beats, AND no macro/geopolitical shocks. Earnings growth decelerating from 36.8% to 17.1% makes beats harder. Current 20% YTD gain already prices in decent optimism.
🎯 Base Case (45% probability)
Target: $595-$630 choppy range (VOLATILITY HARVESTING)
Most likely scenario:
- 📊 Fed cuts in December but takes hawkish tone on future cuts (data-dependent)
- ✅ Q1 earnings meet expectations (~17% growth) but don't excite - in-line results
- ⚖️ QQQ consolidates in $600-630 range through Q1 as market digests 20% YTD gains
- 🎢 Elevated volatility around each catalyst (Fed, reconstitution, earnings) but no sustained trend
- 💤 January puts expire near-the-money or slightly OTM, theta decay chips away value
- 🔥 April puts GAIN value as Q2 uncertainty builds (Fed policy unclear, Q2 earnings outlook murky)
- 📉 Short-term outflows continue (-$1.88B/5 days trend) but institutional support holds
- 🤝 Market waiting for proof points: Does AI spending pay off? Can growth sustain?
This is EXACTLY what the calendar spread wants:
- QQQ stays near $625 through Jan 16 → short puts expire with minimal value (maybe $5-8)
- IV in April rises from current levels as Q1 earnings create MORE questions than answers
- Time decay works in spread's favor as January theta burns faster than April
- April puts worth $25-35 by mid-March when spread can be closed
Estimated spread P&L:
- 💰 Entry: $13M net debit (actual trade)
- 📈 Jan 16: Short puts expire $5 ITM, collect $5.25M (offset by slight loss from short position)
- 🎯 Apr 17: Long puts worth $28-32 (IV expansion + time), value = $29.4M-33.6M
- 💚 Total profit: $10-15M gain (77%-115% ROI!)
Why 45% probability: This aligns with analyst expectations of consolidation, historical pattern of post-rally digestion, and setup for Q1 earnings uncertainty. The $1.88B recent outflows suggest profit-taking mode, not panic or euphoria. Perfect for volatility arbitrage.
📉 Bear Case (25% probability)
Target: $560-$590 (TEST THE SPREAD STRIKE!)
What could go wrong:
- 😰 Fed SKIPS December cut citing sticky inflation → rate cut expectations pushed to Q2 2026
- 📉 Q1 earnings disappoint with growth decelerating below 15% → "AI not paying off" narrative
- 💸 Major tech company (NVDA, MSFT, AAPL) misses or guides down → contagion across Mag 7
- 🇨🇳 China/Taiwan tensions escalate → supply chain fears for semis
- 💰 Valuation concerns resurface: QQQ at 34.81 P/E with earnings growth slowing = multiple compression
- 📊 Break below $600 gamma support triggers cascade to $590, then $560
- 🏦 Institutional outflows accelerate beyond current -$1.88B/5 days pace
- ⚠️ Concentration risk (44.9% in Mag 7) becomes liability if rotation OUT of tech
Calendar spread P&L in Bear Case:
This gets COMPLEX because both puts go in-the-money:
-
📉 Scenario A: QQQ drops to $590 by Jan 16, stays there through April
- Jan 16: Short $625 puts worth $35 (lose $16.86 per contract = -$17.7M)
- Apr 17: Long $625 puts worth $35-38 (minimal time value left)
- Net result: Small loss to breakeven (intrinsic offsets but time decay hurts)
-
📉 Scenario B: QQQ drops to $590 by Jan 16, then RALLIES to $610-620 by April
- Jan 16: Take loss on short puts ($17.7M)
- Apr 17: Long puts worth $5-15 (OTM or slightly ITM)
- Net result: Large loss (-$8-12M on the trade)
-
📉 Scenario C: QQQ stable through Jan, THEN crashes to $570 in March
- Jan 16: Short puts expire worthless or small ITM (collect most premium)
- Apr 17: Long puts worth $50-55 (deep ITM)
- Net result: MASSIVE WIN (+$25-35M gain!)
Key insight: The calendar spread LOSES if crash happens before January. It WINS BIG if crash happens AFTER January. The trader is betting on a delayed selloff scenario, not immediate collapse.
Probability: 25% because fundamentals remain solid (tech earnings +26.2% in Q4, $17.37B institutional inflows), Fed likely to cut, and year-end seasonality supports. Would require multiple negative catalysts.
💡 Trading Ideas
🛡️ Conservative: Ride the Range (Sell Premium)
Play: Sell $615/$610 put spread (Jan 16 expiration) after Fed decision
Why this works:
- 📊 Gamma support at $620 and $615 creates natural floor
- 💰 Collect premium from elevated IV around Dec 9-10 Fed meeting
- 🎯 $615-610 zone is 1-2% below current - gives cushion
- ⏰ 44 days to expiration allows time decay to work in your favor
- 🛡️ Defined risk: Max loss is spread width minus credit received
Structure:
- 💸 Sell $615 puts, Buy $610 puts (Jan 16)
- 💰 Collect ~$1.50-2.00 credit per spread (estimate based on current IV)
- 📉 Max profit: $150-200 if QQQ above $615 at expiration
- 📈 Max loss: $350-400 if QQQ below $610 at expiration
- 🎯 Breakeven: ~$613.00-613.50
Entry timing:
- ⏰ Enter AFTER Fed decision Dec 10 (capture IV spike, sell into it)
- ❌ Skip if QQQ already below $615 (too close to danger zone)
- ✅ Best if QQQ $620-630 when entering
Position sizing: Risk 1-3% of portfolio max
Exit plan:
- 💚 Take profit at 50-60% of max gain (don't be greedy)
- ⚠️ Exit immediately if QQQ breaks $615 support with conviction
- ⏰ Close by Jan 10 if near max profit to avoid weekly gamma risk
Risk level: Low-Moderate (defined risk, high probability) | Skill level: Intermediate
Expected outcome: 65-70% probability of profit. Captures theta decay while QQQ consolidates in expected range.
⚖️ Balanced: Mini Calendar Spread (Copy the Pros)
Play: Mini version of the institutional trade - Buy April puts, Sell January puts
Structure: Buy 5x Apr 17 $620 puts, Sell 5x Jan 16 $620 puts
Why this works:
- 🤝 Following smart money's thesis: IV will rise from Jan to Apr
- 📊 Same volatility arbitrage concept but retail-sized
- 🎯 $620 strike is near current price (similar to $625 in institutional trade)
- ⏰ Captures Q1 earnings season uncertainty in April leg
- 💡 Benefits from time decay differential (theta burns faster on short leg)
Estimated P&L (adjust for actual market prices):
- 💸 Buy Apr $620 puts: ~$28-30 each = $14,000-15,000
- 💰 Sell Jan $620 puts: ~$16-17 each = $8,000-8,500
- 📉 Net debit: $6,000-6,500 for 5-contract spread
Best case scenario:
- QQQ consolidates $615-625 through Jan 16
- Short puts expire worthless or minimal value ($500-1,000 loss max)
- IV expands in April as earnings create uncertainty
- April puts appreciate to $32-38 ($16,000-19,000 value)
- 💚 Profit: $8,000-12,000 (120-185% ROI)
Worst case scenario:
- QQQ crashes to $580 by January (both legs deep ITM, spread collapses)
- OR QQQ rallies to $650 (both legs expire worthless)
- 💔 Loss: Full $6,000-6,500 debit (100% loss)
Management rules:
- 🎯 Close if profit hits 100% before April (don't get greedy)
- ⚠️ Exit if QQQ moves >5% in either direction rapidly
- 🔄 Consider rolling short leg if Jan puts go deep ITM (defensive adjustment)
- 📊 Monitor IV differential - if April IV drops relative to Jan, exit
Risk level: Moderate (can lose full debit) | Skill level: Advanced
Probability of profit: 40-50% (requires specific market conditions to align)
🚀 Aggressive: Earnings Straddle on NVDA/AAPL (YOLO Adjacent)
Play: Instead of QQQ, target individual earnings with straddles
Why focus on components, not QQQ:
- 💥 Single-stock earnings create MUCH bigger moves than ETF
- 🎯 NVDA historically moves 8-12% post-earnings, AAPL 4-6%
- 📊 Better bang for buck vs QQQ's dampened index-level volatility
- ⚡ Mag 7 individual stocks DRIVE QQQ - if they move big, QQQ follows
Structure (using NVDA late Feb earnings as example):
- Buy ATM calls + Buy ATM puts on day before earnings
- 💸 Cost: $12-18 per straddle (assume NVDA ~$135)
- 📈 Need stock to move >9-13% to profit after IV crush
- ⏰ Close position within 24 hours post-earnings (don't hold!)
Why this could work:
- 🚀 Nvidia reports late February - make-or-break for AI thesis
- 📊 14.10% QQQ weighting means NVDA earnings are CRITICAL
- 💥 Recent history shows outsized post-earnings moves in AI stocks
- 🎰 One BIG beat/miss can deliver 200-400% returns overnight
Why this could blow up:
- 💸 IV crush can destroy BOTH legs even if you're right on direction
- ⏰ Need 12%+ move to overcome premium decay
- 📉 Earnings could be "fine but not exciting" - stock moves 5%, you lose 60%
- ⚠️ This is pure gambling on binary event - not investing
CRITICAL WARNING:
- ✅ ONLY attempt if you can afford 100% loss
- ✅ Never risk more than 1-2% of portfolio on single straddle
- ✅ Have plan to close IMMEDIATELY post-earnings (set alerts)
- ✅ Understand you're betting AGAINST options market pricing
- ❌ Do NOT buy straddles on multiple stocks (blow up risk multiplies)
Risk level: EXTREME | Skill level: Advanced only
Expected outcome: 35-40% probability of profit, but wins can be 3-5x losers
⚠️ Risk Factors
Don't get blindsided by these landmines:
-
🏦 Fed policy uncertainty (Dec 9-10): Despite 72% market odds, Powell said December cut is "not a foregone conclusion". If Fed pauses citing inflation concerns or delivers hawkish cut (suggesting fewer 2026 cuts), tech multiples compress immediately. Growth stocks HATE rising real yields. A "no cut" scenario could gap QQQ down 3-5% overnight.
-
📉 Earnings deceleration reality: Magnificent 7 growth slowing from 36.8% (2024) to 17.1% (2025) is MASSIVE deceleration. At current valuations (34.81 P/E), QQQ is priced for perfection. If Q1 2025 earnings come in below 15% growth or guidance disappoints, multiple compression could be swift. Historically, high-flyers sell off even on beats if growth trajectory weakens.
-
💰 Valuation at nosebleed levels: QQQ up 20% YTD at 34.81 P/E (vs historical 20-25x average) with stock-level concentration insane: Nvidia alone is 14.10% of index. One NVDA stumble drops QQQ 1-2% instantly. Concentration at record highs with Mag 7 comprising 44.9% creates fragility - if rotation OUT of tech begins, there's no cushion.
-
🎢 VIX at key support = volatility spike imminent: Technical analysts flagging that VIX sitting at major support level with high probability of bounce. Translation: Expect turbulence in next 2-4 weeks. Combined with QQQ at major resistance after 5-day November rally, setup screams "reversal risk."
-
🇨🇳 China/geopolitical wildcard: Trade tensions and tariff concerns hanging over tech sector. Taiwan/China tensions create supply chain risk for TSMC-dependent semis (NVDA, AMD). Any escalation sends tech into risk-off spiral. Plus DeepSeek disruption showed U.S. AI dominance isn't guaranteed.
-
📊 $621 gamma wall is MASSIVE: The 274.5M gamma at $621 with 257.5M NET call exposure is the largest single level on the chain. Market makers are massively short calls here, meaning they'll mechanically SELL into any rally to hedge. This creates natural ceiling that's hard to break without sustained buying pressure. Every approach to $621 gets sold - we've seen this play out repeatedly.
-
💸 AI capex ROI questions: Microsoft, Amazon, Alphabet spending $250B+ on AI infrastructure. Eventually investors will demand evidence this is generating incremental revenue, not just maintaining competitive positioning. If Q1 guidance suggests AI revenue growth isn't accelerating proportionally to capex spend, "overinvestment" narrative could crater sentiment.
-
🏦 Short-term outflow trend: -$1.88B in 5 days, -$1.08B in 1 month shows momentum shifting. While 1-year inflows remain strong (+$17.37B), recent divergence suggests institutional profit-taking. If this accelerates, liquidity drain creates downside pressure even without fundamental catalyst.
-
📋 Reconstitution uncertainty: December 12 announcement could surprise markets if high-profile deletions (LULU, TTD) are replaced by lower-growth names. Quality of additions matters - if incoming companies lack AI/growth credentials, could shift index character and dampen enthusiasm.
-
🎄 Seasonality failure: December historically positive for tech, but 2025 opened with risk-off shift Dec 1 breaking the pattern. If typical year-end Santa rally doesn't materialize, creates negative surprise that could extend into Q1. Previous week's gains may have pulled forward December performance.
🎯 The Bottom Line
Real talk: A sophisticated institution just committed $13 MILLION (net) betting that volatility will be HIGHER in April than January, despite both puts being at the same $625 strike. This isn't a directional bet on QQQ crashing - it's a bet on the SHAPE of uncertainty over time.
What this calendar spread is screaming:
- 🎯 "Near-term volatility (Fed, reconstitution) resolves quickly, but Q1 2026 creates SUSTAINED uncertainty"
- 📊 "January options are OVERPRICED relative to April given the earnings catalyst timing"
- ⏰ "The real fireworks start AFTER January expiration when Mag 7 reports and Q2 outlook comes into focus"
- 🤔 "We're willing to lose $13M if wrong, because the edge on volatility term structure is that compelling"
This is NOT panic hedging - it's volatility arbitrage by pros who see market mispricing
The Z-scores (12.84 on buy leg, 65.71 on sell leg) confirm this is EXTREMELY unusual positioning - institutions typically don't throw $51M gross ($13M net) at calendar spreads unless they have HIGH conviction about volatility dynamics.
If you own QQQ:
- ✅ Consider this a yellow flag (not red): Smart money preparing for chop, not crash
- 📊 Holding long-term positions (401k, IRA) is fine - don't panic sell on 20% YTD gains
- 🛡️ If sitting on big profits, consider trimming 10-20% to lock in gains ahead of Fed/earnings
- ⏰ Set mental stop at $600 (major gamma support) to protect against bigger breakdown
- 💡 Calendar spread concept teaches valuable lesson: Volatility has term structure, just like interest rates
If you're watching from sidelines:
- ⏰ Key dates to watch: Dec 9-10 (Fed), Dec 12 (reconstitution), Jan 20-Feb 20 (earnings)
- 🎯 Best entry likely comes AFTER one of these catalysts creates pullback to $600-610
- 📈 Long-term thesis intact: AI capex $300B+, tech earnings growing 15-20%, institutional support solid
- ⚠️ Current setup (at resistance, after 20% gain, pre-multiple catalysts) argues for patience
- 💰 If you MUST play: Sell premium (puts below $610) rather than buy - theta is your friend
If you're bearish:
- 🚫 Fighting 20% YTD momentum and $17.37B institutional inflows is dangerous
- 🎯 First support: $620 (gamma floor), major support: $600 (190M gamma)
- 📊 Calendar put spread is BETTER than outright puts if you're bearish (lower cost, benefits from IV expansion)
- ⏰ Timing is everything: Pre-Fed short positioning is suicide; post-earnings offers better risk/reward
- 💡 Watch for break below $615 on volume - that's the trigger for acceleration to $600, then $590
For options traders specifically:
This institutional trade is a MASTERCLASS in volatility positioning:
- They're NOT betting on direction (same strike, both puts)
- They're betting on WHEN volatility arrives (delayed, not immediate)
- They've sized it to capture meaningful edge without excessive risk
- Entry timing (pre-Fed but post-strong rally) suggests they see near-term range-bound action
Mark your calendar - Critical dates:
- 📅 December 9-10 (Mon/Tue) - FOMC meeting, 72% odds of 25bp cut
- 📅 December 12 (Thu) - Nasdaq-100 reconstitution announcement
- 📅 December 19 (Thu) - Quarterly triple witch, monthly OPEX (±3.06% implied move window)
- 📅 January 16, 2026 (Fri) - Monthly OPEX, SHORT PUT LEG EXPIRATION
- 📅 Late January 2026 - Mag 7 earnings begin (TSLA, MSFT, META, AAPL)
- 📅 Early February 2026 - GOOGL, AMZN earnings
- 📅 Late February 2026 - NVDA earnings (the BIG one)
- 📅 April 17, 2026 (Fri) - Monthly OPEX, LONG PUT LEG EXPIRATION
Final verdict: QQQ's fundamental support remains rock-solid (tech earnings +26.2%, AI capex $300B+, institutional conviction strong), but near-term path is UNCERTAIN with three major catalysts in December and Q1 earnings season approaching. The $51M calendar spread signals smart money is preparing for CHOP in December followed by REAL volatility in Q1 2026.
The trade's message is clear: The easy money has been made. Now comes the hard part - proving the AI thesis generates sustainable earnings growth, not just hype.
Be selective. Manage risk. Don't chase. The opportunities will come - especially if you're patient enough to let this calendar spread thesis play out. 💪
Disclaimer: Options trading involves substantial risk of loss and is not suitable for all investors. This analysis is for educational purposes only and not financial advice. Calendar spreads are complex strategies requiring understanding of volatility dynamics, time decay, and risk management. The unusual activity described reflects institutional positioning which may involve portfolio hedging, tax strategies, or other considerations not applicable to retail traders. Past performance doesn't guarantee future results. QQQ can experience rapid 3-5% moves on Fed decisions or earnings surprises. Always conduct your own research and consider consulting a licensed financial advisor before trading options. The Z-scores referenced indicate trade size relative to recent history, not probability of profitability.
About Invesco QQQ Trust: The Invesco QQQ Trust tracks the Nasdaq-100 Index, providing exposure to 100 of the largest non-financial companies listed on the Nasdaq stock exchange, with heavy concentration in technology and growth stocks including the Magnificent 7 (NVDA, MSFT, AAPL, GOOGL, META, AMZN, TSLA).