QQQ Massive $4.3M Put Bet Signals Institutional Hedging Ahead of Earnings Season
January 8, 2026 | Unusual Activity Detected
ETF Overview
Invesco QQQ Trust, Series 1 (QQQ) is the premier ETF tracking the Nasdaq-100 Index, providing exposure to the 100 largest non-financial companies listed on the Nasdaq. With approximately $408 billion in AUM, QQQ is the second-largest ETF in the United States and the most actively traded options product in the market.
| Metric | Value |
|---|---|
| AUM | $407.69B |
| Holdings | 102 companies |
| Top 10 Concentration | 49.21% |
| Expense Ratio | 0.20% |
| Primary Exchange | NASDAQ |
Top Holdings: NVIDIA (9.09%), Apple (8.75%), Microsoft (7.73%), Broadcom (6.63%), Amazon (5.26%), with the "Magnificent 7" comprising approximately 42% of the portfolio.
The Quick Take
Someone just dropped $4.3 MILLION on deep out-of-the-money QQQ puts expiring in September - and this isn't your neighbor's Robinhood portfolio. With a Z-Score of 18.76 (classified as EXTREMELY UNUSUAL), this trade represents activity we might see only a handful of times per year. The timing is notable: right before mega-cap tech earnings season kicks off January 28-29 and amid growing chatter about the "Great Rotation" out of tech into value stocks.
The Trade Details
| Field | Value |
|---|---|
| Time | 10:23:15 ET |
| Option Symbol | QQQ20260918P500 |
| Direction | BUY |
| Type | PUT |
| Expiration | 2026-09-18 (Triple Witch) |
| Strike Price | $500 |
| Premium | $10.75 per contract |
| Total Premium | $4,300,000 |
| Volume | 4,000 contracts |
| Open Interest | 1,247 |
| Size | Block (4,000 contracts) |
| Order Type | BTO (Buy to Open) |
| Z-Score | 18.76 |
| Classification | EXTREMELY UNUSUAL |
| Strategy Type | Long Put |
What This Actually Means
This is a protective or speculative bet that QQQ falls 19.4% from current levels to below $500 by mid-September 2026. At roughly $10.75 per contract ($4.3M / 4,000 contracts / 100), this trader is paying up for significant downside protection or making a directional bet on a major market correction.
Context check: The $500 strike sits just below where QQQ traded in April 2025 during the market drawdown. Getting there would require erasing most of 2025's gains.
Why it matters: Institutional players don't casually spend $4.3M on puts 19% out-of-the-money without a thesis. This could be:
- Portfolio hedging ahead of earnings volatility
- A macro play on sector rotation accelerating
- Protection against Fed policy surprises
- A bet on the "AI monetization wall" hitting tech earnings
Technical Setup
YTD Performance
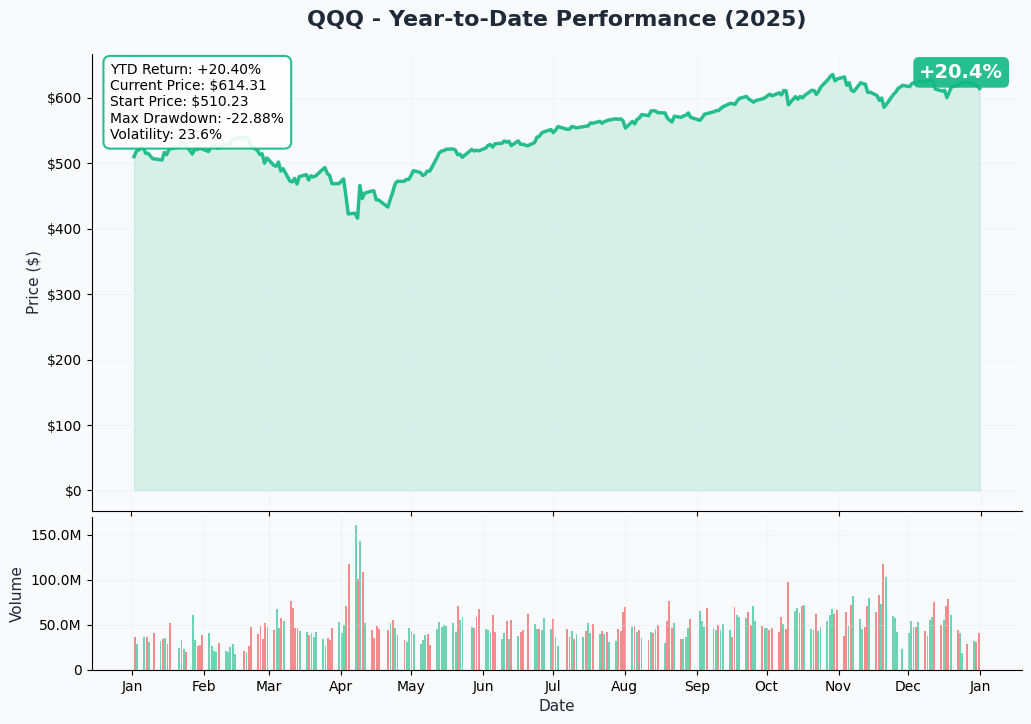
QQQ delivered solid returns in 2025, gaining approximately 20.4% from $510.23 to around $614.31 by year end. However, the path wasn't smooth:
- Max Drawdown: -22.88% (April 2025 correction)
- Volatility: 23.6% annualized
- Current Price: ~$620 (as of January 8, 2026)
The ETF recovered strongly from its April lows but has shown consolidation near all-time highs in recent weeks. Volume patterns suggest some distribution at elevated levels.
Gamma-Based Support & Resistance Analysis
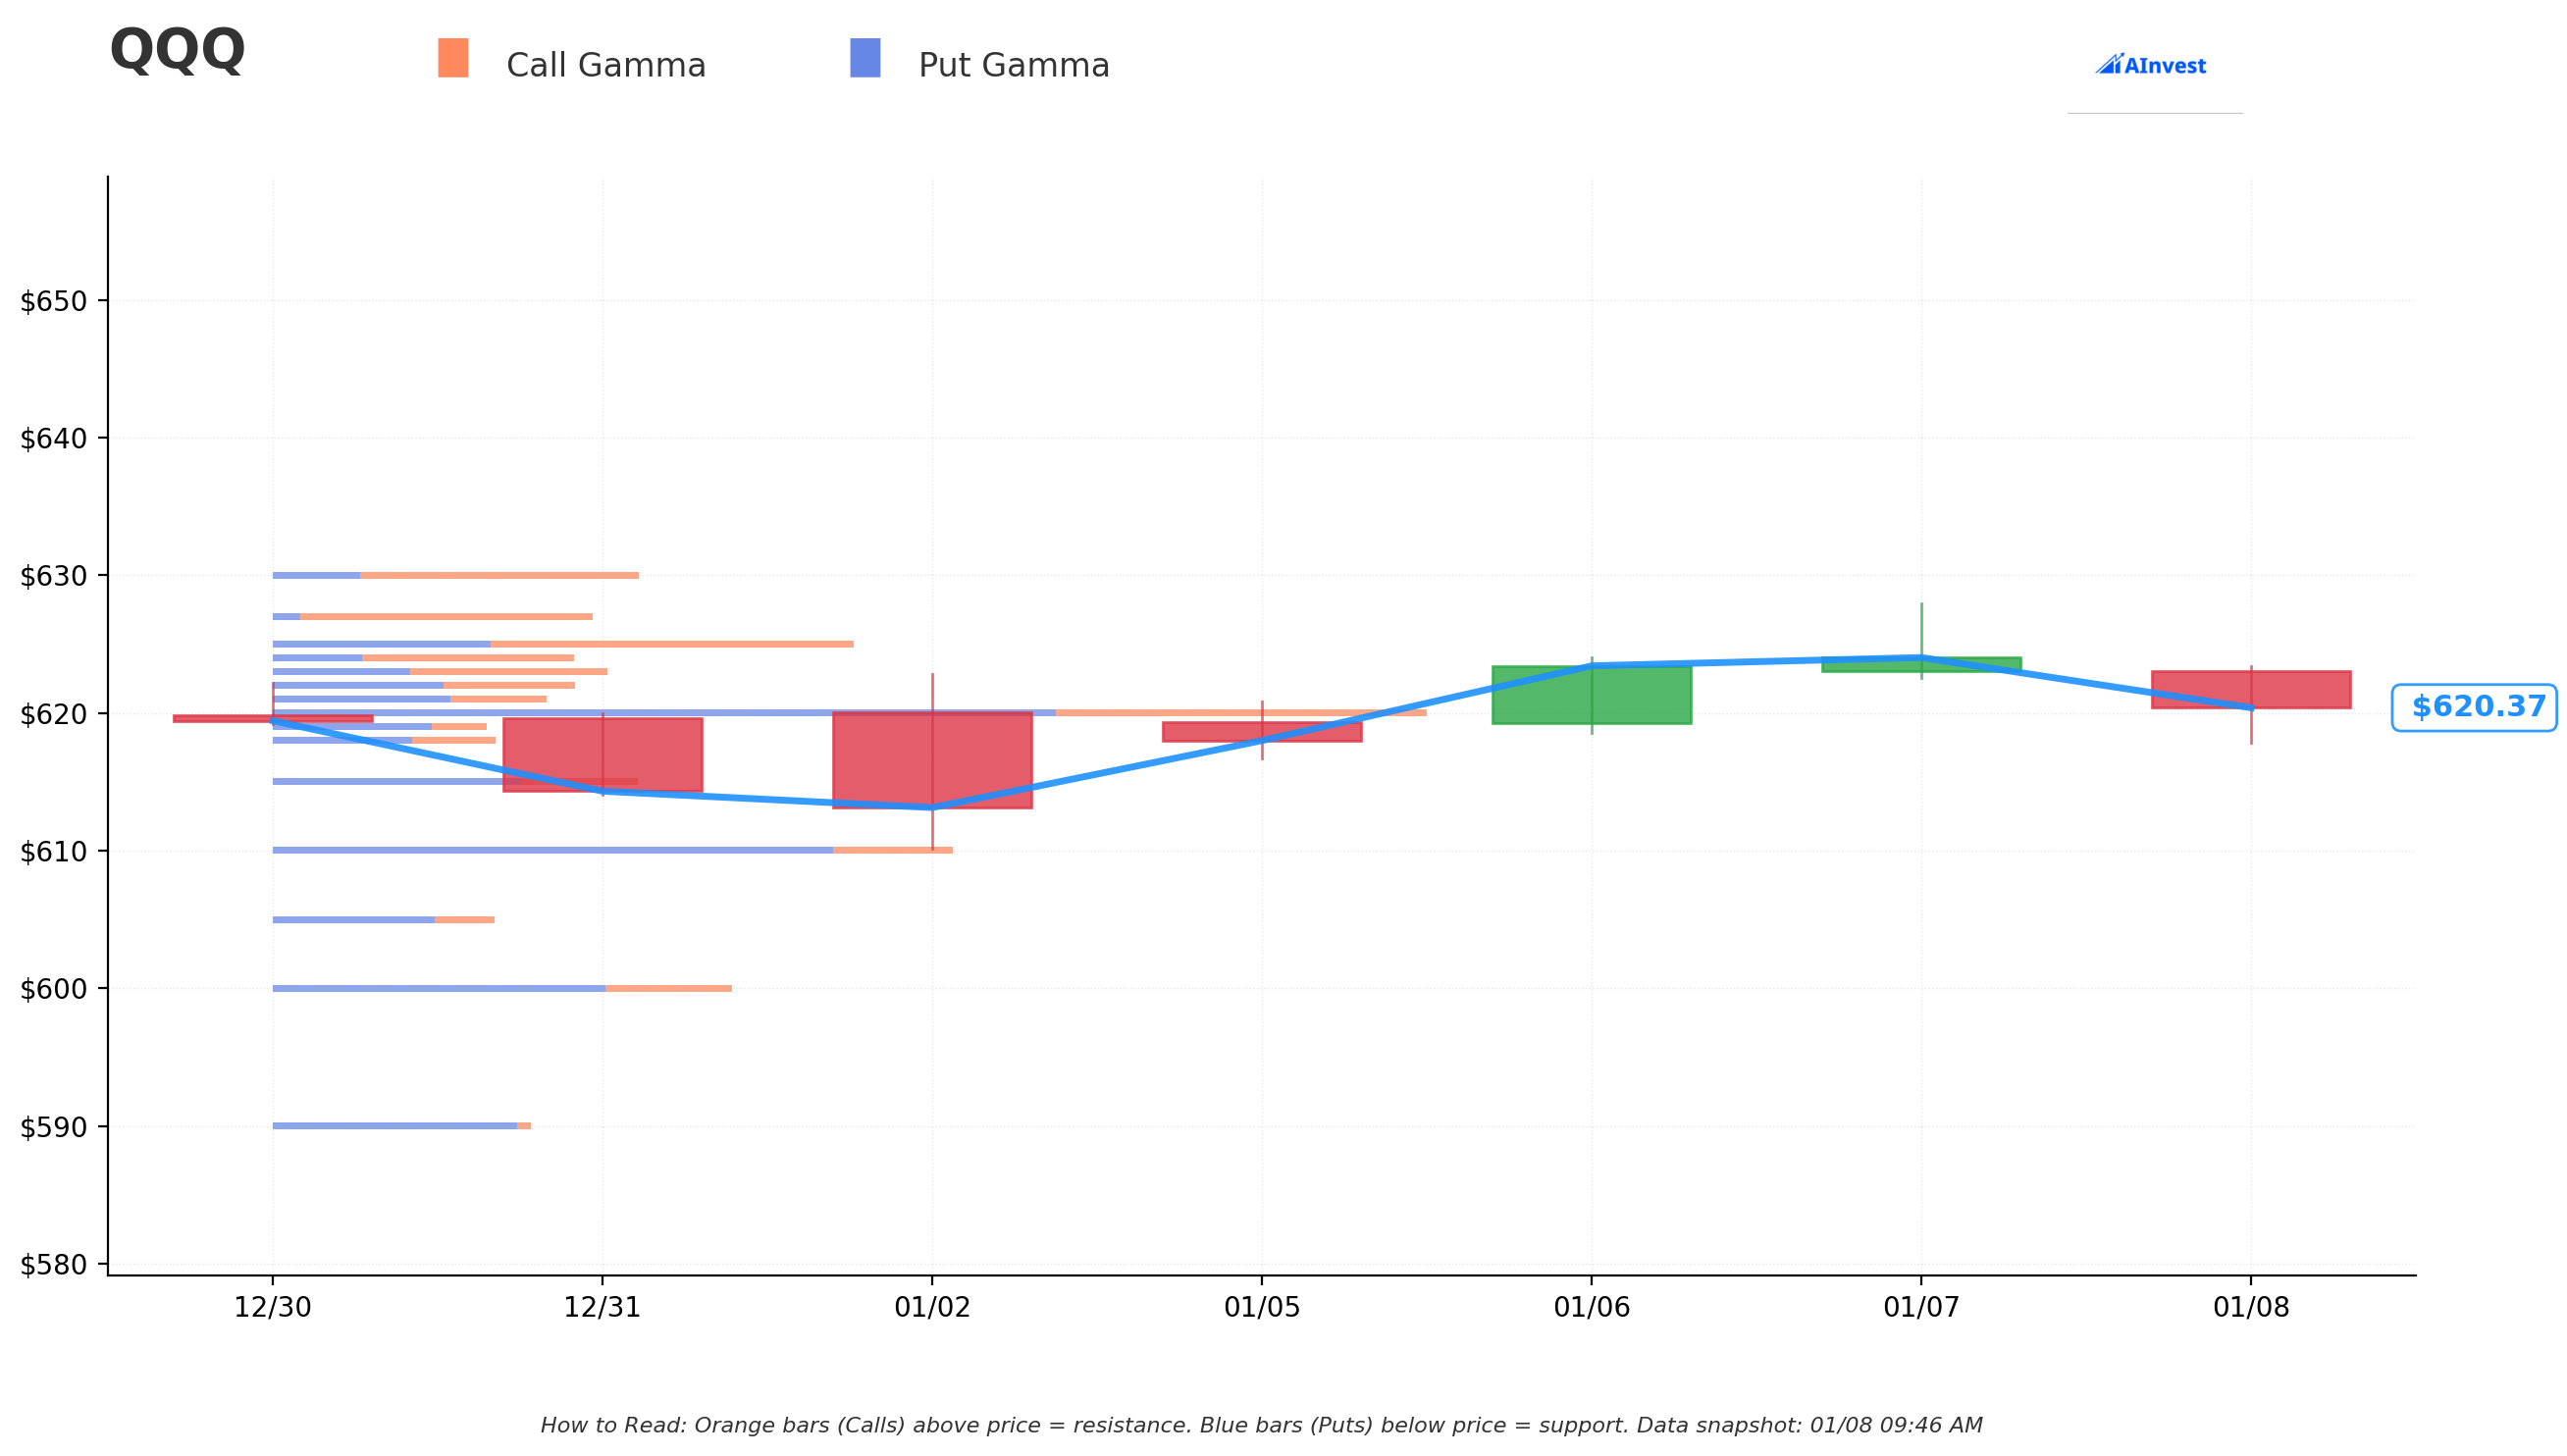
How to read this chart: Orange bars represent Call Gamma (resistance zones where dealers need to sell to hedge), while Blue bars represent Put Gamma (support zones where dealers need to buy to hedge).
Key Gamma Levels:
| Level | Type | Significance |
|---|---|---|
| $630 | Strong Resistance | Heavy call gamma - price likely to stall here |
| $625-628 | Resistance Zone | Cluster of call gamma creating ceiling |
| $622-624 | Near-Term Resistance | Current congestion area |
| $620 | Current Price | Price gravitating to high gamma zone |
| $615 | Moderate Support | Put gamma providing cushion |
| $610 | Key Support | Strong put gamma wall |
| $600 | Major Support | Significant put gamma concentration |
| $590 | Deep Support | Extended put gamma protection |
Interpretation: QQQ is currently pinned near $620 with significant resistance building overhead at $625-630. The put gamma below $615 suggests dealer hedging would provide buying support on pullbacks. A break below $610 could accelerate downside as gamma flips.
Implied Move Analysis
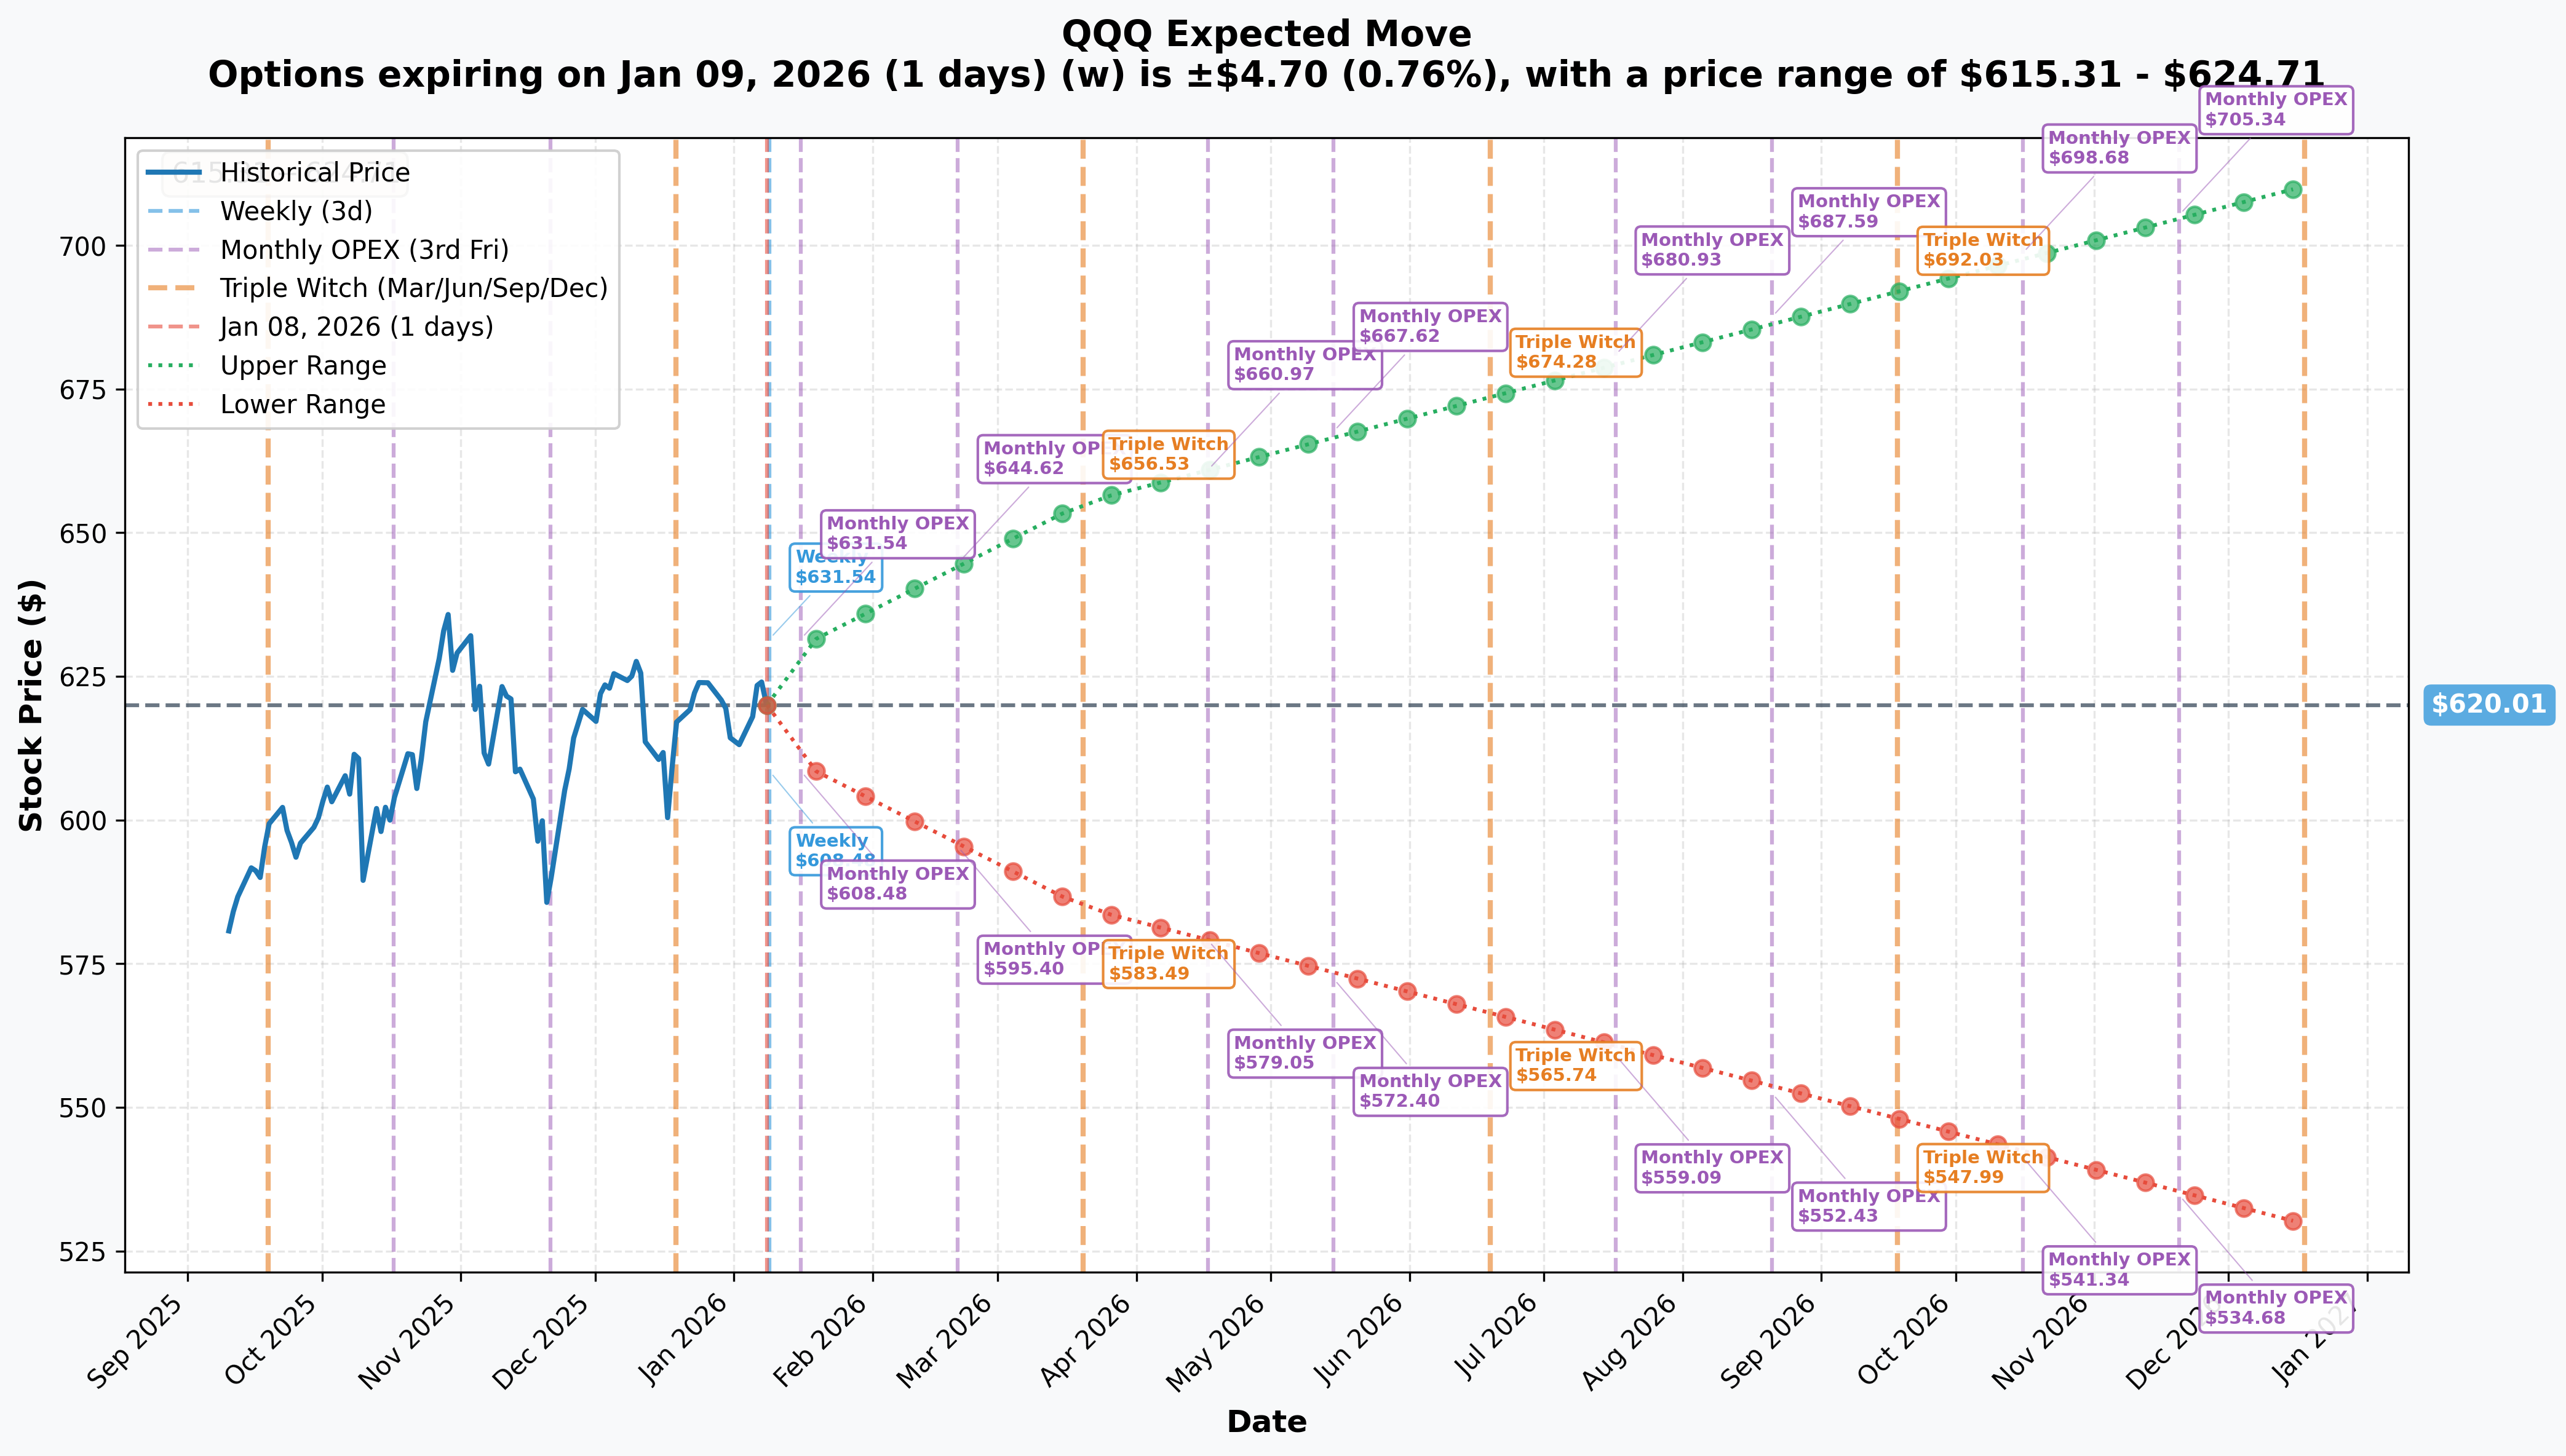
Options Market Expectations by Expiration:
| Timeframe | Expiry | Days | Implied Move | Range |
|---|---|---|---|---|
| Weekly | 2026-01-09 | 1 | +/- 0.76% ($4.70) | $615.31 - $624.71 |
| Monthly OPEX | 2026-01-16 | 8 | +/- 1.67% ($10.34) | $609.67 - $630.35 |
| Quarterly (Triple Witch) | 2026-03-20 | 71 | +/- 5.69% ($35.31) | $584.70 - $655.32 |
| September (Trade Expiry) | 2026-09-18 | 253 | ~14% (extrapolated) | $532 - $707 |
| LEAPS | 2026-12-18 | 344 | +/- 14.58% ($90.37) | $529.64 - $710.38 |
Key Takeaway: The options market is pricing in moderate near-term volatility but expects significant movement over the course of 2026. The $500 put strike sits below even the most conservative implied move ranges through September, suggesting this trader is betting on a tail risk event or building substantial protection.
Catalysts
Upcoming (High Impact)
Earnings Season - January 28 to February 25, 2026:
The Magnificent 7 report in rapid succession - any disappointment could cascade through QQQ:
| Company | Date | Weight in QQQ | Key Metrics to Watch |
|---|---|---|---|
| Microsoft | Jan 28 (est.) | 7.73% | Azure growth (+37% guided), Copilot monetization |
| Meta | Jan 28 | ~3.0% | Q1 guidance, $107.9B CapEx impact on FCF |
| Tesla | Jan 28 | 3.31% | 2026 delivery guidance after -8.6% in 2025 |
| Apple | Jan 29 | 8.75% | iPhone 17 momentum, China recovery |
| Alphabet | Feb 3 | 7.62% | Cloud growth, AI monetization |
| Amazon | Feb 5 (est.) | 5.26% | AWS reacceleration, retail margins |
| NVIDIA | Feb 25 | 9.09% | Blackwell ramp, gross margins |
FOMC Meeting - January 28-29: Only 16% probability of a rate cut according to CME FedWatch via The Motley Fool. Markets expect just 2 cuts total in 2026, down from prior expectations.
Fed Chair Transition - May 2026: Powell's term expires, creating potential policy uncertainty. CNBC reports on the challenges ahead.
Recent Developments (Already Occurred)
Tesla Q4 Deliveries Miss (January 2, 2026): Delivered 418,227 vehicles, missing consensus of 423,000. Full year 2025 saw a second consecutive annual decline (-8.6%). CNBC coverage
CES 2026 - NVIDIA Vera Rubin (January 6-9, 2026): Jensen Huang unveiled the next-generation AI platform. Yahoo Finance
The "Great Rotation" Underway: Small-caps (Russell 2000) up +6.2% YTD while Nasdaq-100 remains flat. Sector rotation accelerating from mega-cap tech to value stocks. FinancialContent analysis
Price Targets & Probabilities
Based on gamma levels, implied move data, and catalyst analysis:
Bull Case: $655 (+5.6%)
- Probability: 25%
- Thesis: Tech earnings surprise to upside, AI monetization concerns dispelled
- Trigger: NVIDIA guides above expectations on February 25
- Gamma Support: Limited resistance above $630 on breakout
Base Case: $600-630 (Range-bound)
- Probability: 50%
- Thesis: Mixed earnings, rotation continues but tech holds support
- Trigger: Normal seasonal consolidation, Fed holds steady
- Gamma Support: Strong support at $610, resistance at $625-630
Bear Case: $550-580 (-6% to -11%)
- Probability: 20%
- Thesis: Earnings disappointments, rotation accelerates, macro headwinds
- Trigger: Multiple Mag-7 misses, hawkish Fed surprise
- Gamma Support: Major support at $590, but breaks could accelerate selling
Tail Risk: $500 (-19.4%)
- Probability: 5%
- Thesis: Major correction, AI bubble narrative, credit event
- Trigger: Systemic shock, Fed policy error, geopolitical crisis
- Gamma Support: Below $580 gamma support thins significantly
Trading Ideas
Conservative: Cash-Secured Put Spread
The "Sleep Well" Strategy
Sell the QQQ January 16, 2026 $610/$600 put spread for ~$2.50 credit.
| Leg | Strike | Action | Premium |
|---|---|---|---|
| Short Put | $610 | Sell | +$5.00 |
| Long Put | $600 | Buy | -$2.50 |
| Net Credit | $2.50 |
- Max Profit: $250 per spread if QQQ stays above $610
- Max Loss: $750 per spread if QQQ below $600
- Breakeven: $607.50
- Why it works: Gamma support at $610 and implied move suggests 1.67% range through OPEX. You're selling below the expected range.
Balanced: Protective Collar on QQQ Shares
The "Tech Hedge" Strategy
If you own 100 QQQ shares (~$62,000 position):
| Leg | Position | Action | Cost |
|---|---|---|---|
| Shares | 100 QQQ | Hold | - |
| Put | March $580 | Buy | ~$7.00 |
| Call | March $660 | Sell | ~$4.50 |
| Net Cost | $2.50 |
- Protection: Floor at $580 through Triple Witch
- Trade-off: Gains capped at $660
- Why it works: Get downside protection through earnings season for minimal cost, while still participating in upside to $660 (+6.5%)
Aggressive: Follow the Whale
The "Smart Money Tail" Strategy
Buy the QQQ September 18, 2026 $520 puts for ~$8.00 (smaller position than the whale trade).
| Detail | Value |
|---|---|
| Strike | $520 |
| Expiration | 2026-09-18 |
| Premium | ~$800 per contract |
| Contracts | 5 (example) |
| Total Risk | $4,000 |
- Breakeven: $512 (-17.4% from current)
- Target: 100%+ gain if QQQ drops to $500 or below
- Why it works: Piggybacking on a $4.3M institutional bet at a smaller scale. The September expiry captures multiple catalyst windows including all Q1 and Q2 earnings.
- Risk: Premium decay will hurt if QQQ stays elevated. This is a tail risk play.
Risk Factors
Valuation Risk: Nasdaq 100 P/E at 37.92x is near all-time highs. GuruFocus shows historical median of just 24.34x.
AI Monetization Gap: Markets demanding proof of AI revenue versus $500B+ infrastructure spend. Q1 2026 identified as potential "hotspot" for optimism to be challenged. Forex.com analysis
Sector Rotation: "Great Rotation" favoring value and small-caps could continue. iShares 2026 Outlook notes earnings growth convergence reducing Mag-7 premium.
Concentration Risk: Top 10 holdings represent 49.21% of QQQ. Any single-stock shock (e.g., NVIDIA miss) creates outsized ETF impact.
Fed Policy: Only 2 cuts expected in 2026. Higher-for-longer rates pressure growth valuations. U.S. Bank Fed outlook
Tesla Execution: With 3.31% weight, Tesla's delivery struggles and competitive pressure from BYD could weigh on returns.
The Bottom Line
Here's the deal: A sophisticated trader just placed a $4.3M bet that QQQ falls nearly 20% by September. With a Z-Score of 18.76, this isn't ordinary hedging - it's an extremely unusual position we might see only a few times per year.
Does this mean you should panic? No. But it's worth paying attention.
If you're long QQQ: Consider adding some downside protection through earnings season. The January 28-February 25 stretch is packed with Mag-7 reports that could validate or challenge the AI narrative.
If you're on the sidelines: Wait for clarity on tech earnings before adding exposure. The risk/reward at all-time high valuations isn't compelling.
If you're bearish: The September puts offer an interesting way to express that view, though the $500 strike requires a significant move. Closer strikes (like $550 or $580) offer better probability at higher cost.
Mark your calendar:
- January 28-29: FOMC + MSFT/META/TSLA/AAPL earnings
- February 3: GOOGL earnings
- February 5: AMZN earnings
- February 25: NVDA earnings (potential market mover)
The whale trade doesn't guarantee anything, but $4.3M in puts before earnings season deserves your attention.
Disclaimer: This analysis is for informational purposes only and does not constitute investment advice. Options involve significant risk and are not suitable for all investors. You could lose your entire investment. Past unusual activity does not predict future returns. Always do your own research and consult with a qualified financial advisor before making investment decisions.
Analysis by AInvest Option Flow | January 8, 2026