🛡️ QQQ $13M September Put Hedge - Institutional Insurance on the Nasdaq 100!
📅 February 2, 2026 | 🔥 Unusual Activity Detected
🎯 The Quick Take
Someone just dropped $13 MILLION on QQQ puts with a September 18 expiration - that's 7.5 months of downside protection on the entire Nasdaq 100! With 5,000 contracts at the $590 strike (5.8% below current price), this is textbook institutional portfolio insurance ahead of a gauntlet of macro catalysts: GOOG earnings Tuesday, AMZN earnings Wednesday, NVDA on February 25, and multiple FOMC meetings through September. When smart money spends $13M on protection at peak market optimism, we pay attention.
📊 ETF Overview
Invesco QQQ Trust (QQQ) is the most actively traded ETF tracking the Nasdaq-100 Index - essentially a one-stop shop for the biggest names in tech:
- 💰 AUM: ~$409B
- 📊 Index: Nasdaq-100 (100 largest non-financial stocks on NASDAQ)
- 📈 Current Price: $626.52
- 🏦 Top Holdings: NVDA, AAPL, MSFT, AMZN, GOOG, META, TSLA (~44% of the fund)
- 📅 52-Week Range: $402.39 - $637.01
- 🚀 2025 Full-Year Return: +22.3%
QQQ is the go-to instrument for institutions looking to hedge broad tech exposure. When you see massive put buying on QQQ, it's not about one company - it's about the entire technology sector.
💰 The Option Flow Breakdown
The Tape (February 2, 2026 @ 11:53:47):
| Time | Symbol | Buy/Sell | Type | Expiration | Premium | Strike | Volume | OI | Size | Spot | Option Price | Contract |
|---|---|---|---|---|---|---|---|---|---|---|---|---|
| 11:53:47 | QQQ | BUY | PUT | 2026-09-18 | $13M | $590 | 5K | 13K | 5,000 | $626.52 | $25.40 | QQQ20260918P590 |
Strategy Classification: STANDALONE - Long Put / Portfolio Hedge
🤓 What This Actually Means
This is a massive portfolio hedge - pure insurance on the Nasdaq 100. Here's the breakdown:
- 💸 Premium paid: $13M ($25.40 per contract x 5,000 contracts)
- 🛡️ Protection level: $590 strike = 5.8% below current price - a reasonable cushion, not a doomsday bet
- ⏰ Time horizon: 7.5 months to September 18 - captures earnings season, multiple FOMC meetings, tariff developments, and the entire spring/summer macro calendar
- 📊 Volume vs OI: 5,000 contracts traded against 13,000 open interest - massive single-day activity
- 🏦 Execution style: Filled at MID price, signaling patient institutional execution (not panic buying)
- 🏷️ Classification: Likely a Buy-to-Open (BTO) new hedge position given the size and timing
What's really happening here:
This trader is protecting a LARGE tech-heavy portfolio - we're talking about coverage on roughly $313M worth of QQQ exposure (5,000 contracts = 500,000 shares x $626.52). They're paying $25.40 per share (4.1% of spot price) for the right to sell at $590 through September. Think of it as paying a $13M insurance premium on a $300M+ tech portfolio. The breakeven on the downside is $564.60 - they need QQQ to drop 9.9% just to break even on the puts alone. But that's not the point - the puts protect the STOCK portfolio, not generate standalone profit.
Unusual Score: 🔥 Z-Score of 8.04 (EXTREMELY UNUSUAL) - This kind of put buying happens only a few times a year in QQQ. The size alone tells you this is institutional money - no retail trader is spending $13M on September puts.
📈 Technical Setup / Chart Check-Up
YTD Performance Chart
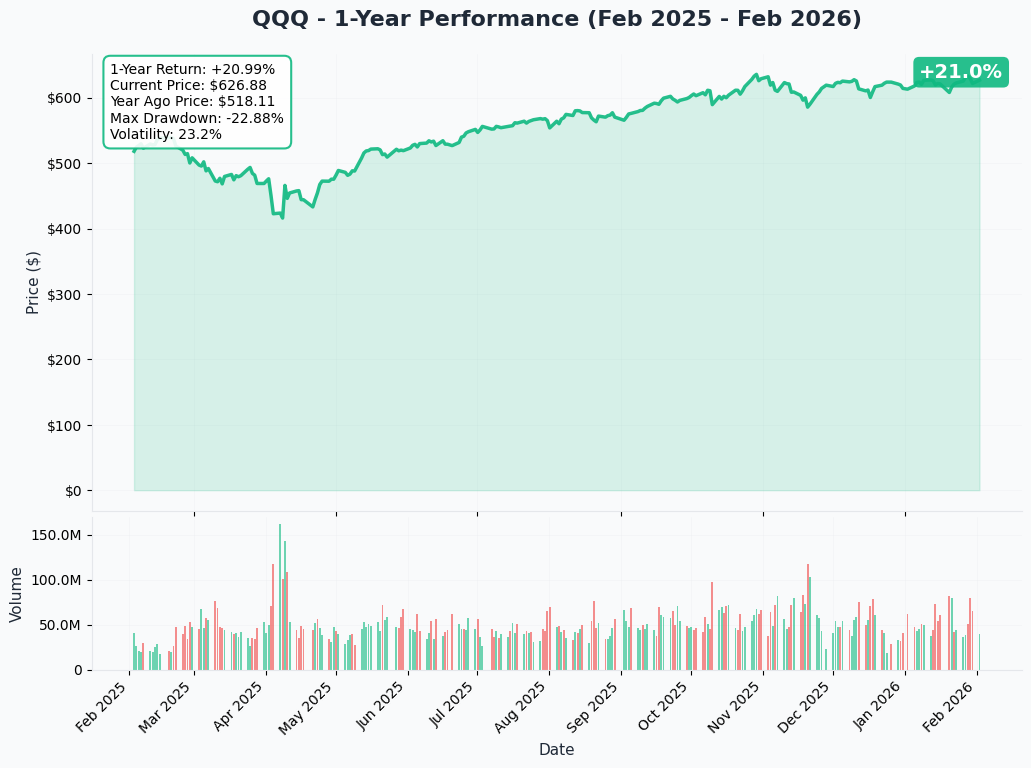
QQQ is trading at $626.52 after a strong 2025 that delivered +22.3% returns. The ETF recently broke out of a 7-week consolidation range in late January, powered by blowout earnings from Apple (+16% revenue YoY), Meta (+24% revenue YoY), and Microsoft's Azure growing 39%.
Key observations:
- 📈 Near 52-week highs: Current price $626.52 vs 52-week high of $637.01 - only 1.7% from the top
- 🔄 Breakout confirmed: Smashed through the 7-week consolidation range on mega-cap earnings strength
- 📊 RSI neutral: 14-day RSI at 47.23 - neither overbought nor oversold, room to move either direction
- 🏗️ 50-day SMA support: $615.74 providing near-term floor
- 🛡️ 200-day SMA: $557.22 - well below, confirming long-term uptrend intact
Gamma-Based Support & Resistance Analysis
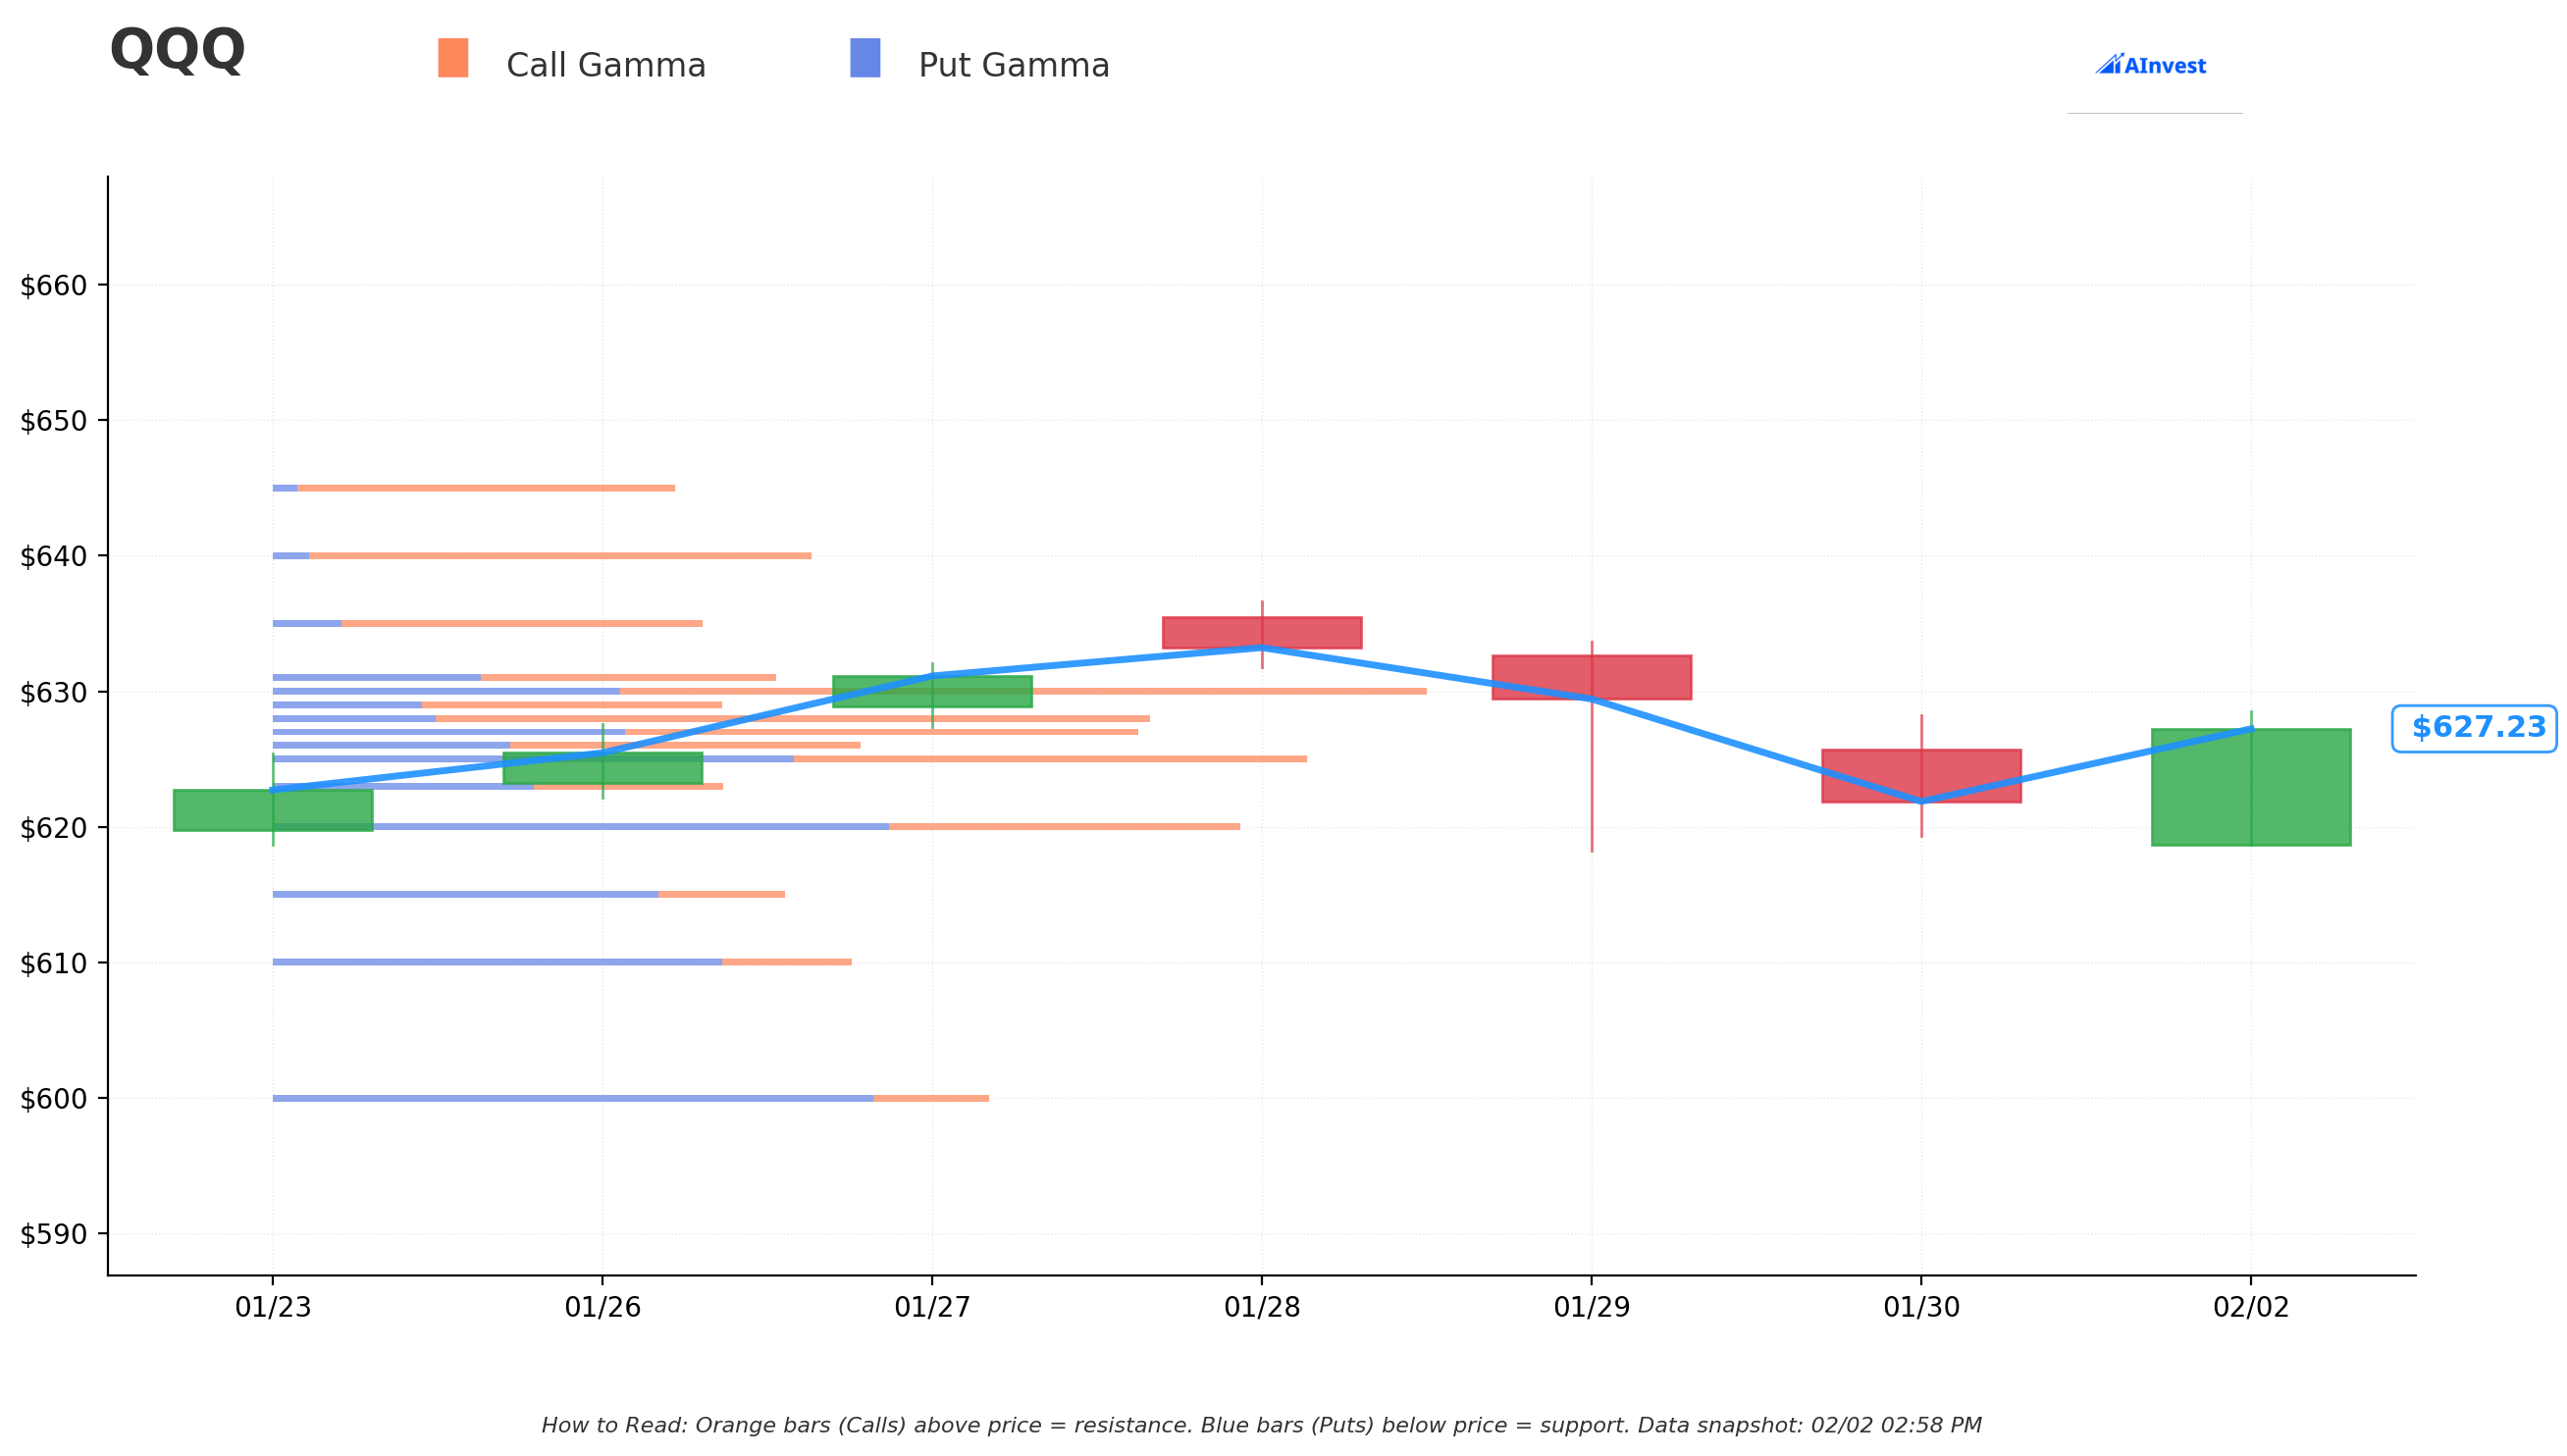
Current Price: $627.20
The gamma exposure map reveals where market makers have their largest positions, creating natural price magnets and barriers:
🔵 Support Levels (Put Gamma Below Price):
- $627 - Immediate support with 174B total gamma exposure (closest floor)
- $626 - Secondary support at 119B gamma
- $625 - STRONGEST nearby support with 206B total gamma (massive two-way activity!)
- $620 - Major structural support at 196B gamma (1.1% below current price)
- $615 - Extended support at 104B gamma (aligns with 50-day SMA at $615.74!)
- $610 - Deep support at 117B gamma
- $600 - Extended floor with 145B gamma (4.3% below current)
🟠 Resistance Levels (Call Gamma Above Price):
- $628 - Immediate ceiling with 175B gamma (just 0.13% overhead)
- $630 - STRONGEST resistance with 236B total gamma (major wall 0.4% above)
- $640 - Extended upside target at 109B gamma (2% above current)
What this means for traders: QQQ is sitting right between thick support at $625-$627 and a massive resistance wall at $628-$630. The net GEX bias is Bullish (1,788B call gamma vs 1,622B put gamma), which means market makers are generally positioned to BUY dips and SELL rallies - keeping price action contained in a range. The $630 level with 236B gamma is THE wall that needs to break for new highs. On the downside, $625 with 206B gamma and $620 with 196B gamma are the levels where buyers should step in.
Why $590 for the hedge? The put buyer chose a strike 5.8% below current price - well below all the nearby gamma support. This suggests they're not hedging against a normal 2-3% dip (gamma support would cushion that). They're protecting against a structural breakdown - the kind of 6-10% correction that blows through gamma support levels during a macro shock.
Implied Move Analysis
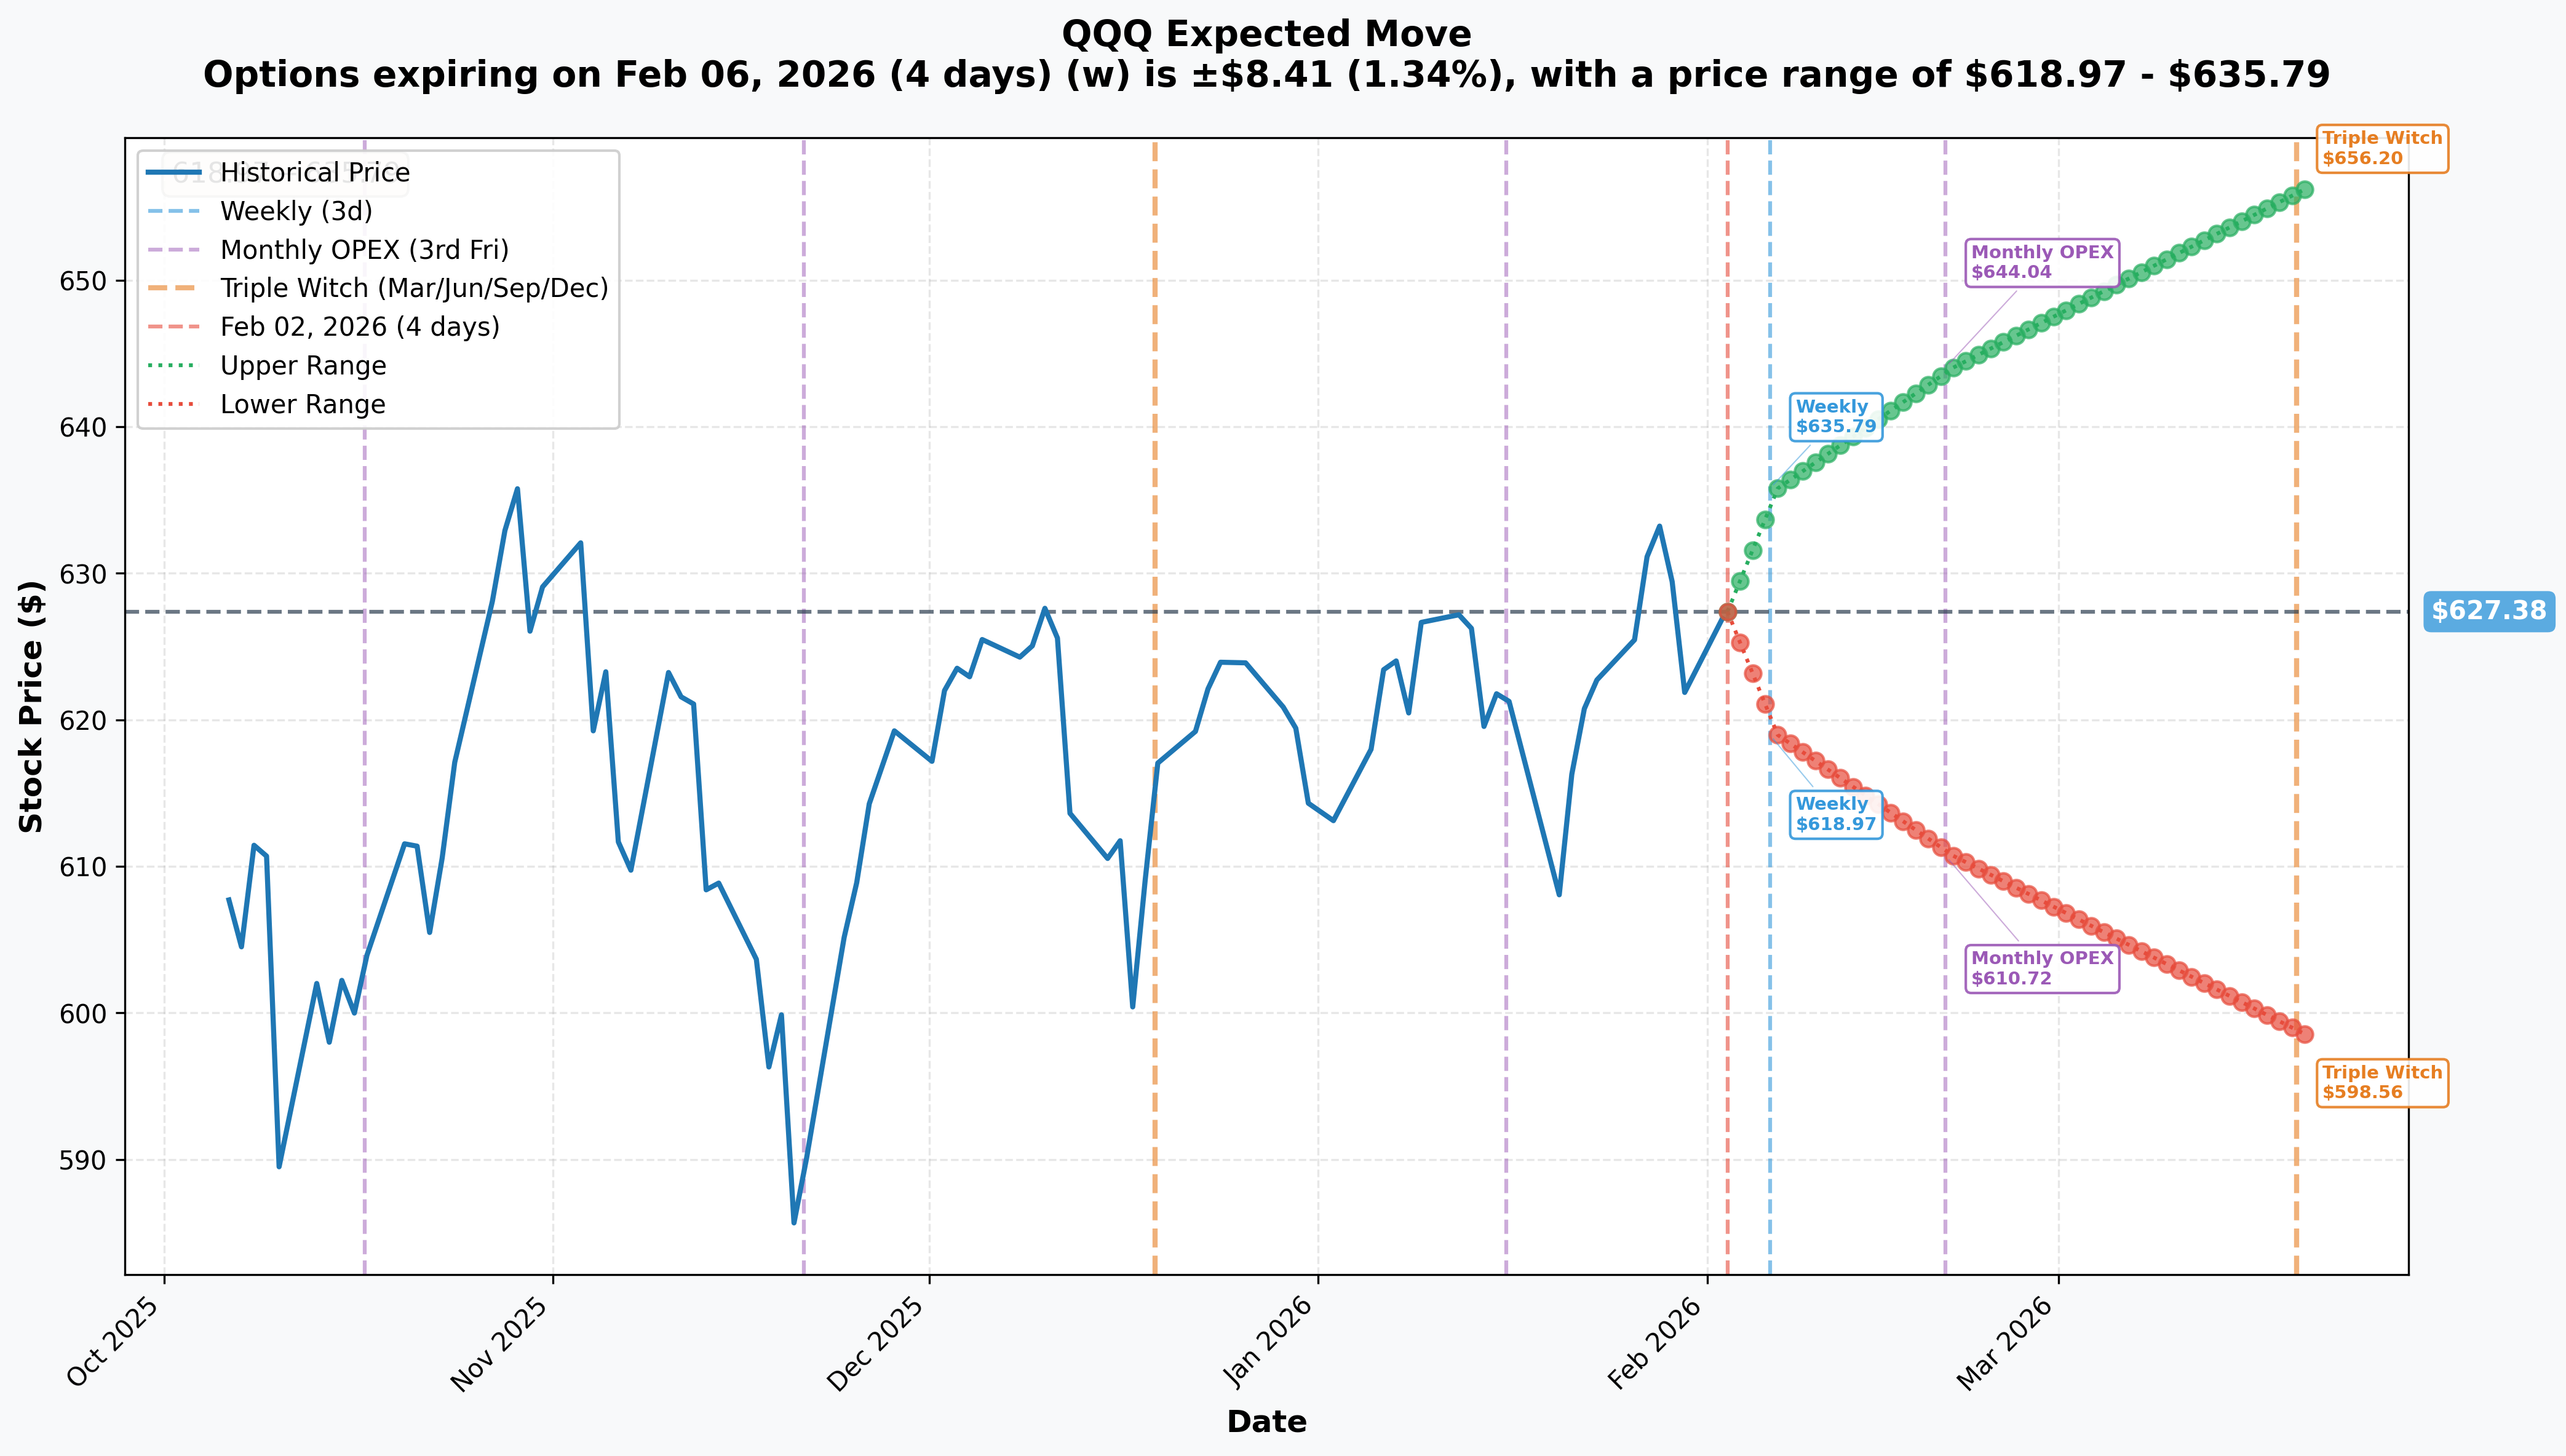
Options market pricing for upcoming expirations:
- 📅 Weekly (Feb 6 - 4 days): +/- $8.41 (+/- 1.34%) --> Range: $618.97 - $635.79
- 📅 Monthly OPEX (Feb 20 - 18 days): +/- $16.66 (+/- 2.66%) --> Range: $610.72 - $644.04
- 📅 Quarterly Triple Witch (Mar 20 - 46 days): +/- $28.82 (+/- 4.59%) --> Range: $598.56 - $656.20
Translation for regular folks: The options market expects QQQ to move about 1.3% this week (earnings from GOOG and AMZN will drive that), expanding to 2.7% by February OPEX and 4.6% by March triple witch which includes the critical FOMC meeting with new dot plot projections.
The weekly implied move lower range of $618.97 sits right near the $620 gamma support level - meaning the market thinks any dip this week will be contained around that zone. The March lower range of $598.56 aligns closely with the $600 gamma support (145B) - these levels are where institutions expect the floor to hold.
Key insight: The $590 put strike is BELOW even the March triple witch implied move range ($598.56 lower bound). This put buyer is protecting against a move that the options market considers unlikely in the near term - but over 7.5 months, a lot can go wrong. Smart thinking.
🎪 Catalysts
🔥 Upcoming Catalysts (This Week and Beyond)
Alphabet (GOOG) Q4 Earnings - February 4 (TUESDAY!) 📊
Alphabet reports Tuesday with consensus at $111.3B revenue (+15% YoY) and $2.64 EPS (+23% YoY). Cloud backlog, AI monetization progress, and 2026 CapEx guidance will be the key swing factors. As one of QQQ's largest weights, any miss could drag the entire ETF.
Amazon (AMZN) Q4 Earnings - February 5 (WEDNESDAY!) 📊
Amazon follows Wednesday with $206-213B revenue guidance. AWS growth trajectory, retail margins, and 2026 CapEx update (likely exceeding last year's $125B) are critical. Inventory buildup outpacing sales growth is a concern.
January Jobs Report - February 6 📊
Revised benchmark employment data drops Friday. The Fed noted "job gains remained low" in their January statement - any further weakness could reignite recession fears and hit tech.
January CPI - February 11 📊
Inflation running closer to 3% than the Fed's 2% target. A hot CPI print would crush rate cut hopes and pressure growth/tech valuations hard.
NVIDIA Q4 FY2026 Earnings - February 25 (CRITICAL!) 🔥
This is arguably THE most important single-stock catalyst for QQQ. Revenue consensus at $65.42B (~66% YoY growth). NVDA is QQQ's largest holding - a miss here could trigger a 3-5% QQQ selloff in a single day. Blackwell ramp and data center demand guidance will set the tone for the entire AI trade.
March 17-18 FOMC Meeting + Dot Plot 🏦
First FOMC meeting with updated Summary of Economic Projections. Markets pricing at most two rate cuts for 2026. If the dot plot signals fewer cuts or even hikes, tech gets crushed. If it signals more accommodation, tech rips.
Additional Catalysts Through September Expiration:
- 📅 April 28-29: FOMC meeting + MSFT Q3 earnings
- 📅 April/May: AAPL Q2 earnings
- 📅 June 16-17: FOMC meeting + updated dot plot
- 📅 July 28-29: FOMC meeting
- ⚖️ Early 2026: Supreme Court ruling on IEEPA tariff authority
- 🇪🇺 TBD: EU retaliatory tariffs targeting US digital services companies
✅ Recently Completed Catalysts
Apple Q1 FY2026 (January 29) - BEAT 💪 Revenue $143.8B (+16% YoY), EPS $2.84 (+19% YoY). iPhone revenue $85.3B setting all-time records. Greater China surged 38%. Stock gained +1% after-hours.
Meta Q4 2025 (January 28) - CRUSHED IT 🚀 Revenue $59.89B (+24% YoY), EPS $8.88 beating $8.19 consensus by 8.4%. Guided 2026 CapEx to $115-135B for AI buildout. Stock surged 9%.
Microsoft Q2 FY2026 (January 28) - STRONG 📈 Revenue $81.3B (+17% YoY), Azure +39%, cloud surpassed $50B quarterly. Copilot at 15M paid seats (+160% YoY). $625B commercial backlog.
Tesla Q4 2025 (January 28) - MIXED ⚠️ Revenue $24.90B, slight beat, but full-year revenue declined for the first time ever. Net income down 61% YoY. Robotaxi expansion to 7 new US markets in H1 2026 is the bull case.
FOMC January 28 - PAUSE 🏦 Fed held rates at 3.50-3.75%, pausing after three consecutive cuts. Two dissents wanting another cut. Inflation still "somewhat elevated" near 3%.
🎲 Price Targets & Probabilities
Using gamma levels, implied move data, and the catalyst calendar, here's how QQQ could play out through the September 18 expiration:
📈 Bull Case (30% probability)
Target: $680-$720
How we get there:
- 💪 GOOG, AMZN, and NVDA ALL beat expectations - AI spending narrative fully validated
- 🏦 Fed signals rate cuts coming in June as inflation trends toward 2% target
- 🚀 Hyperscaler CapEx of $470B+ translates into actual revenue growth for the tech ecosystem
- 📈 Nasdaq-100 breaks through $630 gamma resistance, then $640, triggering momentum buying
- 🌐 Trade policy stabilizes - Supreme Court ruling provides clarity, EU tariff fears fade
- 💰 Analyst consensus target of $751.92 (+21% upside) starts to get priced in
Why 30%: Mega-cap earnings are already delivering (AAPL, META, MSFT crushed it), AI spending is accelerating, and the Nasdaq just broke out of a 7-week range. Momentum is real. But elevated valuations and policy uncertainty cap the probability.
🎯 Base Case (45% probability)
Target: $600-$660 range (CHOPPY CONSOLIDATION)
Most likely scenario:
- ✅ Mixed earnings: GOOG and AMZN meet expectations, NVDA beats but guidance less explosive
- ⚖️ Fed stays on hold through summer - neither cutting nor hiking
- 📊 Inflation stubbornly near 3%, keeping rate cut hopes alive but not materializing
- 🔄 QQQ oscillates between gamma support ($620-$625) and resistance ($630-$640)
- 🇺🇸 Tariff uncertainty persists but doesn't escalate dramatically
- 💤 AI monetization questions grow louder but don't trigger selloff - market waits for proof
This is the put buyer's "insurance was worth it" scenario: QQQ stays above $590, puts expire worthless, but the $13M was money well spent for 7.5 months of peace of mind on a $300M+ portfolio. At 4.1% of portfolio value annualized to about 6.5%, that's a reasonable insurance premium for a concentrated tech portfolio.
📉 Bear Case (25% probability)
Target: $540-$590 (PUTS PAY OFF!)
What could go wrong:
- 😰 NVDA earnings disappoint or guidance underwhelms - triggers broad tech selloff as AI narrative questioned
- 🚨 Inflation reaccelerates above 3.5% - Fed forced to signal NO cuts in 2026 or even rate HIKES
- 🇪🇺 EU retaliatory tariffs hit US digital services companies, impacting META, GOOG, AAPL, AMZN, MSFT
- ⚖️ Supreme Court upholds broad IEEPA tariff authority - more tariffs coming
- 💸 AI CapEx of $470B+ fails to generate ROI - depreciation crushes earnings across hyperscalers
- 📉 Recession probability rises (J.P. Morgan currently at 35%)
- 🔨 Break below $600 gamma support (145B) triggers institutional deleveraging cascade
- 📊 Growth-Value gap at early-2000s levels triggers mean reversion rotation out of tech
Critical support levels in a crash:
- 🛡️ $600: Major gamma floor (145B) + psychological round number
- 🛡️ $596: Technical accumulated volume support
- 🛡️ $590: THE PUT STRIKE - this is where the institutional hedge kicks in
- 🛡️ $557: 200-day SMA - major trend support
Put P&L in Bear Case:
- QQQ at $590 on Sep 18: Puts at-the-money, loss = -$25.40/share x 5,000 = -$12.7M (nearly total loss)
- QQQ at $570 on Sep 18: Puts worth $20.00, loss = -$5.40/share x 5,000 = -$2.7M (partial recovery)
- QQQ at $550 on Sep 18: Puts worth $40.00, profit = +$14.60/share x 5,000 = +$7.3M (56% ROI)
- QQQ at $530 on Sep 18: Puts worth $60.00, profit = +$34.60/share x 5,000 = +$17.3M (133% ROI)
Remember - these puts are HEDGING a long portfolio. Even if they expire worthless, the trader wins if QQQ stays above $590 because their stock portfolio holds value.
💡 Trading Ideas
🛡️ Conservative: The "Copy The Hedge" Play
Play: Buy protective puts on your own QQQ or tech-heavy portfolio
Structure: Buy QQQ Sep 18 $590 puts at ~$25.40 per contract
Why this works:
- 🛡️ Protects your tech portfolio against a 6-10% correction through September
- ⏰ 7.5 months of coverage captures ALL major catalysts (NVDA earnings, 4 FOMC meetings, full Q1 earnings season)
- 📊 $590 strike gives you a 5.8% cushion before protection kicks in
- 🏦 You're literally following institutional money - they spent $13M on this exact trade
- 💤 Sleep well at night knowing your downside is capped
Position sizing:
- 📏 For a $100K portfolio with 60% tech exposure: 1 contract ($2,540) = 2.5% insurance premium
- 📏 For a $50K portfolio: Consider a put spread instead (see Balanced strategy below)
- 🎯 General rule: Spend 1-3% of portfolio value on protection
Risk level: Low (you're buying insurance) | Skill level: Beginner-friendly
⚖️ Balanced: The "Smart Hedge" Put Spread
Play: Buy a put spread for cheaper portfolio protection
Structure: Buy QQQ Sep 18 $600 puts, Sell QQQ Sep 18 $570 puts
Why this works:
- 💸 Costs roughly 40-50% less than outright puts by capping your protection at $570
- 📊 $30-wide spread = $3,000 max payout per spread (solid protection for smaller accounts)
- 🎯 Covers the 4.2% to 9.0% drawdown zone - the most likely correction range
- ⏰ Same 7.5-month time horizon captures all catalysts
- 📉 $600 strike sits right at gamma support - gets triggered when things start to break down
Estimated P&L:
- 💰 Net debit: ~$10-12 per spread ($1,000-1,200)
- 📈 Max profit: ~$18-20 per spread at $570 or below ($1,800-2,000)
- 📉 Max loss: Premium paid if QQQ stays above $600
- 🎯 Breakeven: ~$588-590 (aligns with the institutional trade!)
- 📊 Risk/Reward: ~1:1.5 to 1:2
Position sizing: Risk 2-4% of portfolio on the spread. For a $50K account, 2-3 spreads provides meaningful protection.
Risk level: Moderate (defined risk, bearish tilt) | Skill level: Intermediate
🚀 Aggressive: The "Earnings Gauntlet" Calendar Put Spread
Play: Sell near-term puts against longer-dated puts to partially finance the hedge
Structure: Buy QQQ Sep 18 $590 puts, Sell QQQ Mar 20 $590 puts
Why this could work:
- 💸 Selling the March puts against your September puts reduces net cost by 30-40%
- ⏰ If QQQ stays above $590 through March triple witch (likely given gamma support), short leg expires worthless
- 🎯 You keep the September puts as free or cheap protection for the summer
- 📊 Takes advantage of the implied volatility term structure
- 🔄 After March expiration, you own September puts outright at a discount
Why this could blow up:
- 😰 If QQQ drops below $590 BEFORE March 20, your short put creates a loss that partially offsets long put gains
- 📊 Requires active management - may need to roll or close the short leg if market drops sharply
- 🎢 Pin risk at $590 near March expiration creates gamma exposure
- ⚠️ More complex execution - two legs, two expirations
Risk level: HIGH (requires active management) | Skill level: Advanced only
⚠️ Risk Factors
Don't get caught by these potential landmines:
-
📊 Earnings gauntlet THIS WEEK: Alphabet Tuesday and Amazon Wednesday report back-to-back. Combined they represent a massive chunk of QQQ's weighting. A double miss would be devastating. NVDA on February 25 is the biggest single-stock risk factor for the entire ETF.
-
🏦 Fed stuck between a rock and a hard place: Inflation near 3% with the Fed on hold at 3.50-3.75%. At most two cuts priced for 2026, none for 2027. If inflation reaccelerates, rate HIKE fears could emerge - that would be catastrophic for tech valuations. Four FOMC meetings between now and the September put expiration.
-
🇺🇸 Tariff uncertainty escalating: 25% semiconductor tariffs already in effect since January 15. EU and France considering retaliatory tariffs targeting US digital services (that's META, GOOG, AAPL, MSFT, AMZN - basically all of QQQ's top holdings). Supreme Court IEEPA ruling could go either way.
-
📉 Concentration risk is REAL: Top 7 holdings represent ~44% of QQQ. If even 2-3 of these names stumble simultaneously, the entire ETF drops hard. Tesla already posted its first-ever annual revenue decline - what if the contagion spreads?
-
💸 AI ROI reckoning approaching: Hyperscalers committing $470B+ in CapEx for 2026. Meta alone guiding $115-135B. The market is shifting from rewarding AI spending to demanding ROI proof. If monetization disappoints, elevated depreciation crushes earnings across the group.
-
📊 Growth-Value gap at danger zone: The valuation gap between growth and value reached levels not seen since early 2000s. History shows these extremes eventually mean-revert. Institutional investors already began trimming tech in late 2025.
-
🌍 Recession probability not trivial: J.P. Morgan forecasts 35% probability of US/global recession in 2026. QQQ at stretched valuations with zero recession protection. Enterprise IT budgets get cut FIRST in a downturn.
-
🐋 This $13M hedge IS the warning sign: When institutions spend $13M protecting against a 5.8% drawdown on the Nasdaq 100, they're telling you something. The Z-score of 8.04 means this level of put buying is extremely rare. Respect the signal.
🎯 The Bottom Line
Real talk: Someone just spent $13 MILLION buying 7.5 months of insurance on the Nasdaq 100, and we should all be paying attention to why.
This isn't a doomsday trade. The $590 September puts represent smart, disciplined risk management from an institution that likely holds a $300M+ tech portfolio. They've watched Apple crush it, Meta surge 9% on earnings, and Microsoft post 39% Azure growth - and they're STILL buying protection. That tells you the risk/reward at these levels isn't as clean as the headlines suggest.
What this trade tells us:
- 🎯 Smart money sees enough risk over the next 7.5 months to justify spending 4.1% of portfolio value on protection
- ⏰ The September expiration captures EVERY major catalyst: GOOG/AMZN/NVDA earnings, 4 FOMC meetings, tariff developments, AI ROI reckoning
- 📊 The $590 strike (5.8% OTM) suggests they expect any correction to be meaningful, not just a small dip
- 🏦 Execution at MID price with 5,000 contracts signals patience and sophistication - this was planned, not reactive
If you own tech-heavy positions:
- 🛡️ Consider hedging 20-30% of your downside exposure using puts or put spreads on QQQ
- ⏰ This week is critical - GOOG Tuesday, AMZN Wednesday set the near-term tone
- 📅 Mark your calendar: NVDA February 25 - this single report could move QQQ 3-5%
- 📊 If you're going to add protection, do it BEFORE the catalysts, not after the damage is done
- 🎯 The $590-$600 zone is where institutions are positioned - use that as your guide for hedge strikes
If you're watching from the sidelines:
- 👀 Wait for NVDA earnings February 25 before making major tech commitments
- 📊 A pullback to $600-$610 (gamma support zone) would be a much better entry than chasing at $627
- 🏦 Watch the March 17-18 FOMC meeting closely - the dot plot will set the rate narrative for the rest of 2026
- 💡 Analyst consensus Strong Buy with $751.92 target (+21% upside) - but that's a 12-month view, not a "buy today" signal
If you're bearish:
- 📉 The put spread strategies outlined above offer defined-risk ways to profit from a correction
- 🎯 Key breakdown level: $620 (gamma support) --> $600 (major floor) --> $590 (institutional hedge strike)
- ⏰ Wait for catalyst triggers before going short - fighting momentum at all-time highs is painful
- 📊 Watch for more institutional put buying as a confirmation signal
Key dates through September expiration:
- 📅 February 4 - Alphabet Q4 earnings
- 📅 February 5 - Amazon Q4 earnings
- 📅 February 6 - January jobs report
- 📅 February 11 - January CPI
- 📅 February 25 - NVIDIA Q4 FY2026 earnings (CRITICAL!)
- 📅 March 17-18 - FOMC meeting + dot plot update
- 📅 April 28-29 - FOMC meeting + MSFT earnings
- 📅 June 16-17 - FOMC meeting + updated economic projections
- 📅 September 18 - This $13M put trade expires
Final verdict: The bull case for tech is real - earnings are delivering, AI spending is accelerating, and the Nasdaq-100 just broke out of consolidation. But at stretched valuations with inflation sticky near 3%, tariff uncertainty escalating, and AI ROI demands mounting, the downside risks over the next 7.5 months are equally real. The institutional put buyer isn't being bearish - they're being SMART. In a market where the top 7 stocks drive 44% of your returns, protecting the downside isn't optional. It's professional.
Take a page from the big money playbook: Stay long, but hedge your bets. The best traders don't just know how to make money - they know how to keep it. 💪
Disclaimer: Options trading involves substantial risk of loss and is not suitable for all investors. This analysis is for educational purposes only and not financial advice. Past performance doesn't guarantee future results. The Z-score of 8.04 reflects this specific trade's size relative to recent QQQ history - it does not imply the trade will be profitable or that you should follow it. Always do your own research and consider consulting a licensed financial advisor before trading. QQQ is concentrated in tech stocks and subject to sector-specific risks including regulatory, competitive, and macroeconomic headwinds.
About Invesco QQQ Trust: The Invesco QQQ Trust tracks the Nasdaq-100 Index, providing exposure to the 100 largest non-financial companies listed on NASDAQ. With approximately $409B in assets under management, QQQ is one of the most actively traded ETFs in the world, heavily weighted toward technology, communication services, and consumer discretionary sectors.