🛡️ QQQ: $31M in September Puts — Institutional Hedging at Scale Before NVIDIA Earnings!
📅 February 6, 2026 | 🔥 Unusual Activity Detected
🎯 The Quick Take
Two massive put purchases hit the tape within minutes of each other — $17M on the $595 strike and $14M on the $555 strike, both targeting September 18, 2026 (triple witch) expiration. That is $31 million in downside protection on QQQ with a 7+ month runway, bought while the Nasdaq-100 trades near $604. These are standalone purchases, not a spread — whoever placed these is either protecting a massive equity book or making a directional bet that tech has meaningful downside ahead.
🏢 ETF Overview
Invesco QQQ Trust (QQQ) is the flagship ETF tracking the Nasdaq-100 Index, providing concentrated exposure to the 100 largest non-financial companies listed on the Nasdaq:
- Assets Under Management: ~$411.78 billion
- Expense Ratio: 0.18%
- Current Price: ~$604-608 (down from 52-week high of $637.01)
- Full Year 2025 Return: +20.77%
- Top Holdings: NVIDIA (8.46%), Apple (7.69%), Microsoft (5.90%), Amazon (4.93%), Meta (3.92%)
- Magnificent Seven Weight: ~40-45% of total fund
- Key Theme: Heavy AI infrastructure and semiconductor exposure with significant concentration risk in top 3 names (>22% of index)
💰 The Option Flow Breakdown
📊 The Tape (February 6, 2026)
| Time | Symbol | Side | Buy/Sell | Type | Expiration | Premium | Strike | Volume | OI | Size | Spot | Option Price |
|---|---|---|---|---|---|---|---|---|---|---|---|---|
| 09:47:39 | QQQ | ASK | BUY | PUT | 2026-09-18 | $17M | $595 | 5,000 | 8,000 | 5,000 | $604.55 | $34.26 |
| 09:49:46 | QQQ | MID | BUY | PUT | 2026-09-18 | $14M | $555 | 6,000 | 4,400 | 6,000 | $603.85 | $22.55 |
🐋 Total Premium: $31M across 11,000 contracts
🤓 What This Actually Means
These are TWO SEPARATE standalone put purchases — NOT a put spread. Each trade stands on its own as an independent position. Here is what makes this significant:
🐋 Trade 1: $595 Put — $17M ($34.26/contract x 5,000 contracts)
- Bought on the ASK (aggressive — paid full offer price, showing urgency)
- Strike is $9.55 below spot ($604.55) — slightly out of the money (~1.6% OTM)
- Volume of 5,000 vs. Open Interest of 8,000 — that is 62.5% of existing OI hit in one clip
- Order classified as Buy-to-Open (BTO) — this is a new position
- Breakeven at expiration: $595 - $34.26 = $560.74 (QQQ needs to fall 7.2% to profit)
🐋 Trade 2: $555 Put — $14M ($22.55/contract x 6,000 contracts)
- Bought at the MID (still aggressive but slightly more patient execution)
- Strike is $48.85 below spot ($603.85) — deep out of the money (~8.1% OTM)
- Volume of 6,000 vs. Open Interest of 4,400 — that is 136% of existing OI in a single trade
- Order classified as Buy-to-Open (BTO) — this is a new position
- Breakeven at expiration: $555 - $22.55 = $532.45 (QQQ needs to fall 11.8% to profit)
Why two separate puts instead of a spread?
A put spread would cap risk but also cap profit. By buying standalone puts at two different strikes, this trader gets:
- Near-the-money protection via the $595 put that gains value quickly on any selloff
- Deep downside convexity via the $555 put that becomes extremely profitable in a crash scenario
- No capped downside — if QQQ drops to $500, both puts print (the $555 put alone would be worth $55 vs. $22.55 cost)
- September triple witch expiration — 7+ months of runway captures NVIDIA earnings (Feb 25), multiple FOMC meetings, CPI prints, tariff escalation risk, and Q1/Q2 2026 earnings cycles
The math on a 10% correction (QQQ to ~$545):
- $595 put: Worth ~$50, paid $34.26 = $15.74 profit x 5,000 = $7.87M gain
- $555 put: Worth ~$10, paid $22.55 = -$12.55 loss x 6,000 = -$7.53M loss
- Combined: Roughly breakeven at $545 — the real payoff comes in a sharper drop
The math on a 15% correction (QQQ to ~$514):
- $595 put: Worth ~$81, paid $34.26 = $46.74 profit x 5,000 = $23.4M gain
- $555 put: Worth ~$41, paid $22.55 = $18.45 profit x 6,000 = $11.1M gain
- Combined: $34.5M profit on $31M invested — net gain of ~$3.5M + original capital returned
The math on a 20% crash (QQQ to ~$483):
- $595 put: Worth ~$112, paid $34.26 = $77.74 profit x 5,000 = $38.9M gain
- $555 put: Worth ~$72, paid $22.55 = $49.45 profit x 6,000 = $29.7M gain
- Combined: $68.6M profit on $31M invested — a 2.2x return
This is classic institutional portfolio insurance — paying $31M in premium to protect what is likely a multi-billion dollar equity portfolio against a meaningful correction.
📈 Technical Setup / Chart Check-Up
YTD Performance Chart
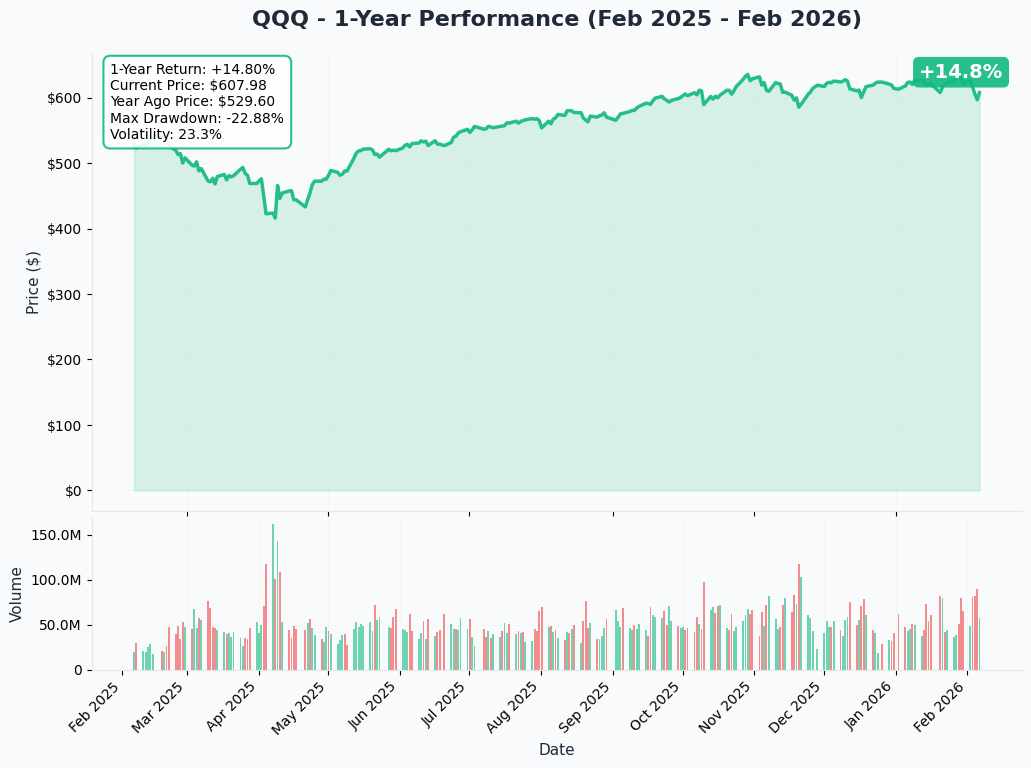
QQQ has had a volatile start to 2026. After peaking near $637 in late October 2025, the ETF has been grinding lower in a broadening wedge pattern. The recent three consecutive down days (including today's session) brought price down to the $604-608 zone, now sitting roughly 5% below all-time highs.
Key observations:
- Range compression: Trading between $580 and $637 since November 2025
- Failed breakout: January rally toward $620+ reversed on earnings volatility
- Amazon capex shock: AMZN's $200B capex guidance (vs. $147B expected) triggered broad tech selling on Feb 5-6
- Volume increasing on down days: Distribution pattern consistent with institutional repositioning
- Put buyer bought near the session lows — suggests they expect further weakness, not a bounce
🔵🟠 Gamma-Based Support & Resistance Analysis
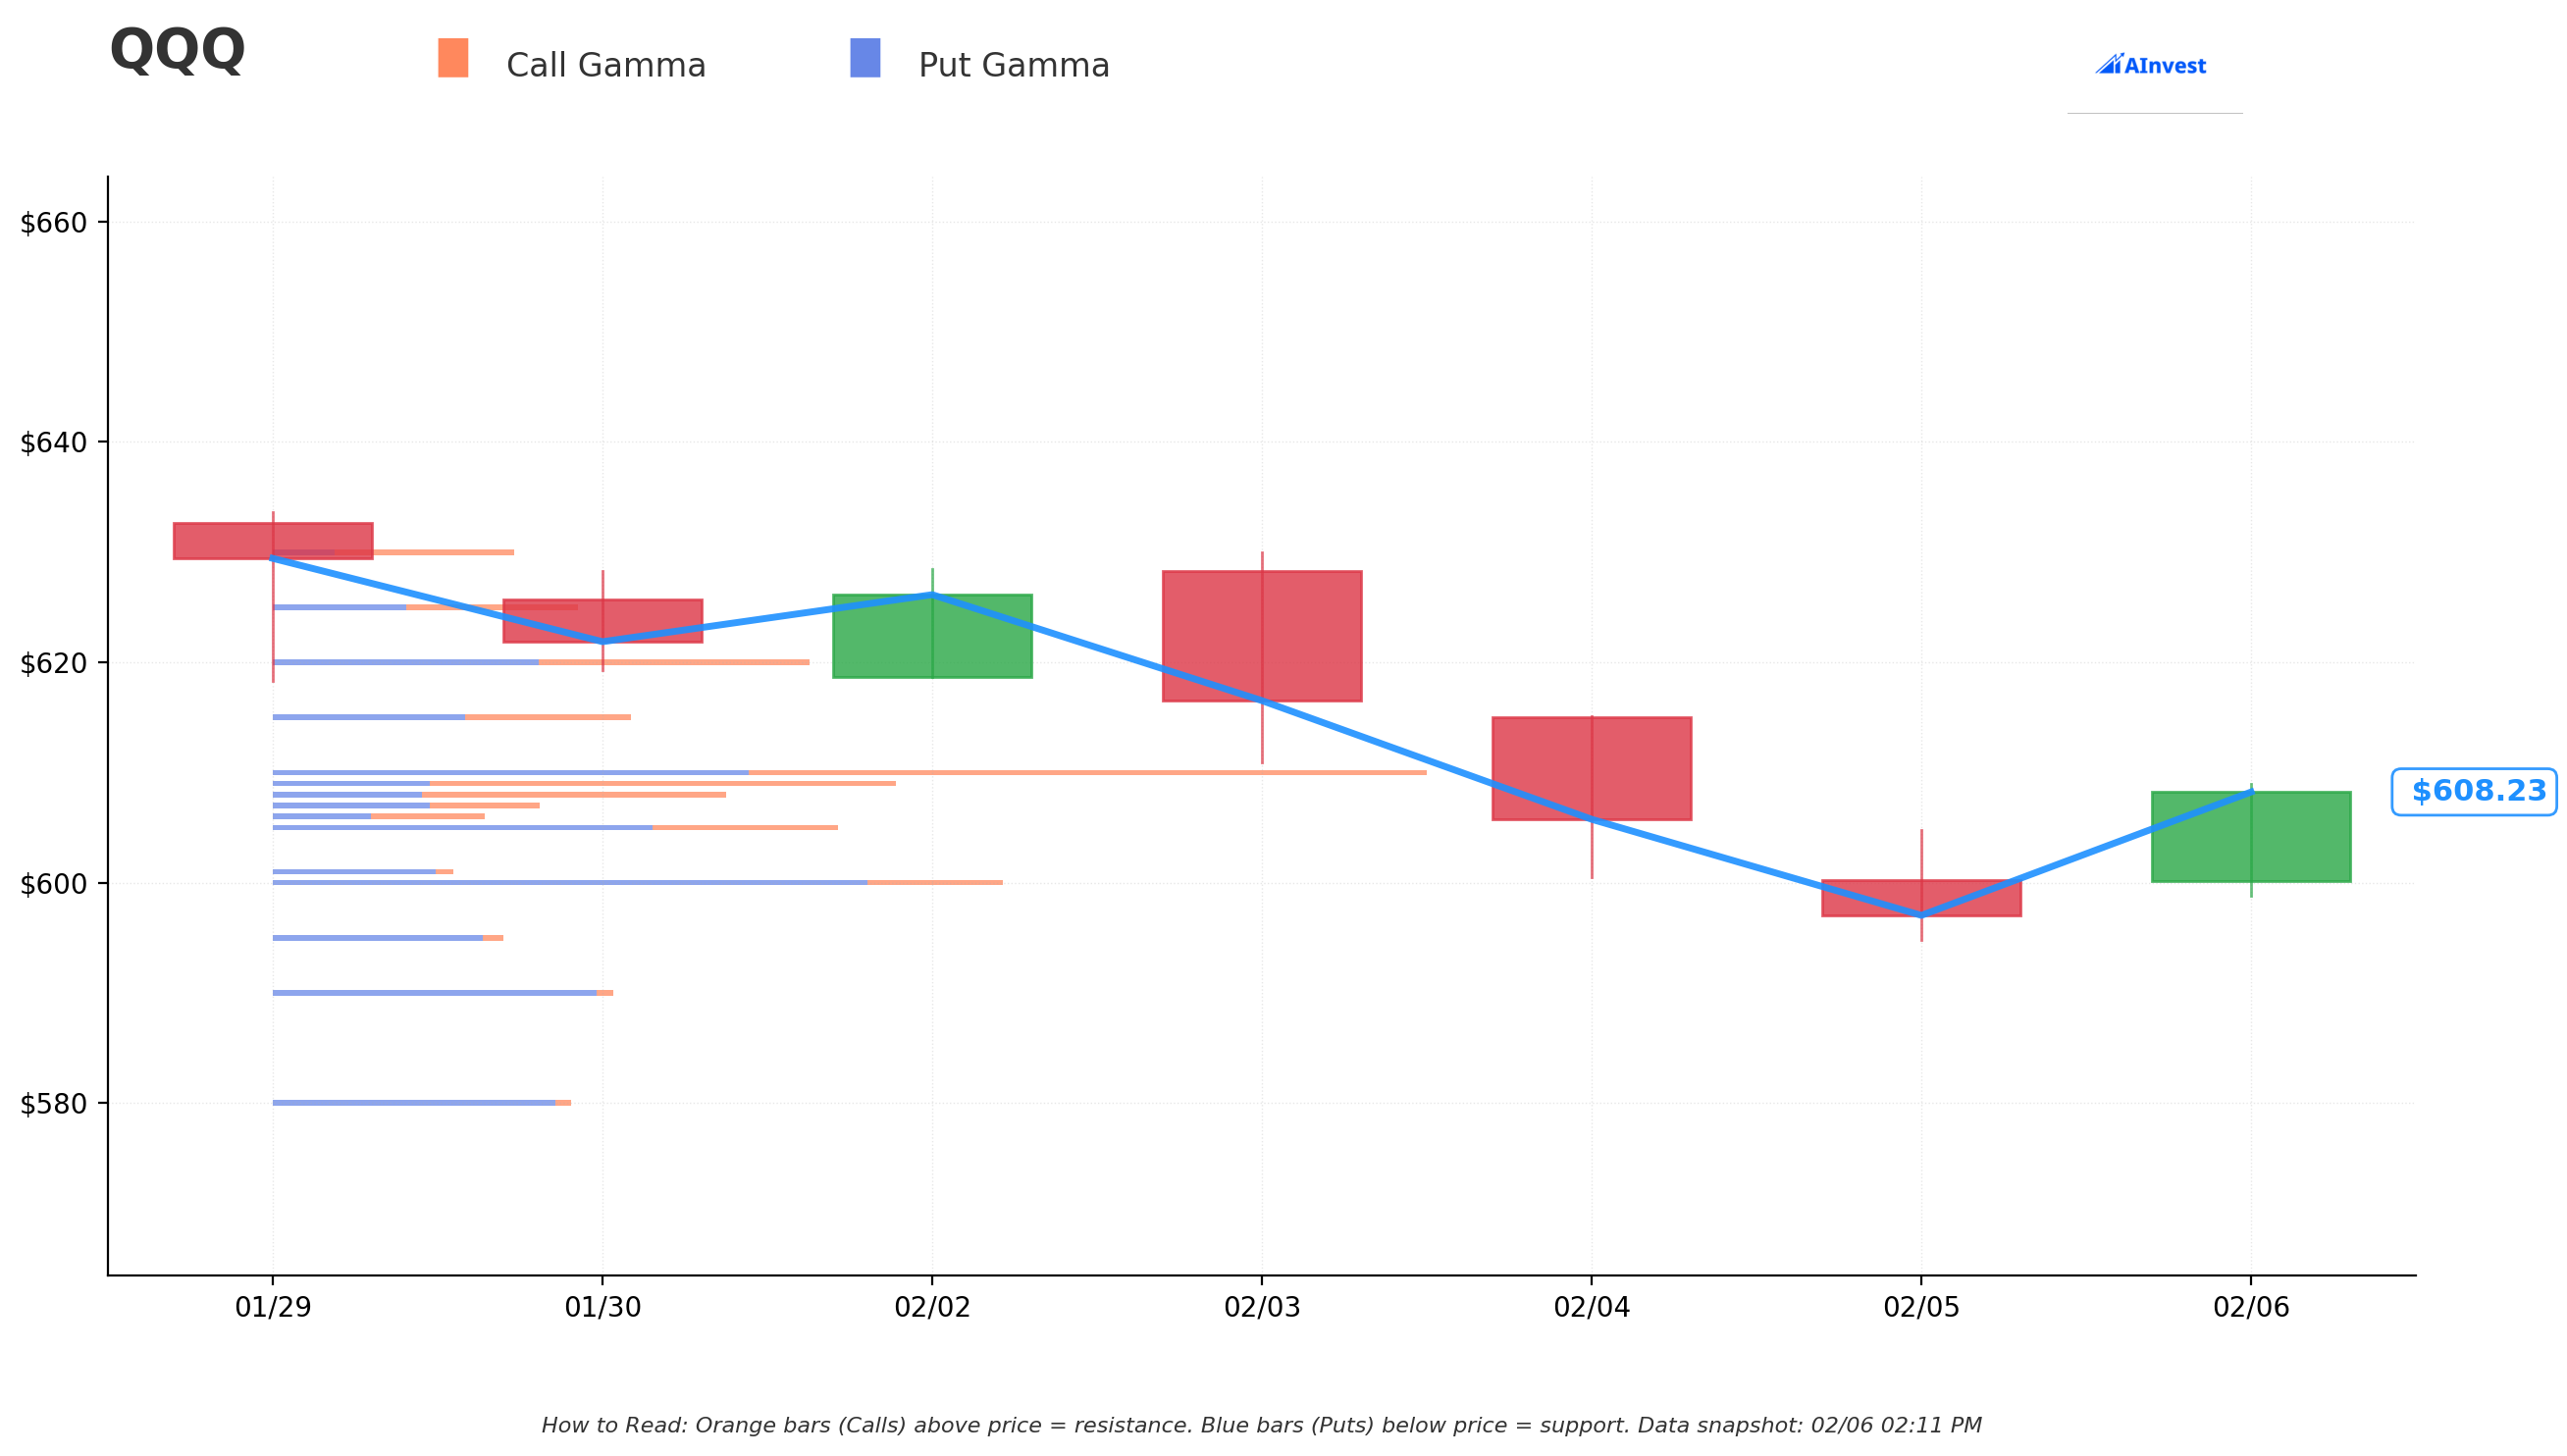
Current Price: $608.12
The gamma exposure (GEX) map reveals where options market maker hedging creates natural price magnets and barriers:
🛡️ Support Levels (Where Dealers Defend):
- $608 — Immediate support, $178.4 total GEX (current price sitting right on it)
- $605 — Secondary support at $228.6 total GEX (0.5% below)
- $600 — STRONGEST SUPPORT at $291.8 total GEX (1.3% below, major psychological level)
- $590 — Deep support at $135.3 GEX (3.0% below)
- $580 — Floor support at $118.7 GEX (4.6% below)
🎯 Resistance Levels (Where Rallies Stall):
- $609 — First resistance at $237.9 total GEX (just above current price)
- $610 — STRONGEST RESISTANCE at $445.9 total GEX (massive dealer wall)
- $615 — Secondary resistance at $141.9 GEX
- $620 — Major resistance at $212.6 GEX
- $625 — Upper resistance at $121.2 GEX
Net GEX Bias: BEARISH (Put GEX 2,239.8 > Call GEX 1,792.9)
What this means: Dealers are net short gamma — when QQQ sells off, they must sell into weakness (hedging their put exposure), which amplifies downside moves. The $610 wall overhead is formidable, and a break below $600 could trigger cascading dealer hedging flows toward $590 and $580. This gamma backdrop validates the put buyer's bearish thesis — the market structure itself is tilted toward downside acceleration.
🔮 Implied Move Analysis
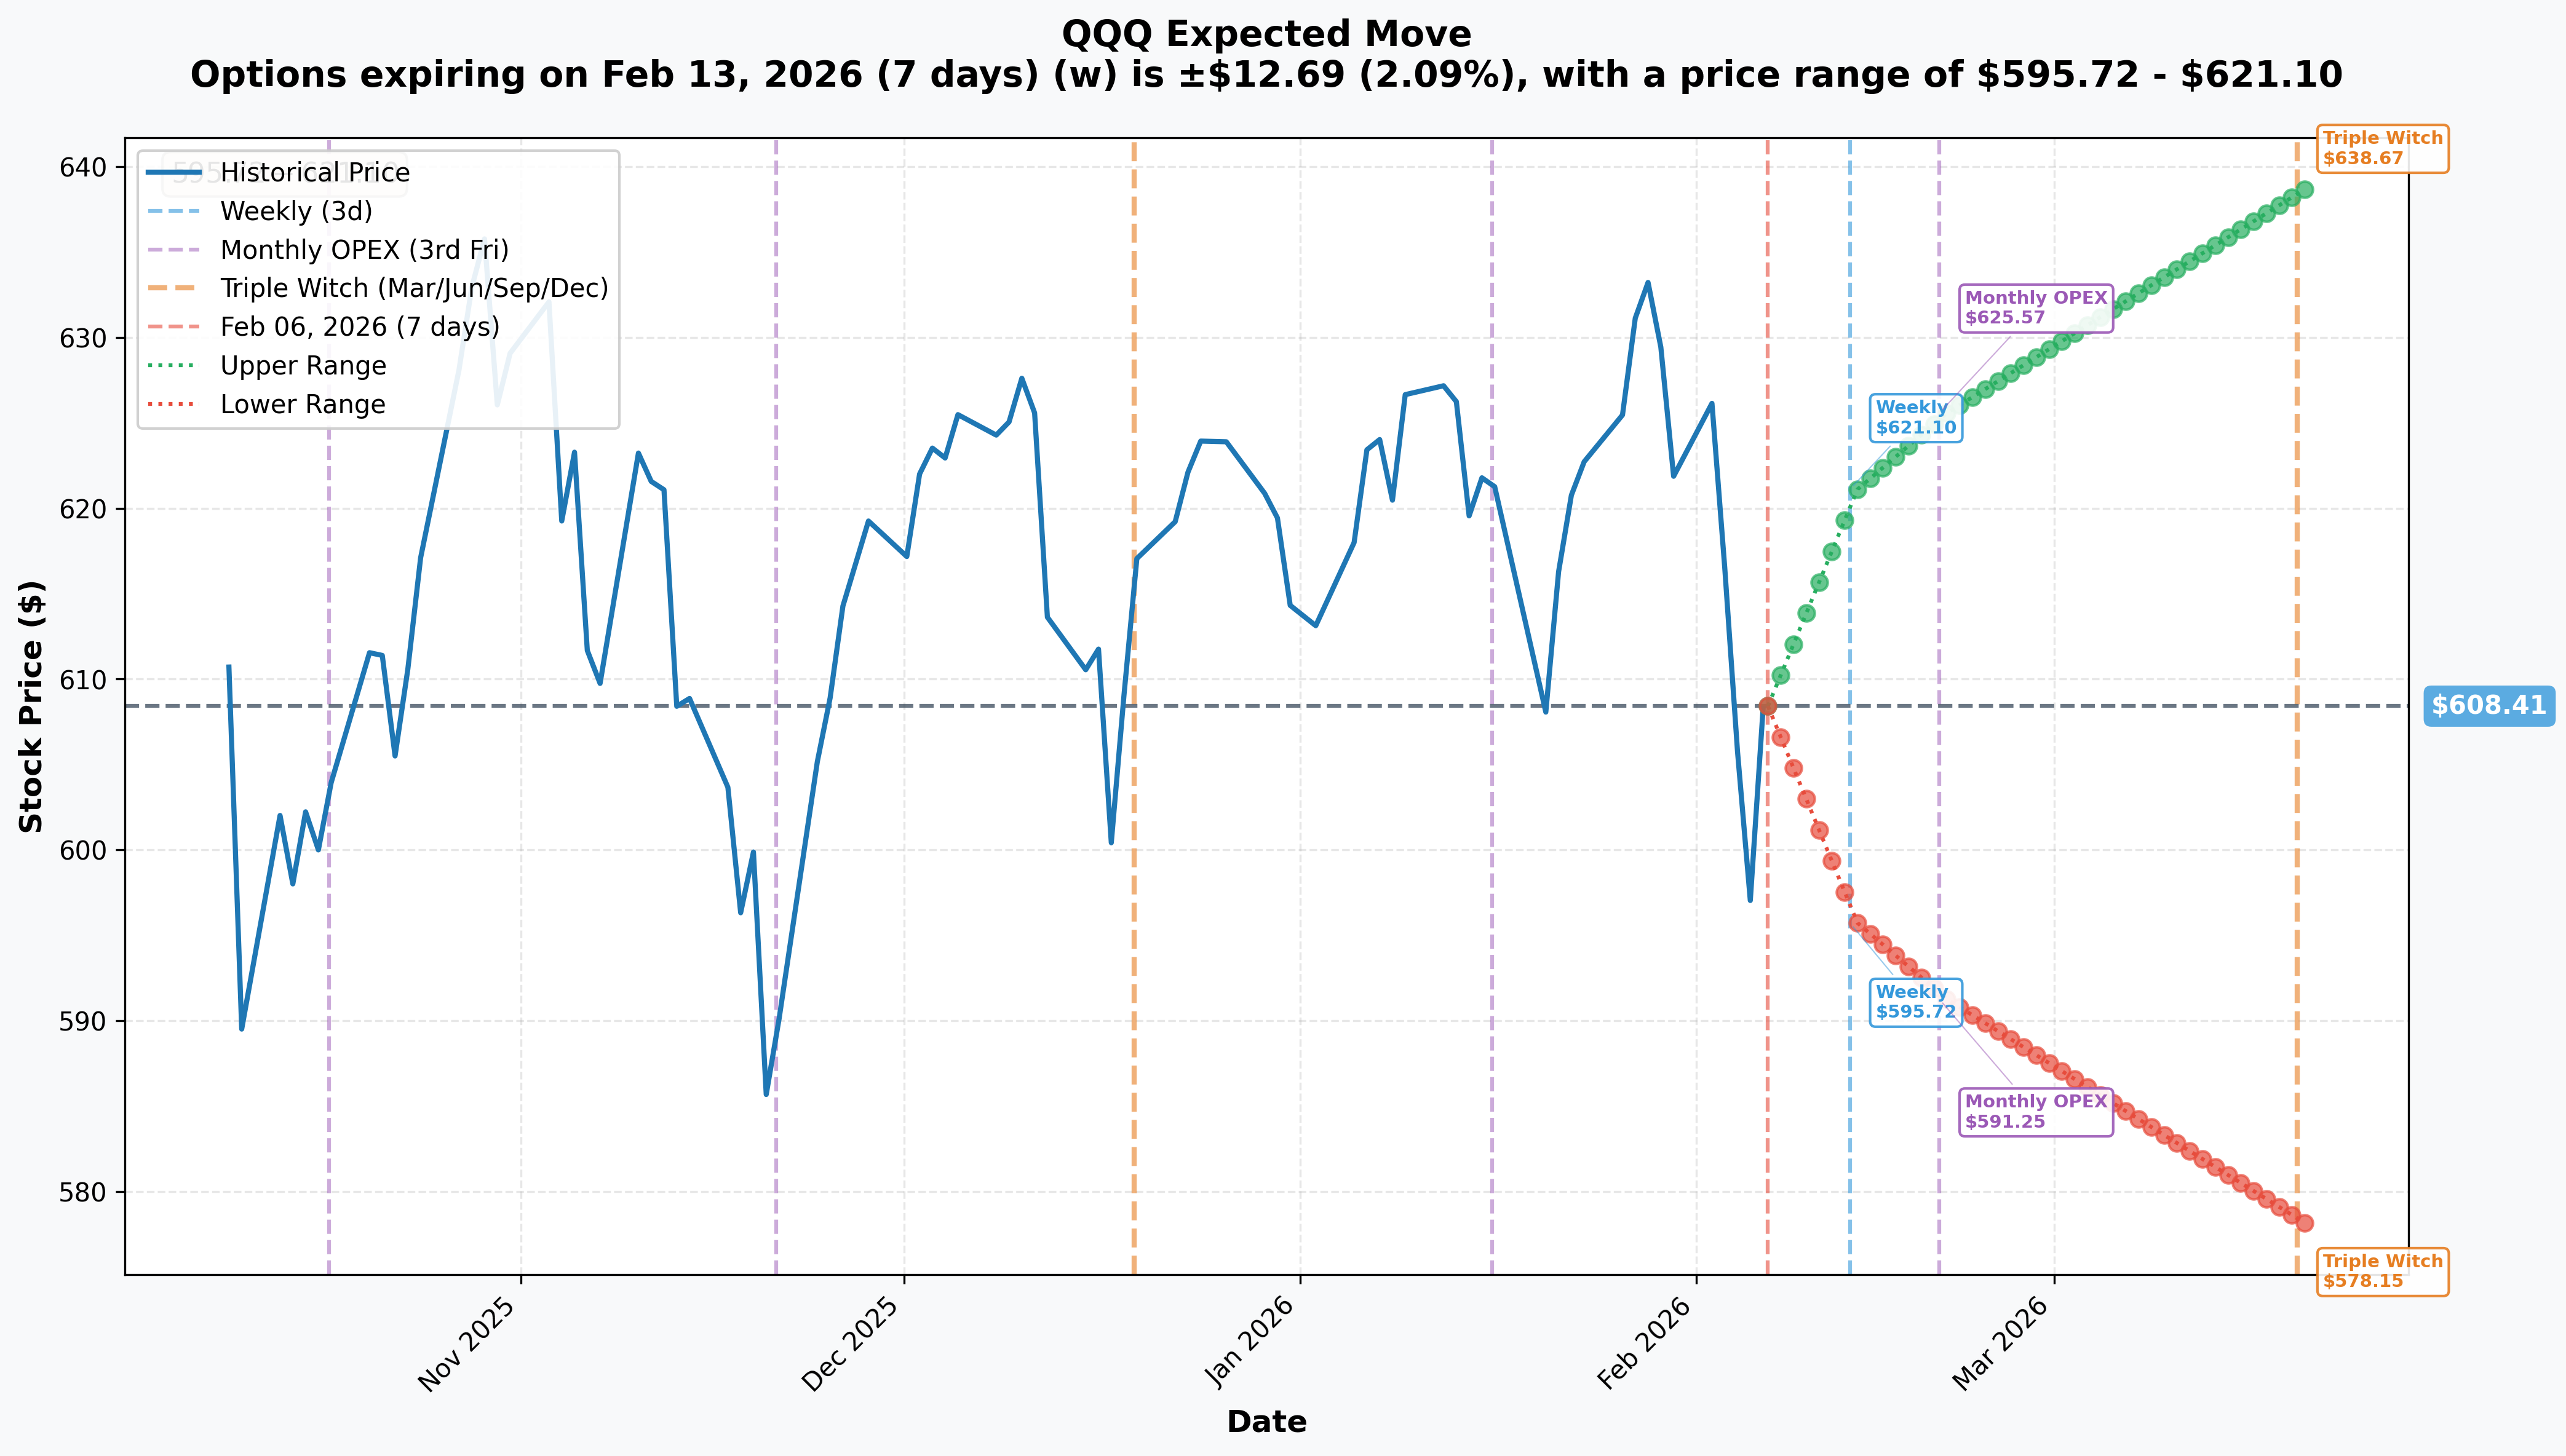
Options market expectations across key timeframes:
| Expiration | Days Out | Implied Move % | Implied Move $ | Upper Range | Lower Range |
|---|---|---|---|---|---|
| Weekly (Feb 13) | 7 | +/-2.09% | +/-$12.69 | $621.10 | $595.72 |
| Monthly OPEX (Feb 20) | 14 | +/-2.82% | +/-$17.16 | $625.57 | $591.25 |
| Triple Witch (Mar 20) | 42 | +/-4.97% | +/-$30.26 | $638.67 | $578.15 |
What this tells us about the put trades:
The $595 put strike sits right at the weekly implied move lower bound ($595.72) — meaning options markets are already pricing a scenario where QQQ touches $595 within the next week. The put buyer is not making an outlandish bet on the near-the-money leg.
The $555 put strike is well below the quarterly implied range ($578.15 lower bound) — this is where the trade transitions from hedge to crash insurance. For QQQ to reach $555 by September, it would need a ~8.7% decline from current levels — meaningful but far from unprecedented, especially given the concentration of risk events ahead.
Key insight: The September 18 expiration date is the quarterly triple witch for Q3 2026, which often produces elevated volatility and forced repositioning. The trader picked this date intentionally — maximum liquidity, maximum event coverage, and historically volatile price action at expiration.
⚡ Catalysts
✅ Already Happened (Setting the Stage)
NVIDIA Q3 FY2026 (November 19, 2025)
- Revenue: $57B (+62% YoY), beating $55.2B consensus
- Q4 guidance of ~$65B set extremely high expectations for February 25 report
- Blackwell ramp "off the charts" per Jensen Huang — but can Q4 deliver?
Apple Q1 FY2026 (January 29, 2026)
- Revenue: $143.8B record (+16% YoY), iPhone revenue $85.3B (+23% YoY)
- Strong result but stock has given back post-earnings gains amid broader tech weakness
Microsoft Q2 FY2026 (January 28, 2026)
- Revenue: $81.3B, Azure +39% — slight deceleration from prior quarter's +40%
- Shares fell 7% post-earnings on margin compression and Azure growth concerns
- Gross margin at 3-year narrowest due to AI infrastructure investment
Meta Q4 2025 (January 28, 2026)
- Revenue: $59.89B (+24% YoY), EPS beat by 8.4%
- 2026 capex guidance of $115-135B (nearly double 2025) spooked investors
Alphabet Q4 2025 (February 4, 2026)
- Revenue: $113.8B (+18% YoY), Google Cloud $17.7B (+48% YoY)
- 2026 capex guidance: $175-185B — adding fuel to AI spending concern fire
Amazon Q4 2025 (February 5, 2026)
- Revenue: $213.39B beat, but EPS of $1.95 missed $1.97 estimate
- 2026 capex guidance: $200B vs. $146.6B analyst expectation — a $53B upside shock
- Shares plunged ~8% on the capex bomb — this is likely the catalyst for today's put buying
Big Tech AI Capex Aggregate: $650B+
- Combined 2026 spending commitment across Alphabet, Amazon, Meta, Microsoft now exceeds $650 billion
- Capex consuming 94% of operating cash flows — highest ratio in modern tech history
- 95% of GenAI pilot programs fail to achieve business value per Goldman Sachs research
Trump 25% Semiconductor Tariff (January 14, 2026)
- 25% revenue-sharing tariff on advanced AI chips targeting NVIDIA and AMD products
- China-bound volumes capped at 50% of U.S. sales
- Creates direct margin headwind for QQQ's largest holding (NVDA at 8.46%)
Federal Reserve (January 28, 2026)
- Fed held rates at 3.50-3.75%, pausing after three consecutive 2025 cuts
- No cuts expected until June 2026 at earliest — higher-for-longer weighs on growth multiples
Sector Rotation Accelerating
- Institutional rotation from tech into materials, utilities, and healthcare gaining momentum
- QQQ has underperformed S&P 500 over the past 3 months as money flows shift
📅 Upcoming Catalysts (Through September 18 Expiration)
January 2026 CPI Release — February 11, 2026 🚨
- Core CPI forecast potentially reaching 3% by Q2 2026 as tariff passthrough materializes
- Hot print could push rate cut expectations further out, pressuring tech valuations
- Just 5 trading days away — first major macro data point for the put trades
NVIDIA Q4 FY2026 Earnings — February 25, 2026 🚨🚨🚨
- Consensus: $65.6B revenue, $1.44 EPS
- As QQQ's largest holding at 8.46%, this is the single highest-impact event
- Any miss or weak guidance could trigger 5-8% QQQ drawdown given current sentiment
- The put buyer has positioned BEFORE this binary event — deliberate timing
Broadcom Q1 FY2026 Earnings — March 4, 2026
- Revenue guidance ~$19.1B, AI semiconductor revenue expected to double YoY
- Second-largest custom AI chip maker — results validate or challenge capex thesis
NVIDIA GTC 2026 — March 16-19, 2026
- Jensen Huang keynote March 16 at SAP Center, San Jose
- Expected: Vera Rubin architecture details, Feynman roadmap, agentic AI announcements
- Historically moves NVDA 3-5% with spillover across tech
FOMC Meetings (March 17-18, May 5-6, June 16-17)
- March and June meetings include updated dot plots and economic projections
- Market expects first potential rate cut no earlier than June 2026
- Each meeting is a potential volatility catalyst — the put buyer's September expiry captures all three
Google Cloud Next — April 22-24, 2026
- Major cloud and AI product launch event in Las Vegas
- Alphabet's combined 7.38% QQQ weight (GOOGL + GOOG) makes this meaningful
Apple WWDC 2026 — June 8-12, 2026
- iOS 27 reveal, LLM-powered Siri upgrade, iPhone Fold preview expected
- Apple at 7.69% QQQ weight — WWDC execution matters
Q1 2026 Earnings Season — April/May 2026
- All Magnificent Seven report Q1 results within a 2-week window
- First quarter where full impact of $650B capex commitment hits margins
- If margin compression broadens beyond MSFT, could trigger sector-wide de-rating
Valuation Overhang
- Tech sector forward P/E at 36.01x — above the 5-year range of 27.6x-35.6x
- S&P 500 at 22x forward P/E, matching 2021 peak
- A P/E compression from 36x to 30x on tech alone would represent a ~17% drawdown — which would put QQQ squarely at the $555 put strike
🎯 Price Targets & Probabilities (Through September 18, 2026)
🟢 Bull Case (25% probability) — QQQ $650-$680
How we get there:
- NVIDIA crushes February 25 earnings with $67B+ revenue and strong Blackwell guidance
- Fed signals rate cuts beginning June 2026 (dovish pivot)
- AI capex starts showing revenue returns — enterprise AI adoption inflects
- Tariff tensions ease or get delayed/reduced
- Rotation back into tech as growth outperforms
What happens to the put trades: Both expire worthless. Trader loses full $31M premium — the cost of insurance they did not need.
🟡 Base Case (45% probability) — QQQ $570-$620
Most likely scenario:
- NVIDIA delivers in-line (not spectacular) with $65B guidance, guidance for $68-70B Q1
- Market digests $650B capex commitment — rotation continues at moderate pace
- Fed holds through June, cuts 1-2x in H2 2026
- QQQ oscillates in a wide range, consolidating 2025 gains
- Periodic 3-5% drawdowns followed by partial recoveries
What happens to the put trades: The $595 put has value if QQQ dips below $595 at any point (likely during vol spikes). Trader may monetize this leg through the cycle. The $555 put likely expires with minimal value. Net outcome: partial loss of $15-25M depending on execution.
🔴 Bear Case (30% probability) — QQQ $520-$570
What could trigger this:
- NVIDIA disappoints on February 25 — Blackwell delays, China revenue hit from tariffs, weak Q1 guidance
- CPI prints hot (3%+), Fed forced to hold or hint at hikes — growth stock multiple compression
- AI capex ROI questioned — enterprise adoption slower than expected, margin compression spreads
- Trump escalates tariffs beyond semiconductors — full trade war scenario
- Sector rotation accelerates into defensives, institutional selling becomes persistent
- Break below $580 gamma support triggers cascading dealer hedging toward $560, then $540
What happens to the put trades: Both puts are deep in the money. At $545, the combined position is worth ~$45M+ on a $31M investment. At $520, the position could be worth $60M+ (nearly 2x return). This is the scenario the trader is preparing for.
Why 30% probability is justified: The convergence of risks is unusually dense: NVIDIA earnings uncertainty, unprecedented capex spending with unproven ROI, stretched valuations above historical ranges, tariff escalation risk, Fed policy uncertainty, and accelerating sector rotation. Any two of these catalysts firing simultaneously could trigger a 10-15% correction.
💡 Trading Ideas
🟢 Conservative: Buy QQQ Protective Puts
Play: Mirror the institutional positioning at a smaller scale — buy downside protection on existing QQQ holdings
Structure: Buy 1 QQQ June 2026 $580 put per 100 shares owned (~$14-16 per contract)
Why this works:
- Follows the institutional signal — $31M in put buying is not noise
- June expiration captures NVIDIA earnings, CPI, FOMC March/May meetings, and Q1 earnings season
- $580 strike aligns with major gamma support — if it breaks, the protection pays off
- Cost of ~2.5% of portfolio value for 4 months of insurance is reasonable in this environment
Risk/Reward:
- Max cost: ~$14-16 per contract (premium paid) if QQQ stays above $580
- Breakeven: ~$564-566
- Protection kicks in hard below $570 — every $1 decline = $1 profit per contract
Risk level: Low | Skill level: Beginner-friendly
🟡 Balanced: Put Debit Spread Targeting March Weakness
Play: Position for a pullback through March triple witch using a defined-risk put spread
Structure: Buy March 20, 2026 $600 put / Sell March 20, 2026 $580 put
Why this works:
- $600 strike is the strongest gamma support level — a break below triggers acceleration
- $580 short put captures premium and defines max risk at $20 wide spread
- March triple witch captures NVIDIA earnings (Feb 25), CPI (Feb 11), Broadcom (Mar 4), and FOMC (Mar 17-18)
- Implied move analysis shows $578.15 as the quarterly lower bound — the spread targets this zone
Estimated P&L:
- Net debit: ~$5.50-6.50 per spread ($550-650 per contract)
- Max profit: $13.50-14.50 per spread at $580 or below ($1,350-1,450 per contract)
- Max loss: Premium paid ($550-650 per contract)
- Risk/Reward: ~2.2:1
- Breakeven: ~$593.50-594.50
Position sizing: Allocate no more than 3-5% of portfolio to this trade
Risk level: Moderate | Skill level: Intermediate
🔴 Aggressive: Long September $570 Puts
Play: Buy longer-dated OTM puts to capture potential multi-month correction with convexity
Structure: Buy September 18, 2026 $570 puts (~$18-20 per contract)
Why this works:
- Same expiration as the institutional trades — aligns with smart money timing
- $570 strike is between the two institutional strikes ($595 and $555) — balanced entry point
- 7+ months of time captures every major catalyst through summer 2026
- If QQQ has a 10-15% correction, these puts could return 3-5x
- Convexity means modest additional declines produce outsized returns once in the money
Estimated P&L:
- Cost: ~$18-20 per contract ($1,800-2,000 per contract)
- At QQQ $550: Put worth ~$20 = roughly breakeven
- At QQQ $530: Put worth ~$40 = 2x return
- At QQQ $510: Put worth ~$60 = 3x return
- Max loss: Premium paid if QQQ stays above $570
Key risk: 7 months of theta decay works against you every day QQQ stays above $570. If the correction does not materialize by August, time decay accelerates and the position bleeds.
Risk level: High | Skill level: Advanced
⚠️ Risk Factors
Do not ignore these potential landmines:
-
NVIDIA earnings is a binary event in 19 days: As QQQ's largest holding at 8.46%, NVIDIA's February 25 report could swing the ETF 3-5% in either direction. Expectations are extreme — $65.6B consensus revenue and $1.44 EPS. A beat could invalidate the bearish thesis and cause rapid put decay.
-
AI capex could start paying off: The bearish case relies partly on AI spending producing no ROI. But if enterprise AI adoption accelerates and hyperscaler cloud revenue growth re-accelerates in Q1 2026 earnings, the narrative shifts from "spending too much" to "investing for dominance." This would be a headwind for put positions.
-
Fed could turn dovish sooner than expected: If CPI on February 11 comes in cool or the labor market softens, the Fed could signal earlier rate cuts. Lower rates are a direct tailwind for growth/tech multiples and would push QQQ higher.
-
These puts could simply be hedges, not directional bets: A portfolio manager with $5B+ in tech exposure spending $31M on puts (0.6% of portfolio) is buying insurance, not making a prediction. The trade does not necessarily mean QQQ will fall — it means someone wants protection in case it does.
-
Concentration risk cuts both ways: QQQ's top 3 holdings (>22% of index) mean a single strong NVIDIA report could drag the entire ETF higher, overwhelming broader market weakness.
-
Sector rotation could reverse: Defensive sectors have outperformed recently, but this rotation has historically been temporary. A return to risk-on sentiment would pressure put positions.
-
Elevated tech valuations (36x forward P/E) require a catalyst to compress: Valuations can stay "expensive" for extended periods. Without a clear negative catalyst, puts decay while waiting. The September expiration gives time but does not guarantee a correction arrives.
-
Tariff uncertainty is a two-way risk: While the 25% semiconductor tariff creates headwinds, any resolution or exemption would remove an overhang and spark a rally. Trade policy shifts can be sudden and unpredictable.
📝 The Bottom Line
Here is the story: Within two minutes, someone committed $31 million to downside protection on the Nasdaq-100 — buying two standalone puts at different strikes, both targeting the September triple witch expiration. The $595 put ($17M) provides near-the-money protection that gains value on any modest pullback. The $555 put ($14M) is crash insurance that pays off in a severe downturn. Together, they form a layered defense structure that a portfolio manager would build to protect a large equity book.
What this trade tells us:
- Institutional money is concerned about downside risk over the next 7 months
- The timing — immediately after Amazon's $200B capex shock — suggests AI spending fatigue is the primary worry
- Two separate strikes (not a spread) means they want both quick protection AND tail-risk coverage
- September triple witch expiration captures every major risk event on the calendar
- $31M is serious money but manageable as portfolio insurance on a multi-billion dollar book
Context matters: This is happening against a backdrop of NVIDIA earnings in 19 days, $650B+ in Big Tech AI capex with questioned ROI, tech sector valuations at 5-year highs, a Fed on hold, and accelerating sector rotation out of tech. The gamma profile is bearish (put GEX $2,240 > call GEX $1,793), and the $610 resistance wall overhead limits near-term upside.
This is NOT a "sell everything" signal — but it is a clear signal that smart money is paying up for protection. When someone spends $31M on puts on the ASK side within minutes of market open, they are acting with conviction and urgency.
If you own QQQ or heavy tech exposure:
- Consider adding downside hedges — this institutional signal should not be ignored
- The $595-600 zone is the line in the sand — a sustained break below triggers acceleration
- February 25 NVIDIA earnings is the next inflection point — position accordingly
- If you do nothing else, tighten stops and reduce position sizes into the event
If you are bearish:
- The September expiration gives maximum runway to capture multiple catalysts
- Consider put spreads to reduce premium cost while maintaining directional exposure
- $580 and $555 are the gamma levels where downside momentum accelerates
- Size conservatively — corrections are hard to time even when the setup looks compelling
Key dates to watch:
- February 11 — January CPI release
- February 25 — NVIDIA Q4 FY2026 earnings (the big one)
- March 4 — Broadcom Q1 FY2026 earnings
- March 16-19 — NVIDIA GTC 2026
- March 17-18 — FOMC meeting + updated dot plot
- April 22-24 — Google Cloud Next 2026
- June 8-12 — Apple WWDC 2026
- September 18 — These puts expire (Q3 triple witch)
Final take: QQQ's fundamentals are not broken — these are dominant companies with real cash flows and real products. But $31M in institutional put buying, a bearish gamma profile, stretched valuations, and a wall of upcoming risk events all point to the same conclusion: the risk-reward for being long tech without hedges is asymmetric to the downside right now. Respect the signal. Manage your risk. Let the catalysts play out.
Disclaimer: Options trading involves substantial risk of loss and is not suitable for all investors. This analysis is for educational purposes only and does not constitute financial advice. Past performance does not guarantee future results. The put purchases analyzed here may represent hedging activity on a larger portfolio, not a directional prediction. Buying out-of-the-money puts has a high probability of expiring worthless — over 80% of OTM options expire with no value. Always do your own research, understand the risks, and consider consulting a licensed financial advisor before trading options. Never risk more than you can afford to lose.
About Invesco QQQ Trust: The Invesco QQQ Trust tracks the Nasdaq-100 Index, providing exposure to 100 of the largest non-financial companies on the Nasdaq exchange. With ~$411.78 billion in AUM and holdings concentrated in technology leaders like NVIDIA, Apple, Microsoft, Amazon, and Meta, QQQ serves as a bellwether for U.S. tech sector performance, AI infrastructure investment, and innovation-driven growth.