🛡️ QQQ $18M Put Hedge Signals Big Money Bracing for Volatility!
📅 February 9, 2026 | 🔥 Unusual Activity Detected
🎯 The Quick Take
Someone just dropped $18 MILLION on a massive bearish hedge in QQQ - the Nasdaq-100 ETF that holds the Magnificent Seven! This isn't a small retail trader getting nervous - this is institutional-level protection ahead of a catalyst-packed month including NVIDIA earnings (Feb 25) and CPI data (Feb 13). With net gamma exposure flipping bearish and $285 billion already wiped from tech stocks after the Anthropic Claude Cowork selloff, someone's betting big that the volatility isn't over yet.
📊 ETF Overview
QQQ (Invesco QQQ Trust) tracks the Nasdaq-100 Index - the 100 largest non-financial companies listed on Nasdaq. This is THE tech-heavy ETF that moves with the Magnificent Seven.
| Metric | Value |
|---|---|
| Current Price | $616.04 |
| AUM | ~$400B |
| Expense Ratio | 0.18% |
| Index | Nasdaq-100 |
| Day Range (Feb 6) | $605.07 - $616.19 |
| 5-Day Net Flows | -$1.91B (outflows) |
🏆 Top 10 Holdings
| Rank | Company | Ticker | Weight |
|---|---|---|---|
| 1 | NVIDIA | NVDA | 8.32% |
| 2 | Apple | AAPL | 8.02% |
| 3 | Microsoft | MSFT | 5.83% |
| 4 | Amazon | AMZN | 4.74% |
| 5 | Meta Platforms | META | 3.92% |
| 6 | Broadcom | AVGO | ~4.5% |
| 7 | Alphabet | GOOGL | ~3.5% |
| 8 | Tesla | TSLA | ~3.0% |
| 9 | Costco | COST | ~2.5% |
| 10 | Netflix | NFLX | ~2.0% |
Concentration Note: Top 5 holdings = ~30% of QQQ. The Magnificent Seven collectively account for 35-40% of the ETF's market cap. When these giants sneeze, QQQ catches a cold.
💰 The Option Flow Breakdown
📊 What Just Happened
| Date | Time | Side | Type | Expiration | Strike | Volume | OI | Premium | Spot | Option Price |
|---|---|---|---|---|---|---|---|---|---|---|
| 2026-02-09 | 10:15:57 | BUY | PUT | 2026-09-18 | $600 | 5,500 | 27,000 | $18,000,000 | $611.61 | $32.40 |
🤓 What This Actually Means
Let me break this down for you:
🐋 Whale Alert! Someone bought 5,500 put contracts at a single strike - that's protection on 550,000 shares of QQQ worth ~$339M notional.
📉 This is a Long Put (BTO) - a classic bearish hedge. The trader is paying $32.40 per contract ($18M total premium) for the right to sell QQQ at $600 through September 2026.
🎯 Strike Selection Matters: The $600 strike is ~1.9% below current price - deep enough to filter out normal chop, but close enough to pay out on any serious correction.
⏰ Time Horizon: September 2026 expiration (221 days out) - this is NOT a short-term gamble. This is someone positioning for multi-month downside protection through summer.
Translation for us regular folks: Big money just bought an $18M insurance policy against a QQQ crash. They're willing to burn that premium if QQQ rallies - that's how worried they are about downside risk.
📈 Technical Setup / Chart Check-Up
YTD Performance
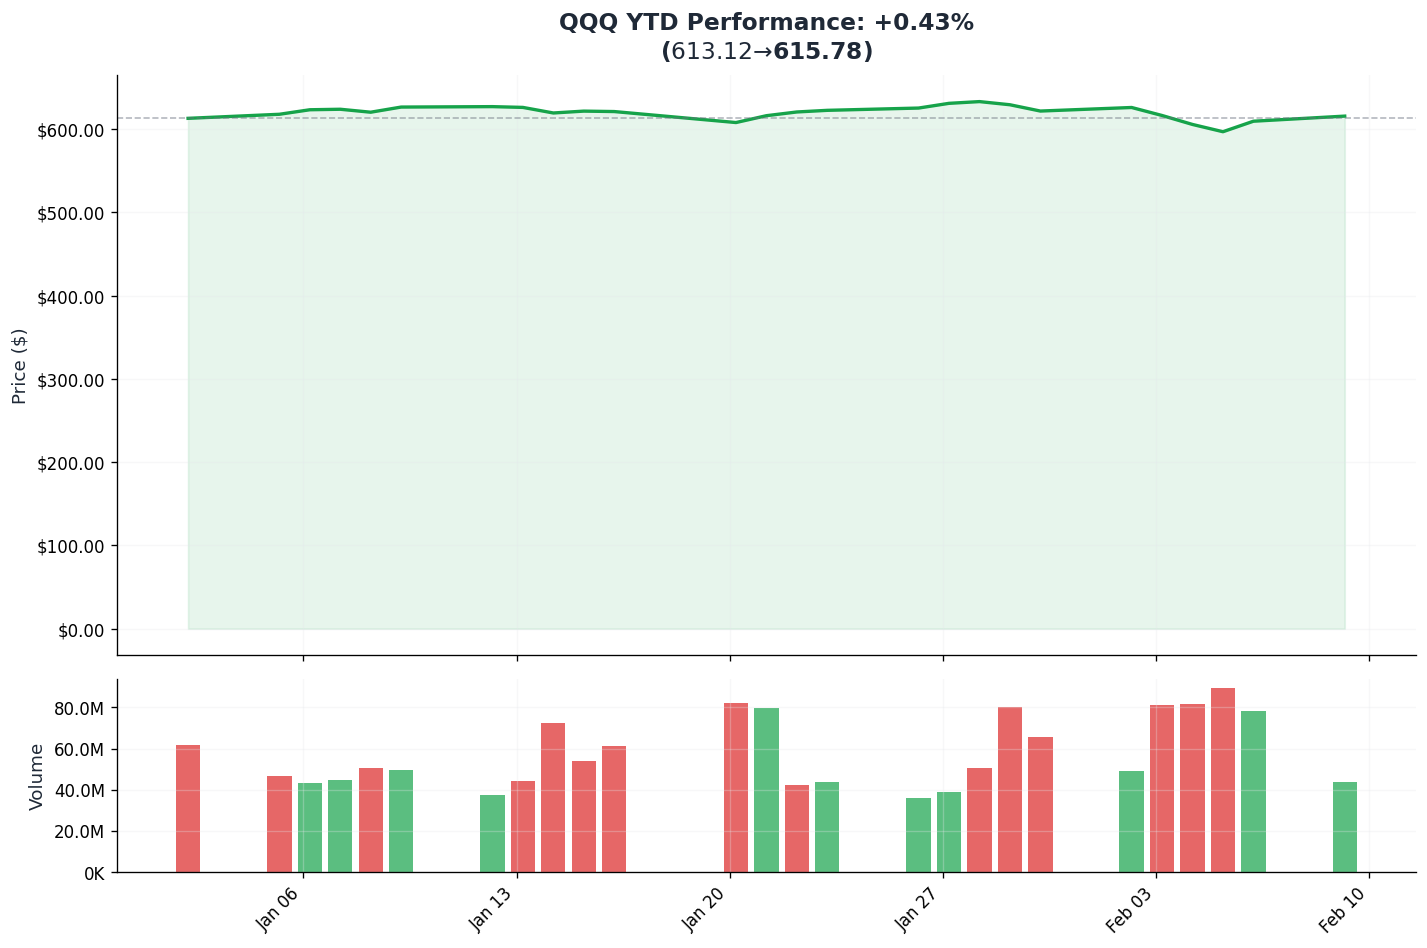
QQQ has been on a roller coaster in 2026! After hitting highs near $650 in December 2025, the ETF pulled back to test $600 support multiple times. The recent Claude Cowork selloff triggered a -1.38% weekly decline, and we're now hovering just above $616 - recovering but still below the December highs.
A buy signal was issued from a pivot bottom point on February 5, 2026 - price holding above $600 favors continuation, but that put buyer clearly isn't convinced.
🔵🟠 Gamma-Based Support & Resistance Analysis
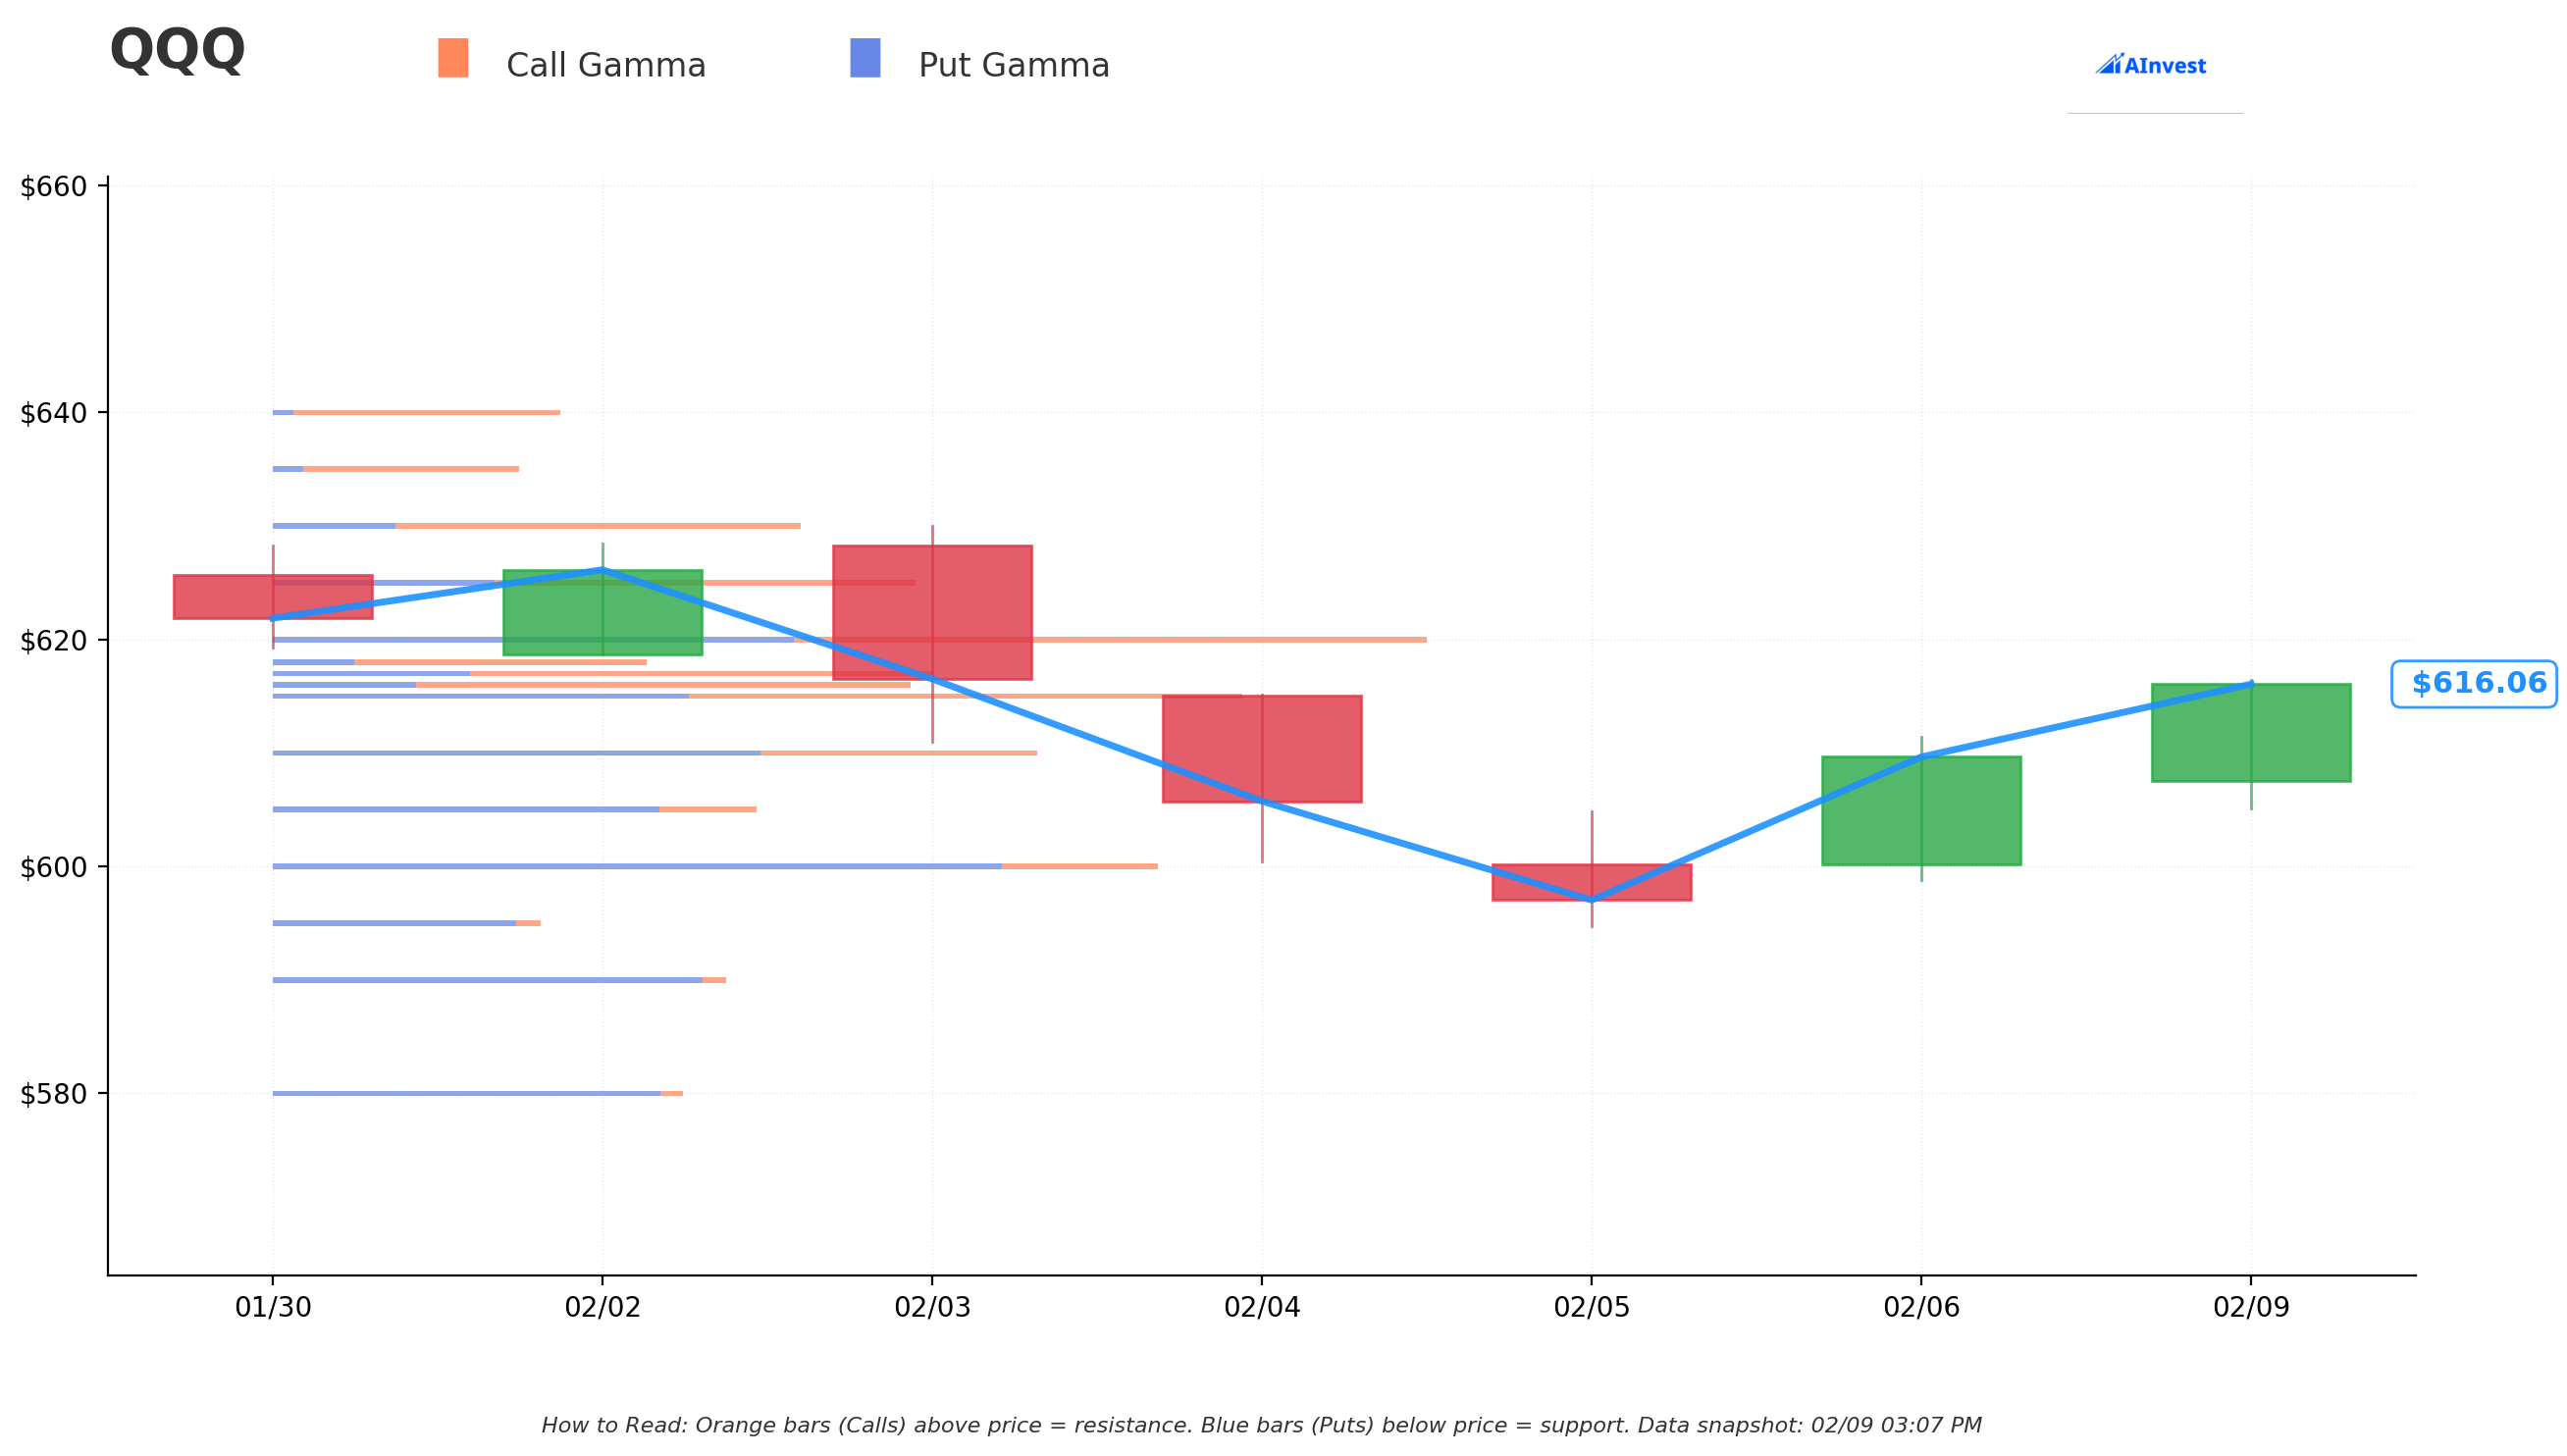
Based on dealer gamma positioning, here's where the action is:
🔵 Key Support Levels (Put Gamma = Blue Bars)
| Strike | Net GEX | Distance | Strength |
|---|---|---|---|
| $616 | 87.5 | 0.0% | Strong Support |
| $615 | 34.8 | 0.2% | Moderate Support |
| $610 | -46.9 | 1.0% | Weak (Negative GEX) |
| $605 | -69.1 | 1.8% | Weak (Negative GEX) |
| $600 | -139.5 | 2.6% | Major Put Wall - Target Strike! |
| $590 | -98.8 | 4.2% | Secondary Support |
🟠 Key Resistance Levels (Call Gamma = Orange Bars)
| Strike | Net GEX | Distance | Strength |
|---|---|---|---|
| $617 | 61.9 | 0.2% | First Resistance |
| $620 | 27.7 | 0.6% | Moderate Resistance |
| $625 | 48.2 | 1.5% | Strong Resistance |
| $630 | 68.2 | 2.3% | Major Resistance Wall |
What This Means:
- 📍 Current Price: $616.04 - sitting right at the strongest support level
- ⚠️ Net GEX Bias: BEARISH - Total Put GEX (1,742) > Total Call GEX (1,733)
- 🧲 Magnetic Zone: Price trapped between $615-$617 with heavy gamma on both sides
- 📉 Breakdown Target: If $615 fails, the next major gamma wall is $600 - exactly where that $18M put is struck!
📊 Implied Move Analysis
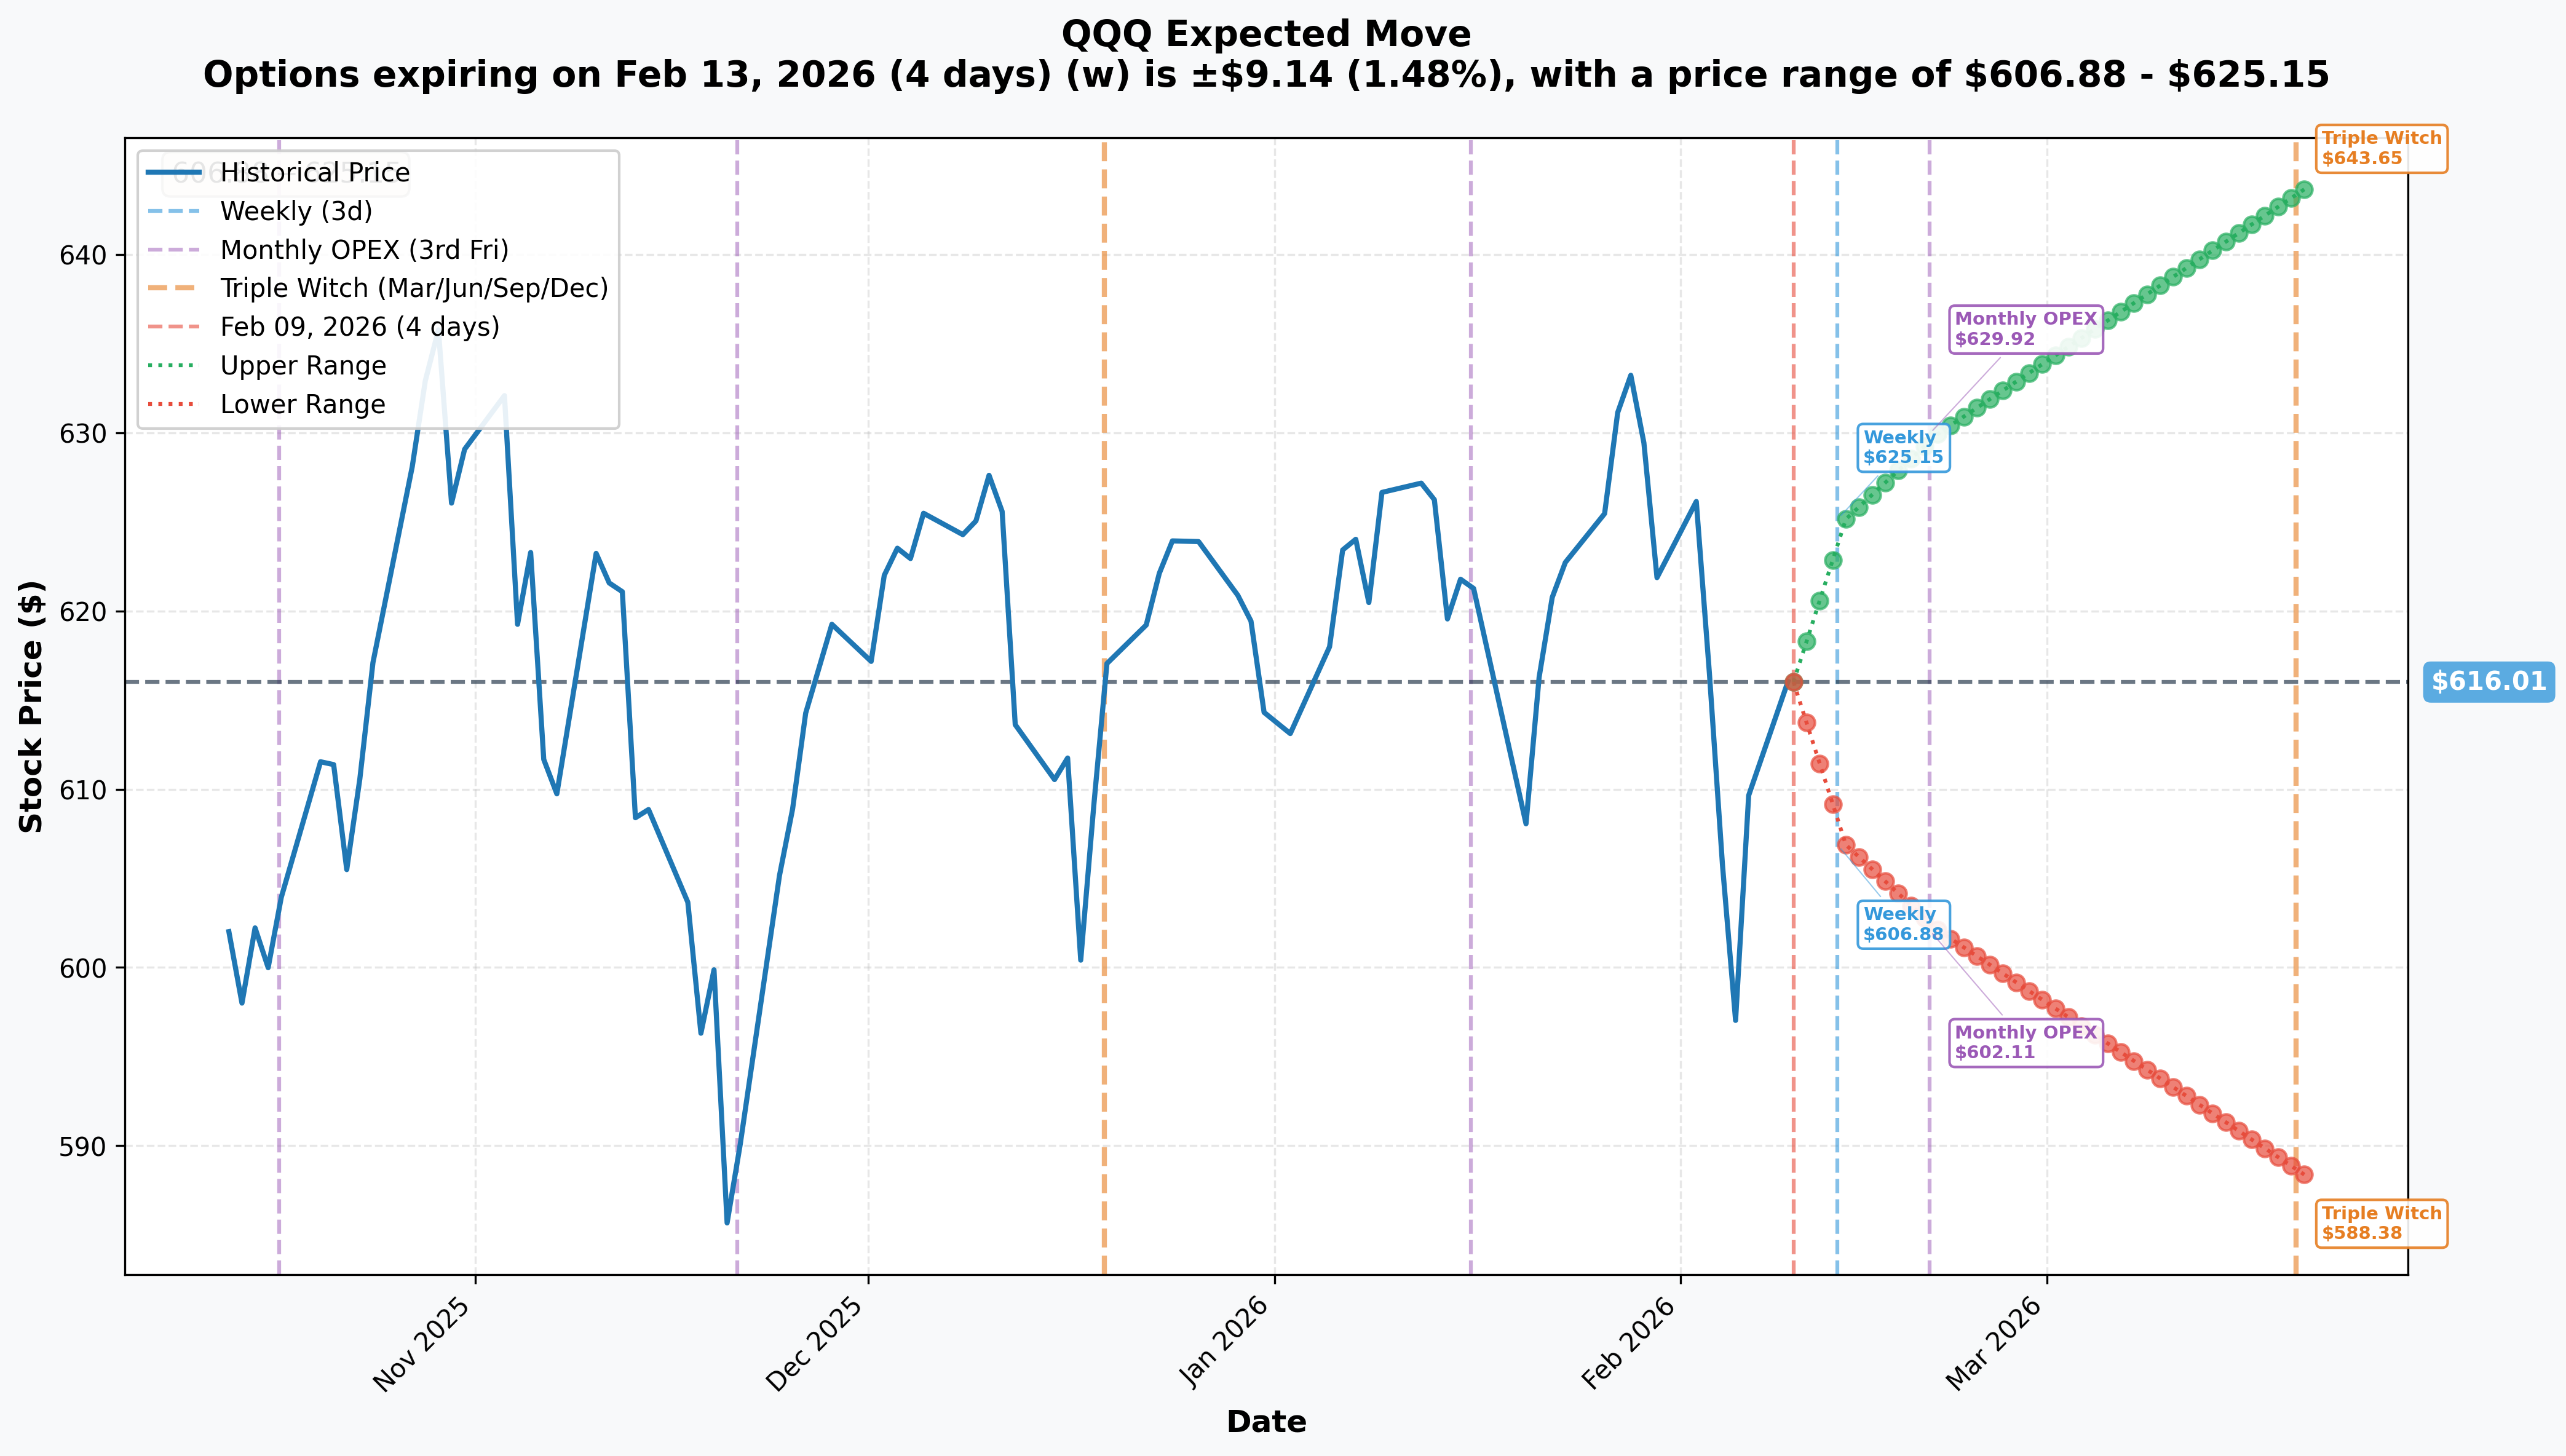
The options market is pricing in the following moves:
| Timeframe | Expiry | Days | Implied Move | Range |
|---|---|---|---|---|
| Weekly | Feb 13 | 4 | ±1.48% ($9.14) | $606.88 - $625.15 |
| Monthly OPEX | Feb 20 | 11 | ±2.26% ($13.91) | $602.11 - $629.92 |
| Triple Witch | Mar 20 | 39 | ±4.49% ($27.64) | $588.38 - $643.65 |
Key Insight: The $600 put strike sits right at the lower bound of the monthly implied move ($602.11) - this trader is positioning for a move to the edge of expected range or beyond.
🎪 Catalysts
📅 Upcoming Events (What's Ahead)
| Date | Event | Impact |
|---|---|---|
| Feb 13 | January CPI Release | 🔥 Critical for Fed rate path |
| Feb 25 | NVIDIA Q4 FY26 Earnings | 🔥 Can move QQQ 2-3% alone |
| Mar 4 | Broadcom Q1 FY26 Earnings | AI semiconductor bellwether |
| Mar 17-18 | FOMC Meeting | Hold expected |
| Jun 16-17 | FOMC Meeting | Potential first cut |
✅ Recent Events (Already Happened)
Mag Seven Earnings - Mostly Bullish:
- 🍎 Apple Q1 FY26: $143.8B revenue (+16% YoY) - Record quarter!
- 📘 Meta Q4 2025: $59.89B revenue (+24% YoY) - Beat expectations
- ☁️ Microsoft Q1 FY26: EPS $4.14 vs $3.91 expected - Beat!
- 📦 Amazon Q4 2025: AWS +24% YoY - Mixed but strong cloud
- 🔤 Alphabet Q4 2025: $113.8B revenue (+18% YoY) - Record!
Bearish Developments:
- 🤖 Claude Cowork "SaaSpocalypse": $285B tech selloff, AMD -17.3%
- 🚗 Tesla Q4 2025: Revenue -3% YoY, Net Income -61% YoY - Weak
- 📉 Fed Held Rates at 3.50%-3.75% - Inflation "somewhat elevated"
🎲 Price Targets & Probabilities
Based on gamma levels, implied moves, and the $18M put positioning:
🐻 Bear Case: $600 (-2.6%)
| Factor | Evidence |
|---|---|
| Gamma Target | Major negative GEX wall at $600 |
| Implied Move | Lower bound of monthly range = $602 |
| Put Strike | Exactly $600 - where the whale is betting |
| Catalyst Risk | CPI hot, NVDA miss, AI disruption fears |
| Probability | 25-30% |
If QQQ breaks below $615 support, momentum could accelerate toward $600. The heavy put gamma at this level creates a magnet effect.
⚖️ Base Case: $615-$620 (Range Bound)
| Factor | Evidence |
|---|---|
| Gamma Support | Strong at $615-$616 current zone |
| Gamma Resistance | $617-$620 caps upside |
| Net GEX | Nearly balanced, slight bear tilt |
| Catalyst | Neutral CPI, steady Fed |
| Probability | 45-50% |
Price likely oscillates between gamma walls while market digests mixed signals.
🚀 Bull Case: $630+ (+2.3%)
| Factor | Evidence |
|---|---|
| Gamma Breakout | Above $625 resistance triggers delta hedging |
| Implied Move | Upper monthly range = $630 |
| Mag Seven | Strong earnings could drive rerating |
| Catalyst | NVDA blowout, cool CPI, dovish Fed |
| Probability | 20-25% |
If NVIDIA crushes estimates on Feb 25, positive gamma squeeze could push QQQ through $625-$630 resistance.
💡 Trading Ideas
🛡️ Conservative: "The Insurance Policy"
Strategy: Buy Put Spread to hedge existing QQQ/tech exposure
| Leg | Strike | Expiration | Est. Cost |
|---|---|---|---|
| Buy Put | $610 | 2026-03-20 | ~$11.00 |
| Sell Put | $590 | 2026-03-20 | ~$6.00 |
| Net Debit | ~$5.00 ($500/spread) |
Why This Works:
- Max profit $1,500 per spread if QQQ drops to $590
- Limited risk to premium paid
- Aligns with the whale's bearish thesis
- Triple witch expiration captures NVDA and March FOMC
Best For: Investors with long QQQ or tech positions wanting downside protection
⚖️ Balanced: "The Volatility Play"
Strategy: Iron Condor capturing elevated implied volatility
| Leg | Strike | Expiration | Credit |
|---|---|---|---|
| Sell Call | $630 | 2026-02-20 | +$3.50 |
| Buy Call | $640 | 2026-02-20 | -$1.80 |
| Sell Put | $600 | 2026-02-20 | +$4.50 |
| Buy Put | $590 | 2026-02-20 | -$2.20 |
| Net Credit | ~$4.00 ($400/spread) |
Why This Works:
- Profits if QQQ stays between $600-$630 (gamma walls!)
- 67% probability of profit based on implied move
- Collects premium decay through monthly OPEX
- Defined risk on both sides
Best For: Traders who think volatility is overpriced and price stays range-bound
Chart Link: QQQ 2026-09-18 $600 Put
🚀 Aggressive: "Follow the Whale"
Strategy: Long Put mimicking institutional positioning
| Trade | Details |
|---|---|
| Buy Put | $600 strike |
| Expiration | 2026-09-18 (same as whale) |
| Est. Cost | ~$32.40 ($3,240/contract) |
| Break-even | $567.60 (-7.9% from current) |
Why This Works:
- Directly aligns with the $18M institutional bet
- 7+ months of time value for thesis to play out
- Captures potential multi-month correction
- Benefits from any volatility spike
Risk Note: This is an expensive directional bet. Only for traders with high conviction on downside.
Best For: Traders who believe tech correction has more room to run
⚠️ Risk Factors
For the Bearish Thesis:
❗ NVIDIA Could Crush It: History shows NVDA beats 85%+ of quarters. A blowout Feb 25 report could send QQQ soaring.
❗ Fed Pivot Dreams: If CPI comes in cool on Feb 13, rate cut expectations could accelerate and lift all boats.
❗ AI Narrative Resilient: The DeepSeek shock one year ago didn't kill the AI trade - and neither might Claude Cowork.
❗ Premium Decay: 7-month puts lose ~$15/day to theta - time is not on your side.
For the Bullish Thesis:
❗ $285B Already Lost: The Claude Cowork selloff proved tech vulnerability to "AI replacement" narratives.
❗ Mag 7 Growth Slowing: Profit growth decelerating to 18% from 30%+ - may not justify multiples.
❗ CapEx Overhang: Combined $500B+ in 2026 CapEx guidance creates execution risk.
❗ Net ETF Outflows: -$1.91B in recent flows suggests institutional repositioning.
🎯 The Bottom Line
Real talk: When someone drops $18M on put protection - representing 555,000 shares worth of downside coverage - you pay attention. This isn't fear-mongering, it's portfolio insurance being purchased at scale.
📋 Action Plan:
If You Own QQQ or Tech:
- Consider adding hedges before Feb 13 CPI and Feb 25 NVDA earnings
- The $600 strike is your "line in the sand" - if it breaks, expect acceleration
- Watch net gamma - if it goes more negative, dealer hedging adds fuel to selloffs
If You're Watching from Sidelines:
- Wait for CPI clarity on Feb 13 before committing
- If QQQ holds $615 through earnings, the bull case strengthens
- A NVDA beat + cool inflation = potential entry on weakness
If You're Bearish:
- Consider spread strategies rather than outright puts to manage theta decay
- March 20 Triple Witch expiration captures both major catalysts
- The $588-$600 zone represents the lower implied move boundary - your target range
📆 Mark Your Calendar:
- Feb 13: January CPI - Sets the Fed narrative
- Feb 20: Monthly OPEX - Gamma unwind potential
- Feb 25: NVIDIA Earnings - Can move QQQ 2-3% alone
- Mar 20: Triple Witch - Major vol event
🧠 The Lesson:
This $18M put trade isn't necessarily predicting a crash - it's acknowledging uncertainty. The same institutions that drove QQQ to new highs are now spending real money on downside protection. Whether you follow them or fade them, don't ignore them.
Someone paid $18M for peace of mind. How much is yours worth?
Disclaimer: Options involve substantial risk and are not suitable for all investors. This analysis is for educational purposes only and does not constitute investment advice. Always do your own research and consider your risk tolerance before trading.