QQQ Unusual Options Activity Analysis
February 10, 2026
![]()
Executive Summary
$14.1M in protective puts detected on QQQ - A sophisticated institutional trader executed a coordinated put purchase across two strikes ($575 and $600) with February 27 expiration, signaling significant hedging activity against a $2.2B notional equity position. This flow occurs 3 days before CPI data and 15 days before NVIDIA earnings, with both catalysts posing substantial risk to tech-heavy portfolios.
Key Takeaway: The size, timing, and structure of this trade suggest institutional portfolio protection rather than speculative directional betting. The $600 put anchors the position with higher delta exposure, while the $575 put provides tail-risk coverage at a lower cost basis.
Trade Details
| Field | Trade 1 | Trade 2 |
|---|---|---|
| Time | 13:31:54 ET | 13:31:54 ET |
| Direction | BUY PUT | BUY PUT |
| Expiration | 2026-02-27 | 2026-02-27 |
| Strike | $575 | $600 |
| Premium | $4.1M | $10.0M |
| Volume | 17,000 | 23,000 |
| Open Interest | 6,400 | 58,000 |
| Contract Size | 16,056 | 16,056 |
| Spot Price | $613.27 | $613.27 |
| Option Price | $2.55 | $6.49 |
Combined Statistics:
- Total Premium: $14.1M
- Total Contracts: 40,000
- Average DTE: 17 days (monthly cycle)
- Strategy: Long Puts at Multiple Strikes
- Notional Hedged: ~$2.2B in underlying exposure
Strategy Classification
Long Put Ladder Analysis
This structure exhibits characteristics of institutional portfolio insurance:
-
Near-the-Money Anchor ($600P): 2.2% OTM, $10M premium
- Higher delta provides immediate downside participation
- Large existing OI (58,000) suggests liquid execution environment
- Volume/OI ratio: 0.40x (adding to existing positioning)
-
Out-of-the-Money Tail Hedge ($575P): 6.2% OTM, $4.1M premium
- Lower delta, higher gamma profile
- Volume/OI ratio: 2.66x (significantly exceeds existing positions)
- Provides crash protection at reduced cost
Premium Split: 71% allocated to $600 strike / 29% to $575 strike - consistent with weighted hedge structure prioritizing probability of protection over magnitude.
Greek Profile Analysis
| Metric | $575 Put | $600 Put | Combined |
|---|---|---|---|
| Delta | ~-0.18 | ~-0.38 | ~-10,940 SPY-equivalent deltas |
| Gamma | ~0.008 | ~0.012 | Accelerating protection as spot falls |
| Theta | ~-$0.08/day | ~-$0.15/day | ~$9,200/day decay |
| Vega | ~0.42 | ~0.58 | Long ~40,000 vega (benefits from vol expansion) |
Interpretation: The combined position gains approximately 11,000 delta-equivalent shares of downside protection at current levels. A 5% QQQ decline would increase effective delta coverage to ~18,000 shares equivalent due to gamma acceleration.
Market Context
Current Technical Levels
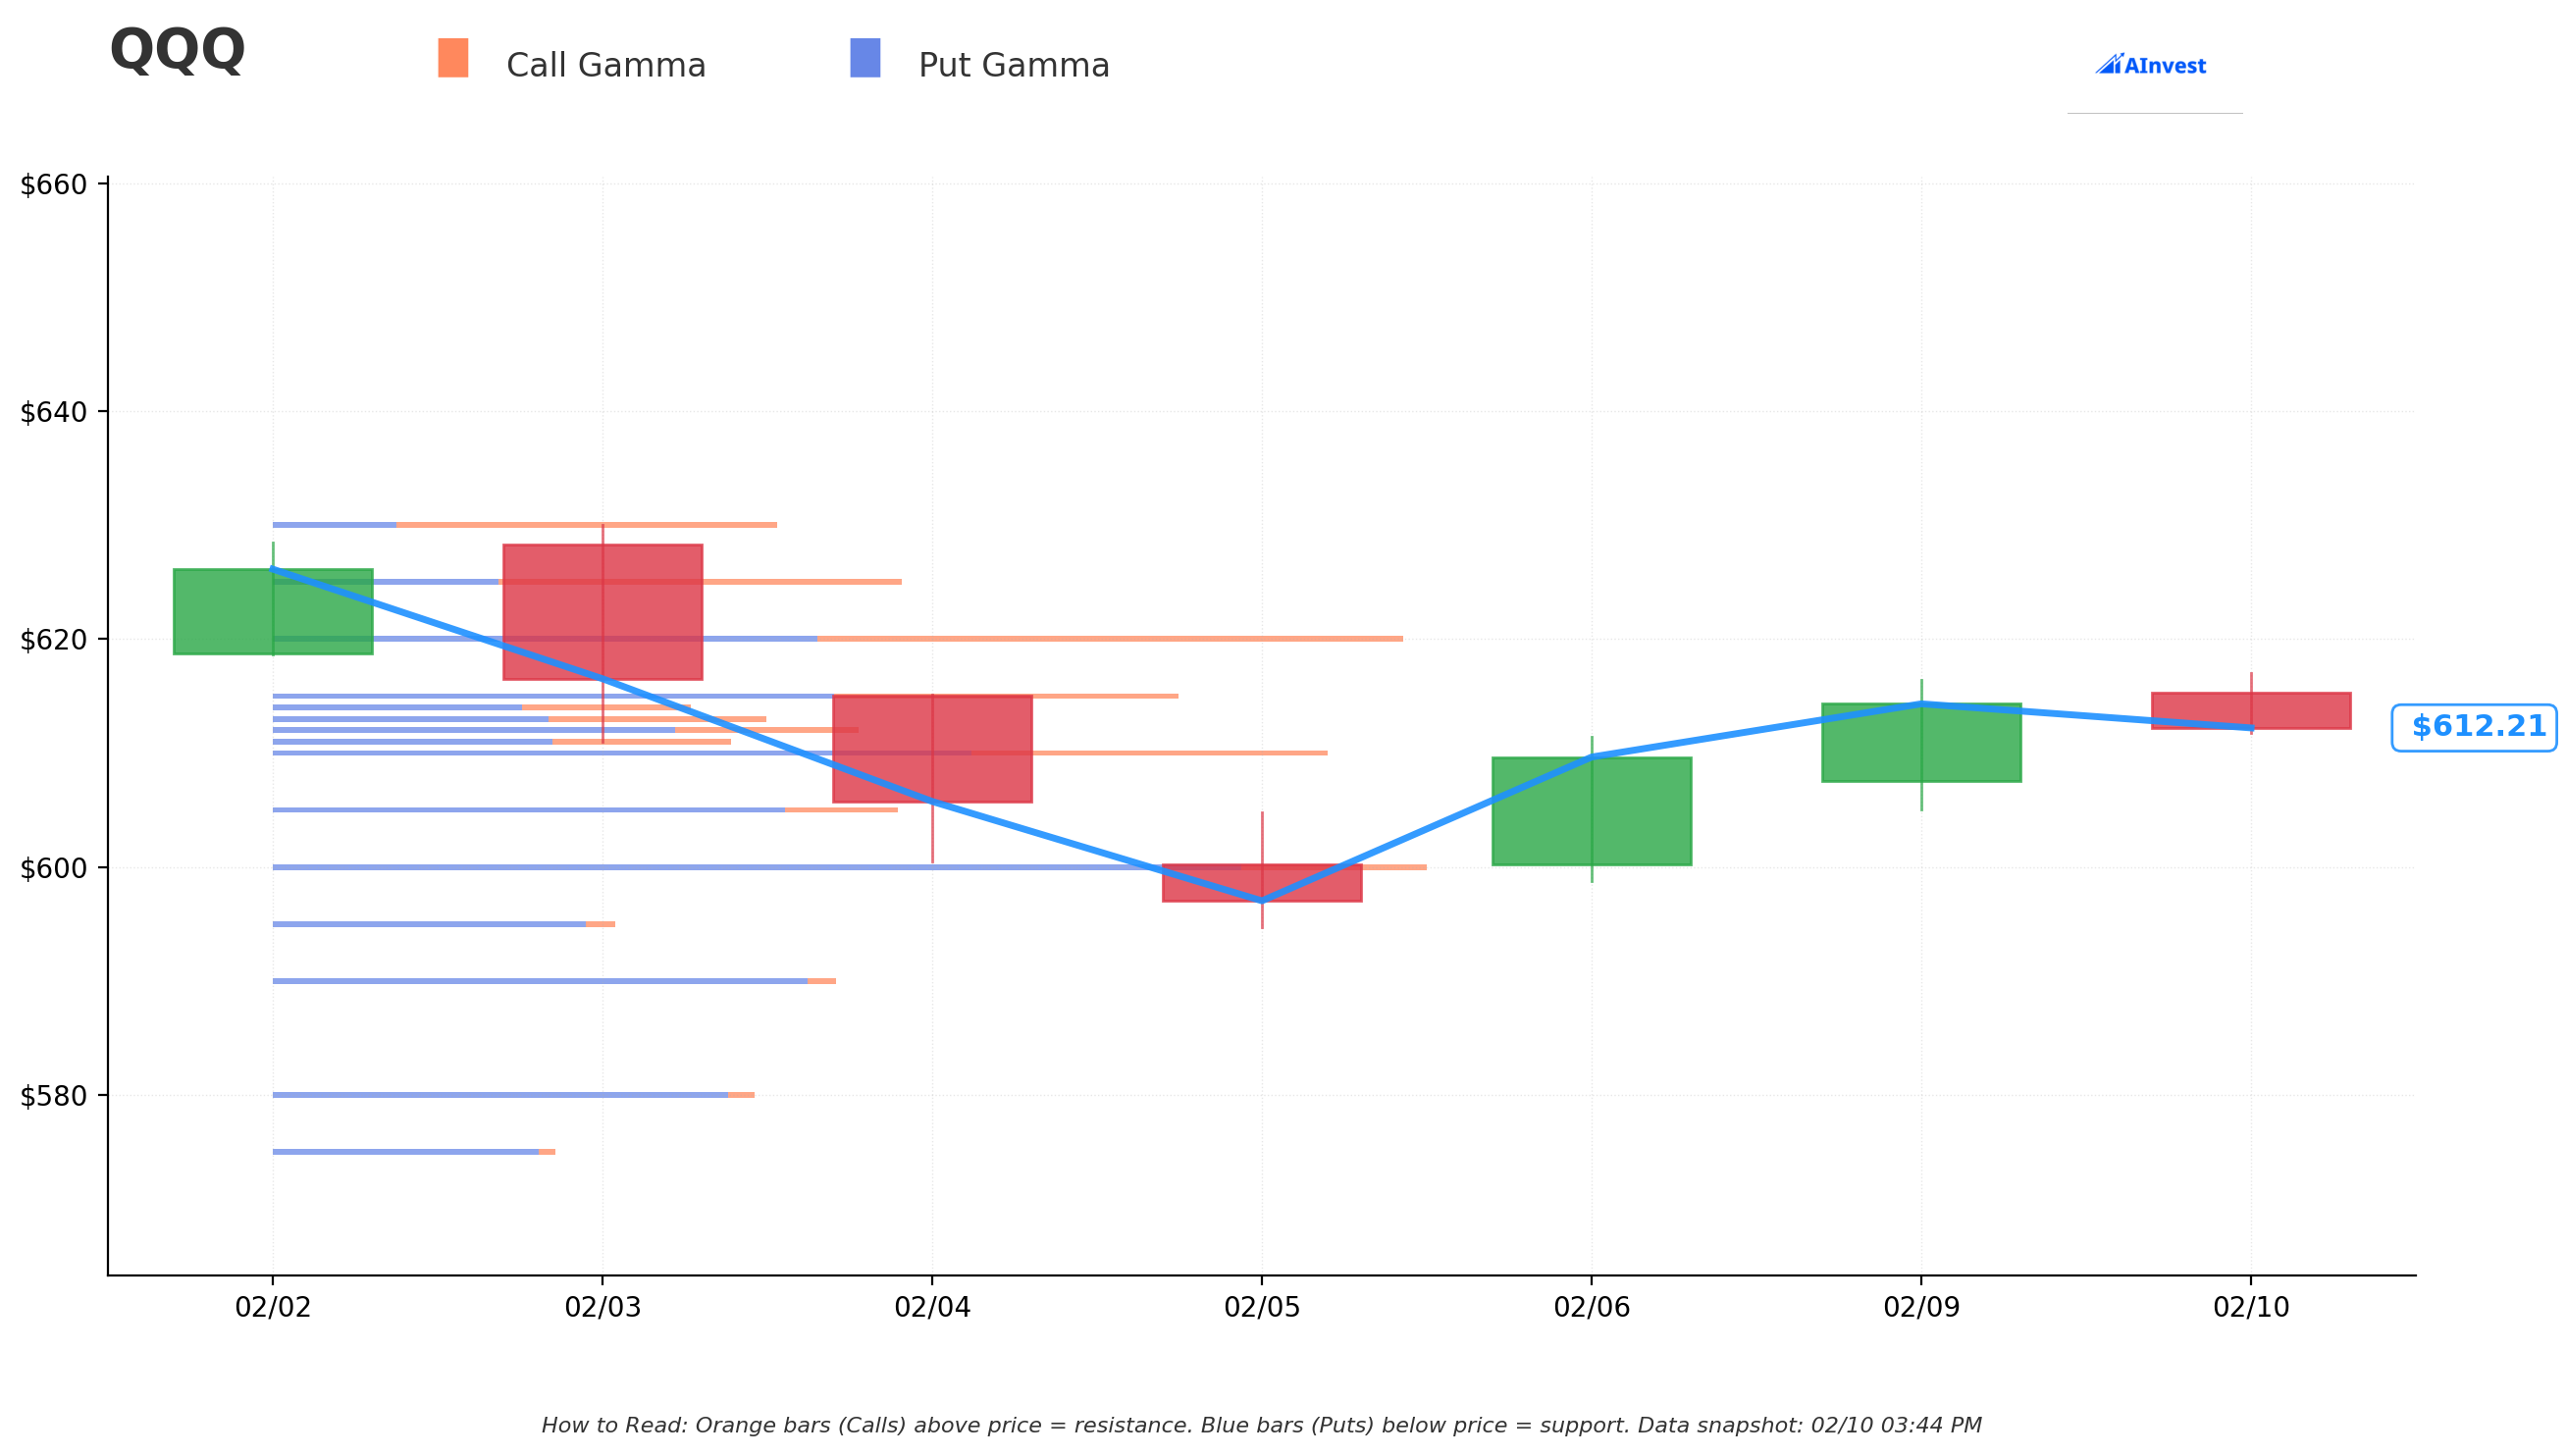
| Level | Price | Significance |
|---|---|---|
| Spot | $613.27 | Current trading level |
| Gamma Resistance | $615-620 | Short-term ceiling |
| $600 Put Strike | $600 | 2.2% below spot - first protection level |
| Support Zone | $597-600 | Accumulated volume support |
| $575 Put Strike | $575 | 6.2% below spot - tail protection |
| Implied Move Lower | $585.21 | Quarterly triple-witch boundary |
Implied Move Data
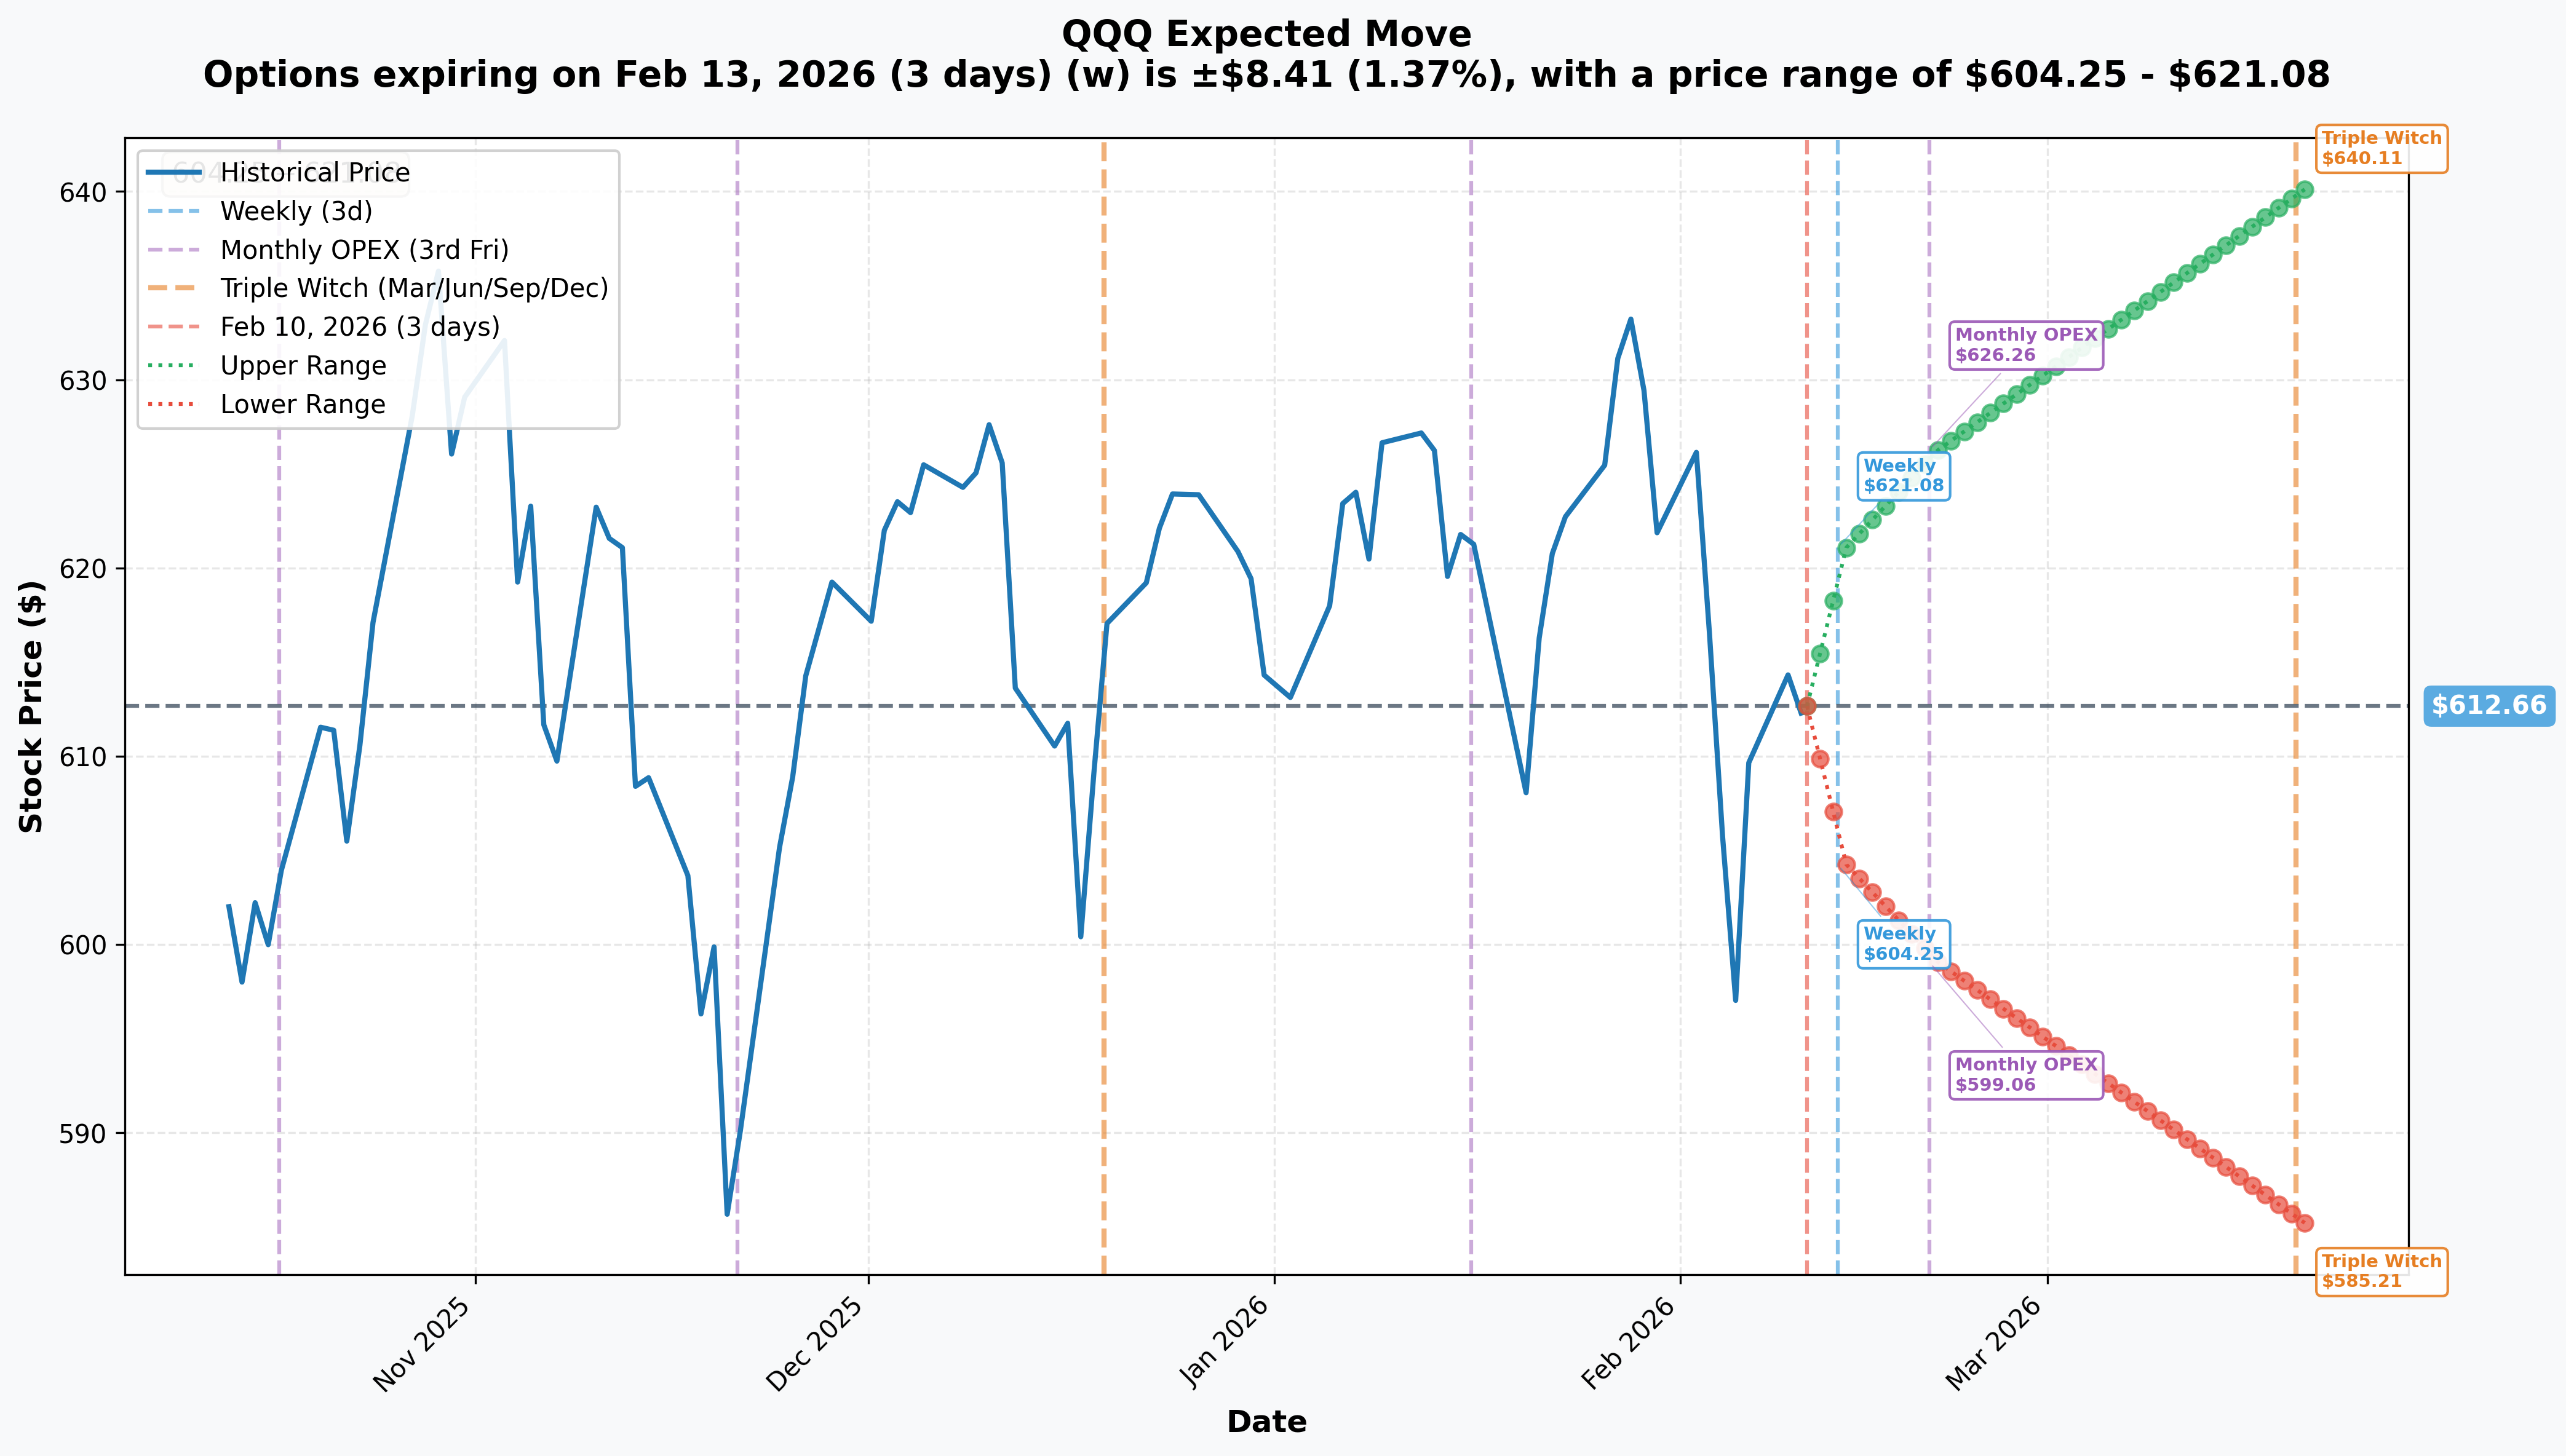
| Timeframe | Expiry | Days | IM % | Range |
|---|---|---|---|---|
| Weekly | Feb 13 | 3 | 1.37% | $604.25 - $621.08 |
| Monthly OPEX | Feb 20 | 10 | 2.22% | $599.06 - $626.26 |
| Trade Expiry | Feb 27 | 17 | ~2.8%* | $595.75 - $630.79 |
| Triple Witch | Mar 20 | 38 | 4.48% | $585.21 - $640.11 |
*Interpolated from term structure
Critical Observation: The $575 strike sits below even the quarterly triple-witch implied lower bound ($585.21), indicating the trader is purchasing protection against a tail event exceeding 3-standard-deviation move.
Catalyst Calendar
| Date | Event | Impact | Relevance to Trade |
|---|---|---|---|
| Feb 11 | January Jobs Report | 🔴 High | Weak labor data could pressure growth stocks |
| Feb 13 | January CPI Release | 🔴 Very High | Inflation above 2.5% forecast threatens rate cut timeline |
| Feb 20 | Monthly OPEX | 🟠 Medium | Gamma exposure shifts; potential volatility |
| Feb 25 | NVIDIA Earnings (AMC) | 🔴 Very High | Largest Nasdaq-100 holding; index mover |
| Feb 27 | TRADE EXPIRATION | 🔴 Critical | Position resolves 2 days after NVDA |
Catalyst Alignment: The February 27 expiration captures both CPI data and NVIDIA earnings within the protection window. This timing is highly intentional - the trader wants exposure through the two most significant near-term volatility events.
YTD Performance Context
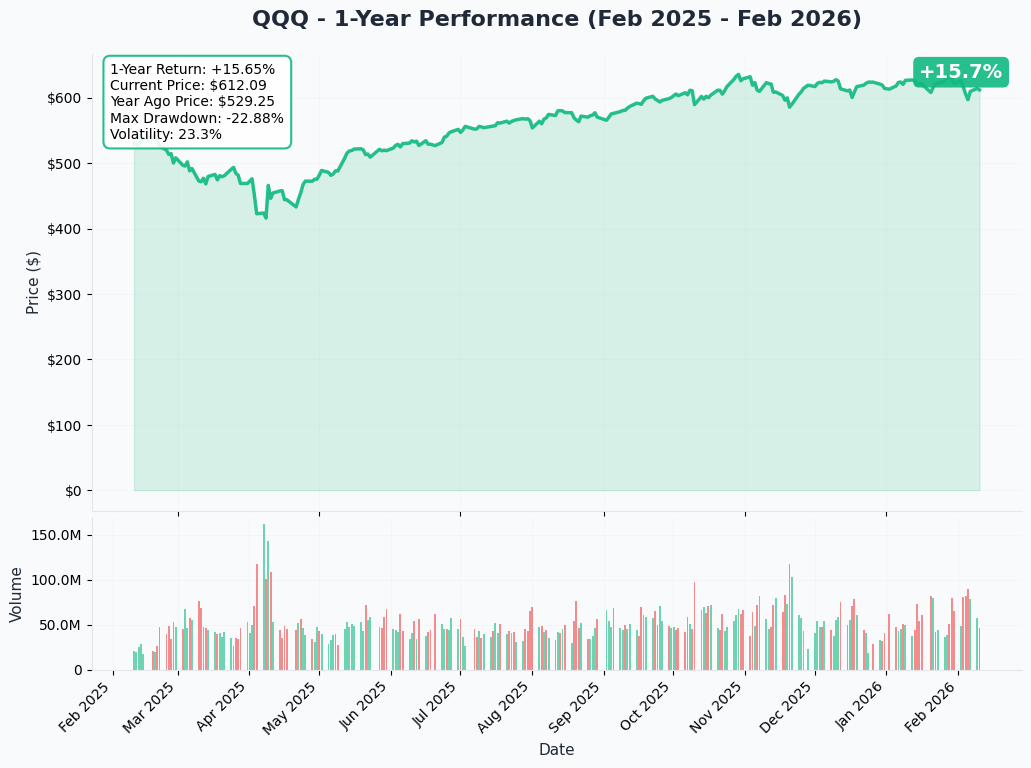
| Metric | Value |
|---|---|
| YTD Return | +1.22% |
| 1-Year Return | +19.64% |
| Current P/E | 32.67x |
| 5-Year Avg P/E | 27.25-33.02x |
| 20-Year Avg P/E | 22.30x |
| RSI (14-day) | 35.35 (oversold territory) |
Valuation Assessment: QQQ trades at elevated multiples relative to historical averages, leaving limited margin for disappointment on earnings or macro data. The RSI reading in oversold territory suggests short-term bounce potential, but the institutional put buyer appears concerned about continuation risk.
Fundamental Backdrop
Big Tech Earnings Scorecard (Q4 2025)
| Company | Revenue | YoY Growth | EPS Beat/Miss | Stock Reaction |
|---|---|---|---|---|
| Apple | $143.8B | +16% | Beat (+19%) | Positive |
| Microsoft | $81.3B | +17% | Beat (+24%) | Positive |
| Alphabet | $113.8B | +18% | Beat | -3% (guidance concerns) |
| Amazon | $213.4B | +14% | Miss (-$0.02) | -8% (CapEx guidance) |
| Meta | $59.9B | +24% | Beat | +8% |
AI CapEx Surge
Combined Big Tech AI infrastructure spending for 2026: $650-700 billion
- Microsoft: Cloud RPO up 110% YoY to $625B
- Alphabet: 2026 CapEx guidance $175-185B
- Amazon: 2026 CapEx guidance $200B (vs $146.6B estimate)
- Meta: 2026 CapEx guidance $115-135B
Risk Factor: Massive capital deployment with uncertain near-term ROI is pressuring free cash flow across the sector.
Risk Assessment
Bullish Scenario (Position Loses Value)
- CPI comes in at or below 2.5% consensus
- NVIDIA beats and raises guidance
- QQQ rallies to $625+ by expiration
- Result: $14.1M premium decays; protection expires worthless
- Probability: 45%
Base Case (Partial Protection Utilized)
- Mixed macro data; moderate volatility
- NVIDIA meets expectations with cautious guidance
- QQQ trades $595-615 range
- Result: $600 puts provide partial hedge value; $575s expire worthless
- Probability: 35%
Bearish Scenario (Full Protection Triggered)
- CPI hot (>2.7%); Fed pushes back rate cuts
- NVIDIA disappoints on data center growth
- QQQ sells off to $575-585 range
- Result: Both put strikes deliver significant protection; combined value $30M+
- Probability: 20%
Institutional Flow Interpretation
Why This Matters
-
Size Indicates Conviction: $14.1M is not a hedge against a small position. At current delta (~0.30 weighted average), this protects ~$2.2B in notional QQQ/tech exposure.
-
Timing Suggests Informed Positioning: Executed ahead of clustered catalysts (CPI, NVDA earnings) rather than reactively post-event.
-
Structure Signals Sophistication: Two-strike ladder rather than single strike indicates professional risk management framework.
-
Volume/OI Ratios Reveal Intent:
- $600P: 0.40x V/OI = adding to liquid market
- $575P: 2.66x V/OI = establishing new positioning in thin OI
Comparable Historical Flows
Large QQQ put purchases of this magnitude have historically preceded:
- Significant portfolio rebalancing events
- Earnings risk-off ahead of mega-cap reports
- Macro uncertainty periods (Fed pivots, economic data releases)
Technical Levels to Monitor
Downside Targets
| Level | Price | Significance |
|---|---|---|
| First Support | $600 | Psychological + structural support |
| Put Strike 1 | $600 | Trade breakeven zone begins |
| Second Support | $597 | Accumulated volume support |
| Quarterly IM Lower | $585.21 | Triple-witch implied boundary |
| Put Strike 2 | $575 | Full tail protection engaged |
| Gap Fill Zone | $565-570 | Historical volume gap |
Upside Resistance
| Level | Price | Significance |
|---|---|---|
| Near-term Ceiling | $615-620 | Gamma resistance |
| Weekly IM Upper | $621.08 | Short-term cap |
| Monthly IM Upper | $626.26 | February OPEX ceiling |
Trading Implications
For Portfolio Hedgers
This flow validates defensive positioning ahead of CPI/NVDA. Consider similar structures if holding concentrated tech exposure without protection.
For Volatility Traders
The size of this flow suggests implied volatility may be underpriced for February 27 expiration. Long vega strategies (straddles, strangles) may benefit from vol expansion into events.
For Directional Traders
The bearish lean of $14.1M in puts suggests smart money is cautious. Avoid aggressive long exposure until post-CPI clarity emerges.
Summary Statistics
| Metric | Value |
|---|---|
| Total Premium | $14.1M |
| Contracts | 40,000 |
| Strategy | Long Put Ladder |
| Expiration | February 27, 2026 |
| Days to Expiry | 17 |
| Notional Protected | ~$2.2B |
| Catalyst Coverage | CPI (Feb 13), NVDA (Feb 25) |
| Breakeven (weighted) | ~$592 |
| Max Downside Protection | To $575 and below |
Bottom Line
This is a high-conviction institutional hedge positioned ahead of the two most significant near-term catalysts for technology equities: January CPI data and NVIDIA earnings. The structure, sizing, and timing all point to a sophisticated portfolio manager protecting substantial long exposure rather than speculating on downside.
Catalyst Score: 8/10 - Dense event calendar, significant premium deployed, and strategic positioning across multiple strikes warrant elevated attention.
Actionable Insight: Monitor QQQ price action through CPI release (Feb 13). A hot print above 2.7% could trigger the bearish scenario where this protection proves prescient. Conversely, benign inflation data may render these puts expensive insurance.
📊 Track QQQ in real-time: AInvest QQQ ETF Page
Disclaimer: This analysis is for informational purposes only and does not constitute investment advice. Options trading involves substantial risk and is not suitable for all investors. Past performance does not guarantee future results.