🐻 QQQ $250M Put Ladder - Institutional Money Bracing for Nasdaq Crash!
📅 March 16, 2026 | 🔥 Unusual Activity Detected
🎯 The Quick Take
Someone just dropped $250.6 MILLION on QQQ puts in the final minutes of trading today — one of the largest single-session ETF options bets we've seen in years! Six legs of deep ITM puts, all expiring in just 4 days on March 20, were loaded up simultaneously at 15:34:50 with the Nasdaq 100 sitting at $600.64. Translation: a whale-sized institutional player is either terrified about this week's FOMC decision or has a massive Nasdaq portfolio they need to protect RIGHT NOW. With the Fed's critical dot plot dropping Wednesday and oil at $106/bbl from the Iran conflict, this is not your neighbor Bob's account — this is heavy armor going on. 👀
📊 Company Overview
QQQ - Invesco QQQ Trust is the world's most actively traded equity ETF, tracking the Nasdaq-100 Index — a market-cap-weighted index of the 100 largest non-financial companies listed on the Nasdaq exchange:
- AUM: ~$387-392 billion (one of the largest ETFs in existence)
- Structure: ETF (Exchange-Traded Fund), tracks Nasdaq-100 Index
- Current Price: $600.63 (down ~12.6% from mid-February all-time highs near $637)
- Top Holdings: Apple (AAPL), Microsoft (MSFT), Nvidia (NVDA), Amazon (AMZN), Meta (META), Alphabet (GOOGL), Broadcom (AVGO), Tesla (TSLA) — these 8 names alone represent nearly 50% of the fund
- YTD Performance: Down ~2% in 2026 after closing 2025 up +19.45%
💰 The Option Flow Breakdown
📊 The Tape — March 16, 2026 @ 15:34:50
All six legs hit the tape simultaneously at the same timestamp. Every single one is a BUY at the MID (not bid, not ask — mid price), which is a hallmark of block negotiation between two institutional counterparties via a broker. Every leg shows volume massively exceeding existing open interest, confirming these are fresh positions opened today.
| Time | Symbol | Side | Buy/Sell | C/P | Expiration | Premium | Strike | Volume | OI | Size | Spot | Option Price | Option Symbol |
|---|---|---|---|---|---|---|---|---|---|---|---|---|---|
| 15:34:50 | QQQ | MID | BUY | PUT | 2026-03-20 | $135M | $630 | 46,000 | 8,300 | 45,670 | $600.63 | $29.66 | QQQ20260320P630 |
| 15:34:50 | QQQ | MID | BUY | PUT | 2026-03-20 | $73M | $625 | 30,000 | 0 | 29,450 | $600.64 | $24.69 | QQQ20260320P625 |
| 15:34:50 | QQQ | MID | BUY | PUT | 2026-03-20 | $16M | $628 | 5,600 | 694 | 5,630 | $600.64 | $27.73 | QQQ20260320P628 |
| 15:34:50 | QQQ | MID | BUY | PUT | 2026-03-20 | $12M | $635 | 3,400 | 301 | 3,360 | $600.64 | $34.48 | QQQ20260320P635 |
| 15:34:50 | QQQ | MID | BUY | PUT | 2026-03-20 | $7.5M | $640 | 1,900 | 200 | 1,910 | $600.64 | $39.50 | QQQ20260320P640 |
| 15:34:50 | QQQ | MID | BUY | PUT | 2026-03-20 | $7.1M | $650 | 1,500 | 155 | 1,440 | $600.64 | $49.47 | QQQ20260320P650 |
Total Premium Spent: ~$250.6 Million 💰
🤓 What This Actually Means
Let me break this down for you. Here's what just happened:
- 🐋 A put ladder across 6 strikes: All puts are currently in-the-money (QQQ at $600.64, strikes from $625 to $650). Buying ITM puts means paying high premium but the trade has immediate intrinsic value and delta exposure — this isn't speculation on a long-shot move, this is buying serious protection.
- 💸 $250.6M total in 4-day options: Every dollar of premium expires worthless or pays off by Friday, March 20 — the March Quarterly Triple Witch expiration. Whoever did this is making an immediate-term statement, not a months-long bet.
- 📊 The 630 strike is the anchor: At $135M, the 630 put represents 54% of the entire trade. With QQQ at $600.64, a 630 put is already ~$29 in-the-money. This whale needs QQQ to STAY below $630 or DROP further to profit on this leg.
- 🎯 Zero open interest on the $625 strike: The $73M 625 put leg showed ZERO existing open interest — 30,000 contracts were created from scratch at 15:34:50. This is a brand new strike being activated.
- 🏦 Who does this? This is institutional-sized. Think pension funds, family offices, macro hedge funds, or large asset managers who hold tens of billions in Nasdaq exposure and are buying emergency insurance 4 days before a critical FOMC decision. The cost of $250M to protect a $5-10B Nasdaq portfolio is roughly 2.5-5% — a perfectly rational insurance premium.
The key question: Is this a directional bet (they think QQQ tanks this week) or a hedge (they're long QQQ/Nasdaq and protecting against a selloff)? The size and ITM structure leans more toward hedge territory — a pure speculative bet would use OTM puts for leverage. These ITM strikes suggest someone protecting an enormous existing long position.
📈 Technical Setup / Chart Check-Up
YTD Performance Chart
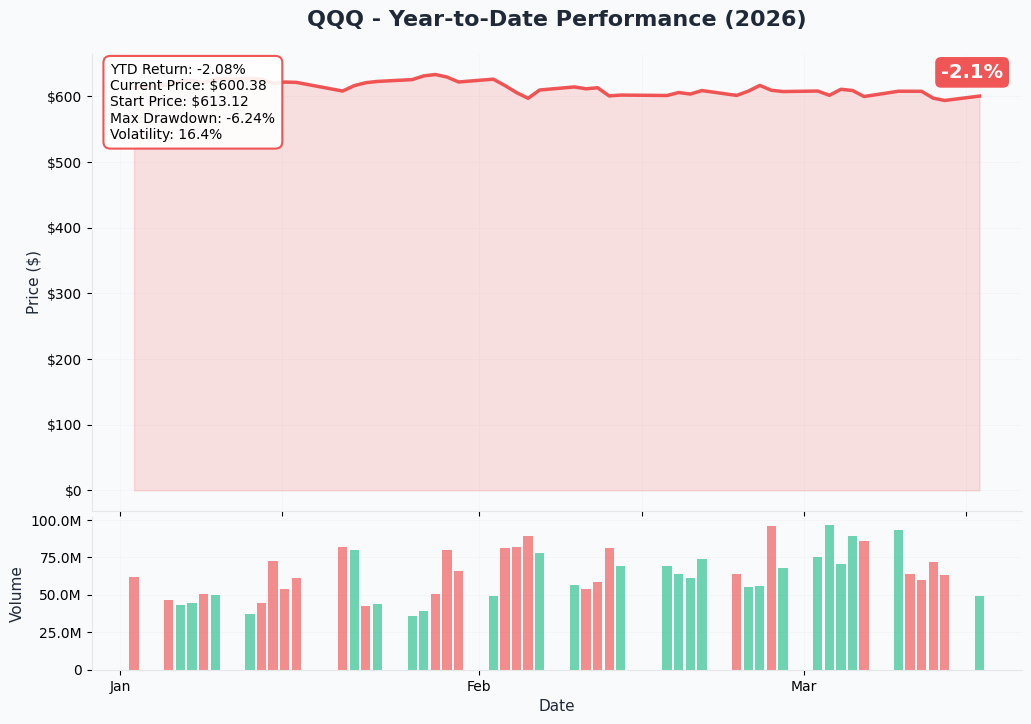
QQQ is down approximately 2% YTD in 2026 after a strong 2025 (+19.45% for the year), having peaked near the all-time high of $637.01 in mid-February before sliding into a 12.6% correction. The current price around $600 represents a technically significant zone — sitting right at what was a prior breakout level and near the 200-day moving average.
Key observations from the YTD chart:
- 📉 Sharp February-March pullback: The reversal from $637 to ~$593 low happened fast, driven by the U.S.-Iran conflict beginning February 28 that spiked oil from $72 to $106/bbl
- ⚠️ 20-day and 50-day MAs are broken: Short-term structure shifted bearish; those averages are now acting as overhead resistance
- 📊 $593 is the first major support floor: The ETF tested this level in early-to-mid March and has been consolidating in the $593-$605 range
- 🔄 Momentum divergence: Multiple attempts to reclaim $610 have been rejected — institutional sellers appear above that level
- 💼 Fund outflows confirm institutional caution: 1-month net outflows of -$2.7B and 3-month outflows of -$3.81B show sustained institutional selling even as retail buyers dip-buy
Gamma-Based Support & Resistance Analysis
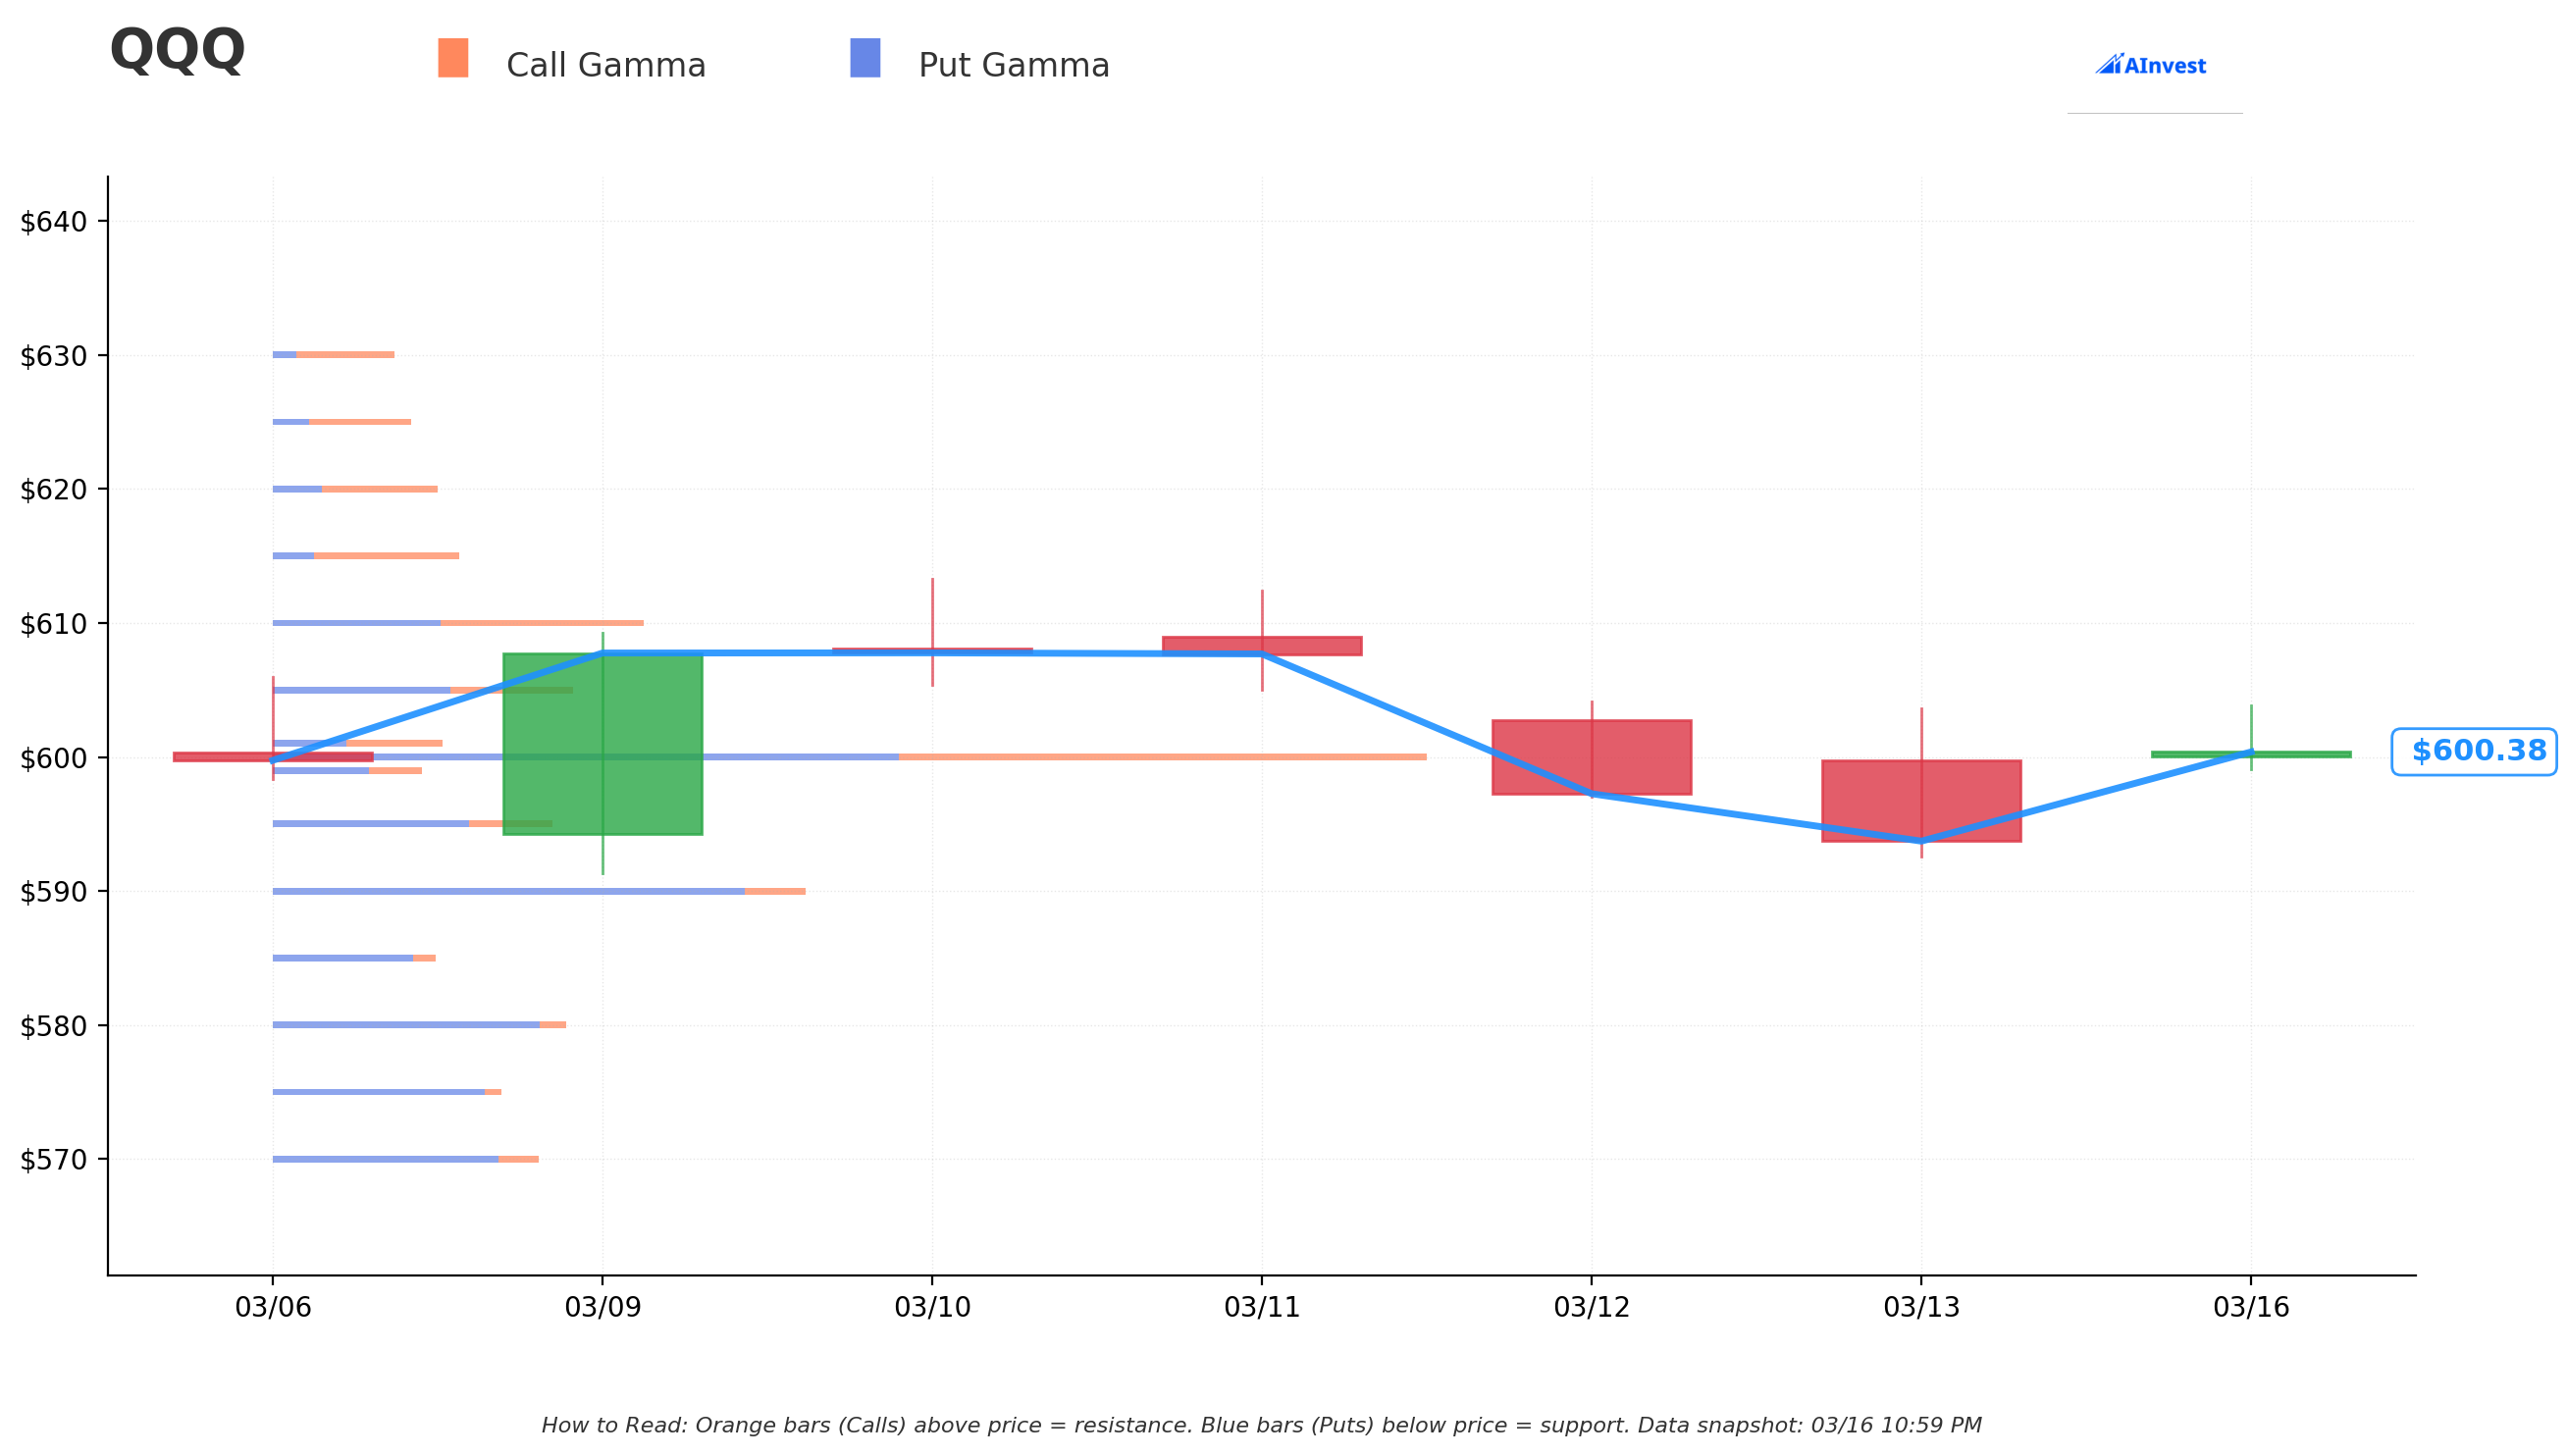
Current Price: $600.22
The gamma exposure (GEX) map is telling us a clear story today: net bearish bias with put gamma dominating call gamma by $1.75B to $1.23B. Here's what the levels reveal:
🔵 Support Levels (Put Gamma Below Price — "Floor Zones"):
These are strike prices where market makers have sold puts and need to BUY shares as the ETF falls — creating natural buying demand and cushions:
- $600 — Strongest nearby support with $472.7M total gamma (net put bias $-40.2M). This is the big wall right beneath current price. Think of it as a trampoline — every time QQQ touches $600, dealers buy to re-hedge. But if this cracks, the next floor is further down.
- $595 — Secondary support at $114.6M total gamma with net put bias ($-46.5M). This is where buying picks up next if $600 fails.
- $590 — Meaningful floor at $218.2M total gamma with heavy net put dominance ($-168.5M) — dealers are deeply short puts here.
- $580 — Structural floor zone with $120.1M total gamma ($-98.7M net put). A move to $580 would represent a ~3.4% further decline from here — painful but within options market expectations.
- $575 — Extended support at $93.6M gamma ($-79.7M net) — this is where the $250M put buyer's 625-650 strikes start carrying serious intrinsic value.
- $570 — Deep floor at $108.8M gamma ($-76.2M net). Getting here means about a 5% decline — well outside normal weekly ranges but the Iran conflict / FOMC combination is exactly the kind of catalyst that gets you there.
🟠 Resistance Levels (Call Gamma Above Price — "Ceiling Zones"):
These are levels where dealers have sold calls and need to SELL shares as QQQ rallies — creating natural selling pressure:
- $601 — Immediate ceiling, barely above current price! Only $69.6M total gamma (net positive $9.3M call bias). The tightest resistance band — $600-$601 is a compression zone.
- $605 — Secondary resistance at $122.9M total gamma with some net put bias ($-22.3M) — mixed signals here, but still overhead friction.
- $610 — Meaningful ceiling at $151.8M total gamma with positive call bias ($+14.7M). Multiple recent rally attempts have stalled near $610 — the gamma data explains why.
- $615 — Upper resistance at $76.4M gamma with strong net call bias ($+43.0M). Breaking $615 would signal a genuine recovery — but the current macro backdrop makes this the harder path.
Bottom line: QQQ is sandwiched in a tight $600-$601 compression zone with heavy gamma on both sides. The net GEX bias is Bearish (total put gamma $1.75B vs call gamma $1.23B). The market maker community is more hedged against downside than upside moves right now. That $600 support is critical — below it, there are meaningful gamma floors at $595, $590, $580, $575, and $570, but none have the same gravitational pull as $600.
Implied Move Analysis
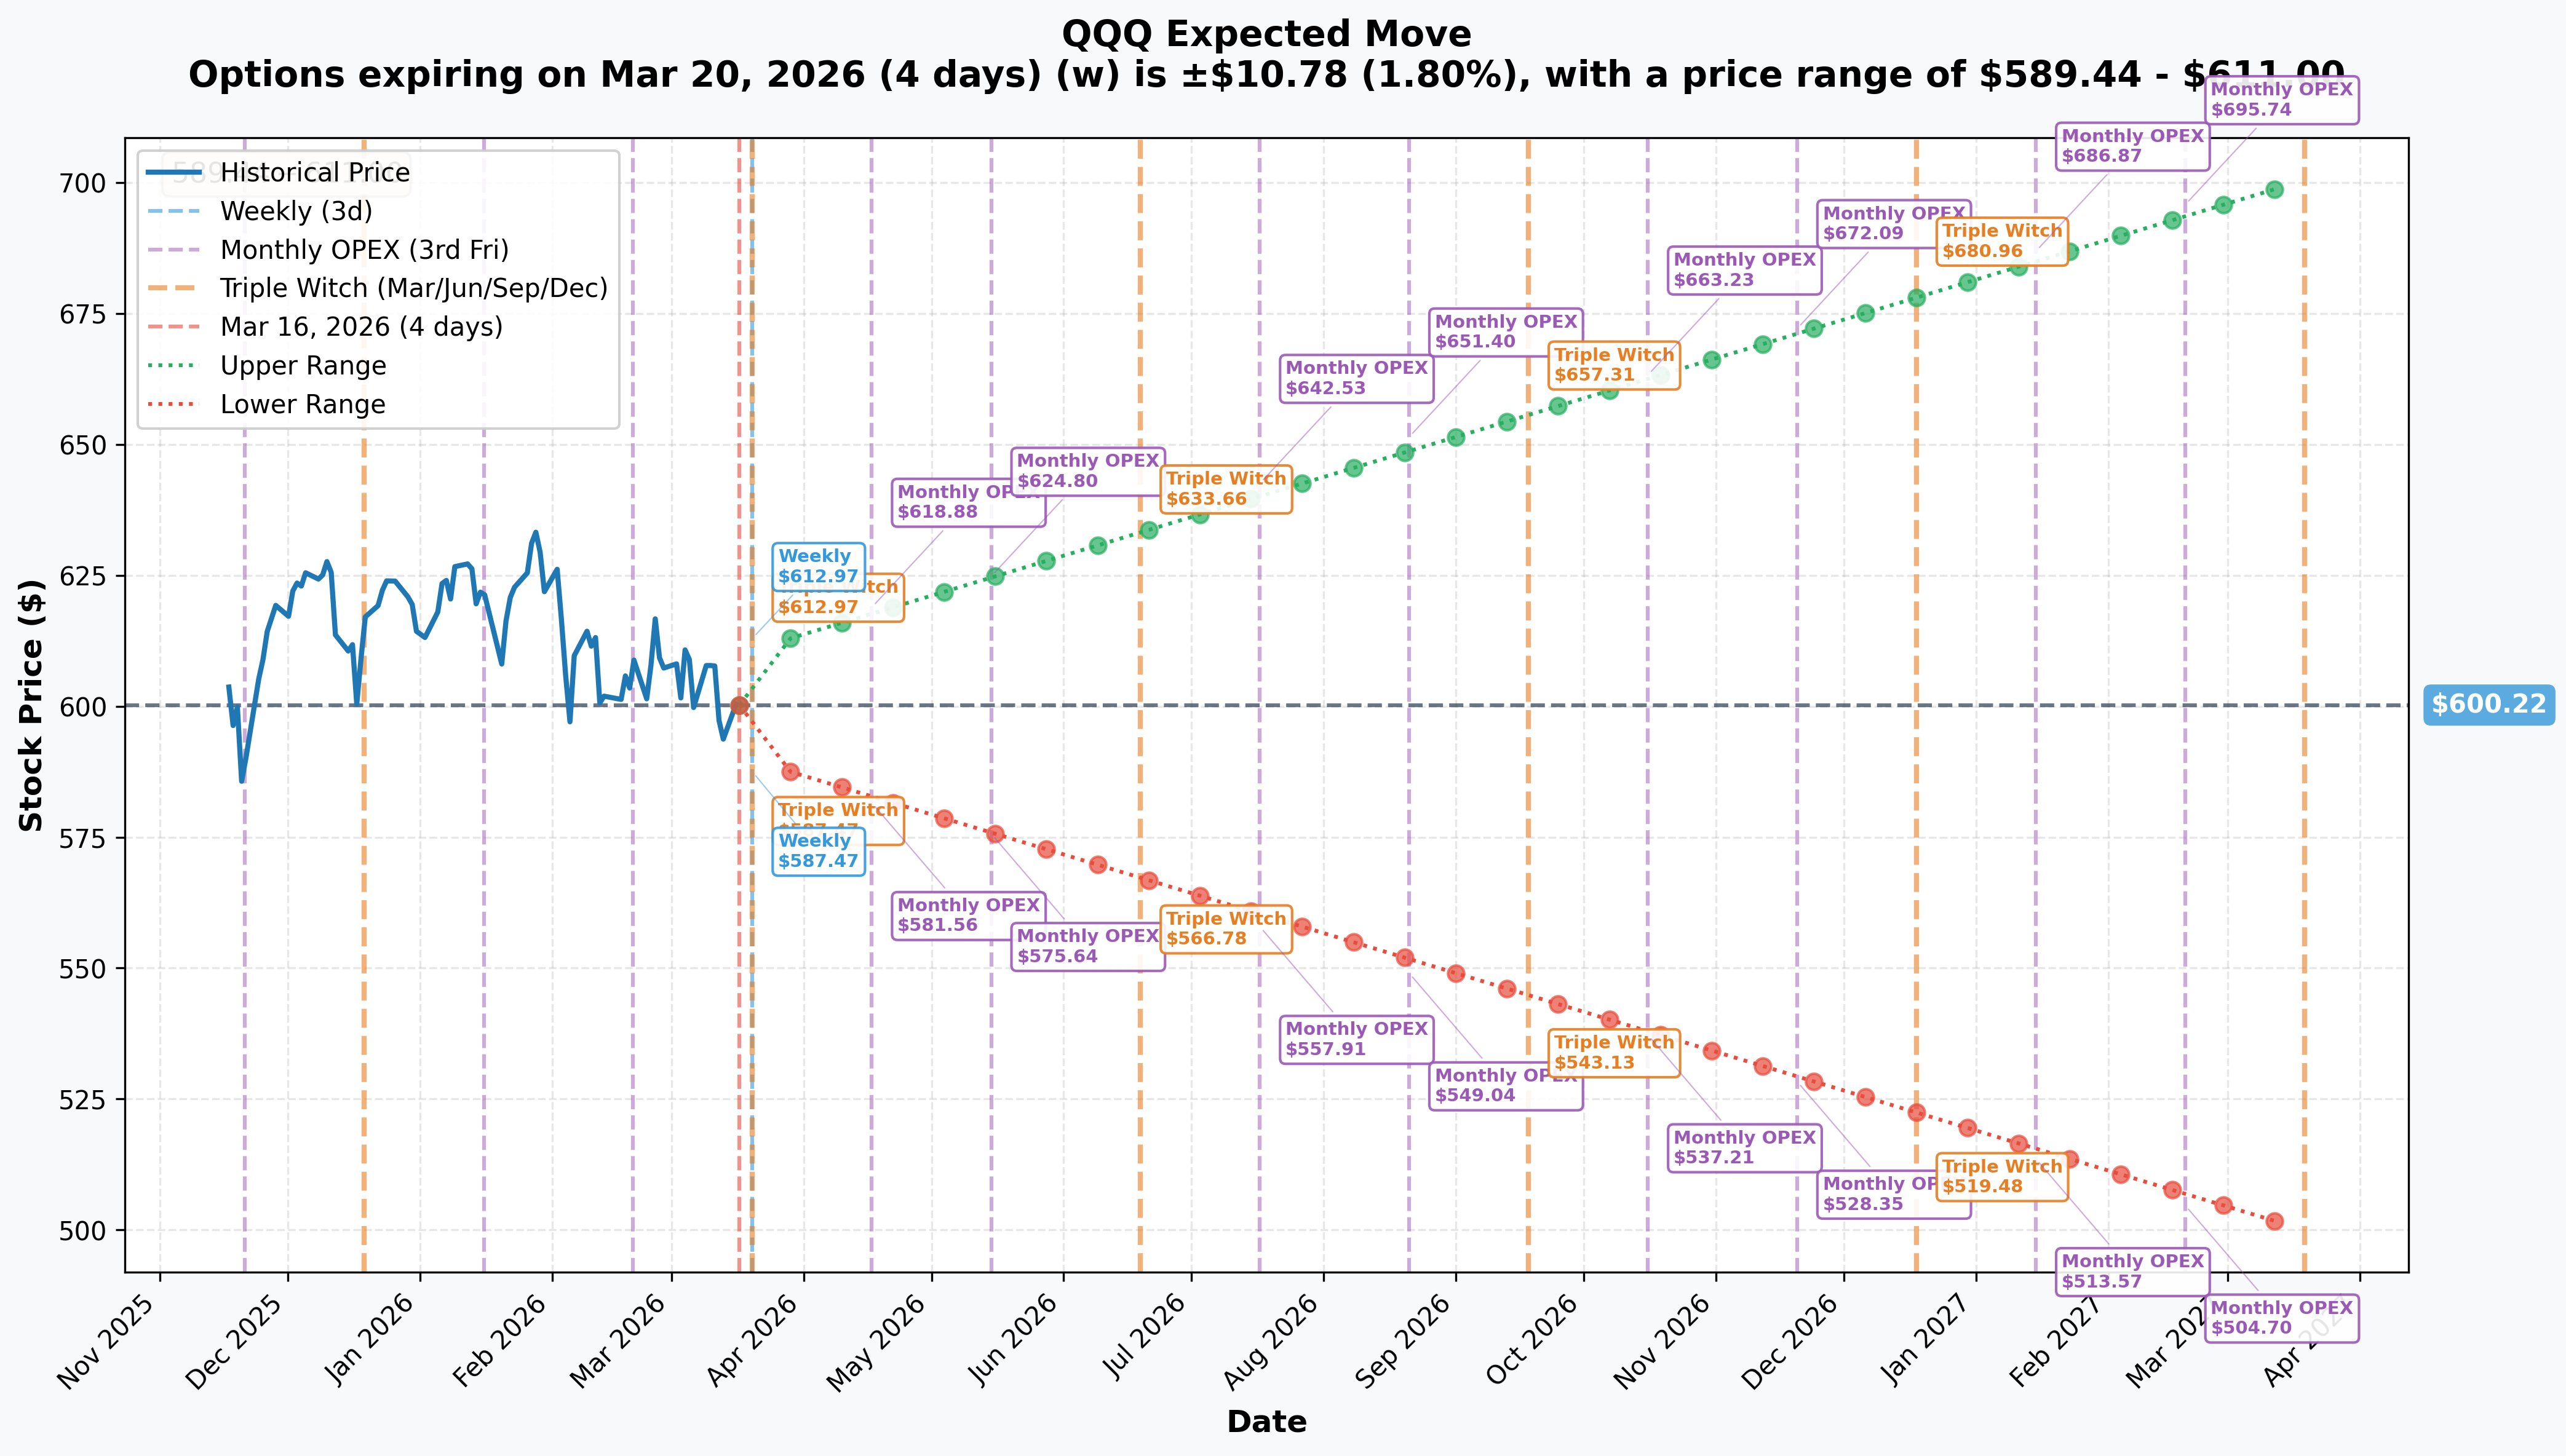
The options market is pricing in a specific range for the March 20 Triple Witch expiration (this Friday — the SAME expiration as the $250M put trade!):
Weekly / Monthly OPEX / Triple Witch (all pointing to March 20, 4 days away):
- 📅 Implied Move: ±$10.78 (±1.8%)
- 📅 Expected Range: $589.44 to $611.00
- 📅 Triple Witch Labels: $587.47 lower — $612.97 upper
Longer-term reference:
- 📅 April 17 Monthly OPEX: $581.56 — $618.88
- 📅 May 15 Monthly OPEX: $575.64 — $624.80
- 📅 June 19 Triple Witch: $566.78 — $633.66
- 📅 LEAPS (1 year out, March 2027): ±$100.45 (±16.74%) → Range $499.77 — $700.67
Translation for regular folks: The options market is saying QQQ should stay between $587.47 and $612.97 through this Friday's expiration. The $250M put buyer purchased strikes from $625 to $650 — ALL of which are above the upper implied move band of $612.97. In plain English: this person paid $250M for puts that are ALREADY deep in-the-money, above even the bull-case implied range. They're not betting on a new crash — they're locking in protection at current intrinsic values before what they see as potential additional downside driven by the FOMC catalyst.
The lower implied bound of $587.47 aligns closely with the first gamma support cluster at $590-$595. If FOMC delivers a hawkish shock (dot plot removes last 2026 rate cut), QQQ hitting the $587-590 zone by Friday is within the market's own implied probability distribution.
🎪 Catalysts
🔥 Already Happened (Past Catalysts Impacting QQQ Now)
Iran Conflict — Began February 28, 2026 📉
The U.S.-Israeli military strikes on Iran began February 28 and triggered a cascade:
- 🛢️ Brent crude surged from ~$72/bbl to over $106/bbl — a 40%+ spike in weeks
- 🌍 Strait of Hormuz disruptions affecting ~20% of global oil transit
- 💻 Iran retaliatory strikes targeted regional data centers; semiconductor supply facing helium risk (Qatar produces 33%+ of global supply critical for chip manufacturing)
- 📉 Global stocks down 5.5% since conflict began; tech hardest hit
- 📊 Higher energy costs projected to add >1% to global CPI annualized
February 2026 CPI: +2.4% YoY (Released March 11)
February CPI came in at +2.4% YoY, core at +2.5% YoY — tame for now, but oil shock from Iran conflict expected to push March CPI materially higher. The Fed can't ignore this.
Labor Market Deterioration
February 2026 jobs report showed LOSS of 92,000 nonfarm payroll jobs with unemployment rising to 4.4% — the first significant labor market crack since the pandemic. Job openings are at their lowest since mid-2020.
The Great Rotation
For the first time since the post-pandemic recovery, the Magnificent Seven are collectively underperforming the broader market. Best-performing YTD sectors are Energy (+23.2%), Materials (+17.7%), Consumer Staples (+15.5%) — all value/inflation plays. Information Technology is down ~2.5% YTD.
Mega-Cap Earnings (All Reported)
- ✅ Nvidia Q4 FY2026: $68.1B revenue (+73% YoY), Q1 guide of $78B — beat but stock has since pulled back
- ✅ Apple Q1 FY2026: Record $143.8B revenue, iPhone China at $25.53B — strong
- ❌ Microsoft Q2 FY2026: Dropped 11% on Azure deceleration (39% vs 40% prior), now down 18% YTD
- ✅ Meta Q4 2025: $58.1B ad revenue (+24% YoY), though $115-135B capex for 2026 raised eyebrows
- ✅ Alphabet Q4 2025: $113.8B revenue, Cloud +47.8% YoY
- ✅ Amazon Q4 2025: AWS grew 24%, but $200B 2026 capex FCF risk looms large
- ✅ Broadcom Q1 FY2026: AI revenue $8.4B (+106% YoY), beat across the board
Tariff Escalation
25%+ tariffs on semiconductors and pharmaceuticals announced February 18, adding an estimated $6.35B in costs to chip importers. EU preparing a $93B retaliatory trade response.
🚀 Upcoming Catalysts (What's Coming Next)
FOMC Meeting — March 17-18, 2026 (TOMORROW AND WEDNESDAY!) 🔴 CRITICAL
This is THE catalyst this $250M put trade is positioned around. Decision at 2:00 PM ET Wednesday March 18, press conference at 2:30 PM.
- 📊 Rate hold at 3.50-3.75% is 92%+ expected — not the main event
- 🎯 The dot plot is everything. The December 2025 dot plot showed one rate cut projected for 2026. Now the Fed must respond to the Iran oil shock AND tariff environment for the first time in their Summary of Economic Projections
- 😰 Hawkish scenario (bad for QQQ): Dot plot removes last projected 2026 cut or hints at possible hike — QQQ could gap down 3-5% Wednesday
- 🚀 Dovish surprise (good for QQQ): Dot plot adds a cut or Powell signals flexibility — QQQ rips back toward $610-615
- ⚠️ Markets are underestimating the Iran conflict's economic impact according to Euronews — oil at $106 is a major inflation wildcard the Fed cannot ignore
March 20, 2026 — Triple Witch Quarterly Expiration 🎢
This Friday is a quarterly options expiration — the biggest expiration of each quarter where stock options, index options, AND futures all expire simultaneously. Massive gamma unwind expected as billions in options settle. QQQ's entire $250M put trade expires here.
April 3, 2026 — March Jobs Report April 10, 2026 — March CPI Report (expected higher from oil shock)
Mega-Cap Tech Q1 2026 Earnings Season — Late April The next major fundamental test for QQQ. Tech sector expected to show +23.7% earnings growth but that's before full Iran oil-shock cost pass-through is felt:
| Company | Expected Date | Key Risk |
|---|---|---|
| Amazon (AMZN) | April 23 | FCF negative with $200B capex; AWS growth |
| Tesla (TSLA) | April 28 | Delivery weakness, margin pressure |
| Alphabet (GOOGL) | April 28 | Search share, Cloud growth deceleration |
| Microsoft (MSFT) | April 29 | Azure 37-38% guide — can it hold? |
| Apple (AAPL) | ~April 30 | China momentum, tariff cost exposure |
| Meta (META) | Late April | $115-135B capex — investors want ROI proof |
June 16-17, 2026 — FOMC with Second Dot Plot Update If Iran conflict de-escalates and oil normalizes, this is when a dovish pivot could finally emerge. Potential window for first rate cut signal.
🎲 Price Targets & Probabilities
Using the gamma levels, implied move data, the FOMC catalyst, and the Iran/tariff macro context:
📉 Bear Case (40% probability this week)
Target: $570-$587
How we get there:
- 😰 FOMC Wednesday removes last projected 2026 rate cut — "higher for longer" confirmed
- 🛢️ Powell's statement acknowledges oil shock as an inflation risk requiring caution
- 📉 QQQ breaks the critical $600 gamma support — the put gamma wall at $600 ($472M total GEX) flips from floor to ceiling
- 🔥 Triple Witch amplifies the move as massive put open interest accelerates selling pressure
- 📊 Lower implied move bound is $587.47 — the options market itself prices this as a plausible outcome
- 🎯 Gamma support at $595 ($114.6M), then $590 ($218.2M) would be speed bumps
- 📉 The $250M put ladder starts printing maximum intrinsic value with strikes at $625-650 all well ITM
This is the put buyer's profit scenario. The $630 puts (the largest leg at $135M) have $29.66 intrinsic value at $600.63 today. If QQQ falls to $580, those puts are worth ~$50 — the buyer almost doubles their intrinsic position value in a week.
🎯 Base Case (45% probability)
Target: $587-$605 (Tight range, chop through FOMC and Triple Witch)
Most likely near-term path:
- ✅ Fed holds rates as expected, dot plot shows minimal change (keeps 1 cut for 2026)
- 📊 Market reacts with brief relief rally but remains capped by the overhead gamma walls at $605 and $610
- 🎢 QQQ grinds sideways to slightly lower through Triple Witch as the massive put ladder creates dealer hedging pressure
- 🔄 Implied move range of $589.44-$611.00 largely respected
- 💰 The $250M put trade expires with significant intrinsic value but limited profit over the purchase price — effectively functioning as insurance that wasn't fully "needed" but wasn't wasted either
- 📉 After OPEX and gamma unwind, QQQ resumes the weekly/monthly downtrend with next stop $575-$580
🚀 Bull Case (15% probability)
Target: $610-$615
What it takes:
- 🎉 Fed surprises with dovish language — Powell says oil spike is "transitory," signals rate cut flexibility returns
- 🌍 Geopolitical de-escalation signals emerge from Iran negotiations
- 📈 Short-covering rally triggers through $601 gamma resistance up to $610 (next ceiling at $151.8M)
- 🎯 Triple Witch "pin" gravitates toward $600-$605 zone where maximum options time value decay occurs
- 💔 The $250M put trade would lose significant value here as ITM puts lose intrinsic value — an expensive hedge that didn't pay off
- 📊 Wall Street consensus price target for QQQ of $767.04 implies 29% upside from current levels — bulls argue this correction is a buying opportunity
💡 Trading Ideas
🛡️ Conservative: Ride the Wave, Don't Fight It
The "Sleep Well Through FOMC" Strategy
Play: Buy QQQ April 17 put spreads after Wednesday's FOMC decision
Structure: Wait for Fed decision Wednesday. If hawkish (dot plot goes to zero cuts), buy the $590/$580 put spread expiring April 17, 2026.
Why this works:
- ⏰ You don't trade BEFORE the binary event — you wait for the catalyst to show its hand
- 📊 If dot plot is hawkish, the $590-$580 zone is the next major gamma support cluster below — a logical destination
- 💰 Post-FOMC IV may spike briefly then normalize; spread structure limits cost to ~$3-5 debit
- 🛡️ Max loss is defined: you lose only what you paid for the spread
- 📅 April 17 expiration captures the full fallout through March jobs (April 3) and CPI (April 10) catalysts
- 🎯 April 17 lower implied bound sits at $581.56 — this spread is designed to profit within the market's own expected range
Estimated cost: $3-5 per spread | Max profit: $5-7 per spread at $580 or below Probability of profit (if hawkish FOMC): ~50-60% Risk level: Low — defined risk, no overnight surprises, entry AFTER the main catalyst resolves
Skip this trade if: Powell is dovish — that changes the whole setup. Watch the presser at 2:30 PM Wednesday.
⚖️ Balanced: Shadow the Whale at a Fraction of the Cost
The "Mini Whale" Strategy
Play: Buy a QQQ March 20 put / Triple Witch put spread to capitalize on immediate downside if FOMC disappoints
Structure: Buy the $600 put / Sell the $590 put — both expiring March 20, 2026
Why this works:
- 🐋 You're positioning at the same critical $600 gamma support level the $250M trade is exploiting — the most important level on the entire gamma map
- 💸 Buying a spread is dramatically cheaper than buying naked puts — the $600/$590 spread costs maybe $3-5 vs $29+ for the $600 put alone
- 📊 If QQQ breaks $600 into FOMC and goes toward $590 by Friday's close — this spread pays full value
- 🎯 Maximum risk is the spread debit — you can only lose what you paid
- ⏰ 4-day expiration means theta works against you but the FOMC catalyst is a legitimate high-vol event
- 🔥 The $600 level is the single highest gamma node in the entire QQQ landscape — a break triggers mechanical dealer selling that could accelerate the move toward $590
Estimated cost: ~$3-5 per spread | Max profit: $5-7 at $590 or below by Friday Breakeven: ~$595-597 Probability of profit: ~35-45% (requires FOMC hawkish reaction AND $600 break) Risk level: Moderate — defined risk but near-expiration volatility can be extreme; use only 1-3% of portfolio
Important: If FOMC is dovish, exit immediately. Don't hold a 4-day spread against a ripping market.
🚀 Aggressive: Sell the FOMC Volatility (Premium Collection Play)
The "Collect While Others Panic" Strategy
Play: Sell a QQQ strangle using April 17 expiration AFTER Wednesday's FOMC decision and subsequent volatility spike
Structure: Sell the $575 put / Sell the $630 call — April 17, 2026 expiration
Why this works:
- 💰 FOMC announcements spike implied volatility — selling premium right after the catalyst when IV is elevated lets you collect inflated premium
- 📊 The $575/$630 strikes are just outside the implied move bands for April 17 ($581.56 lower / $618.88 upper) — you're being paid to take on risk outside what the market expects
- 🎯 The April 17 strangle collects theta daily as QQQ gravitates toward the high-gamma $600 zone
- 🛡️ Max profit if QQQ stays in the $575-$630 range through April 17 expiration
- 📈 The $630 call strike is where the $250M institutional put trade is structured — heavy put positioning at $630 suggests price is unlikely to RALLY above there this cycle
Estimated credit received: ~$15-25 per strangle (combined premium) Profit range: $575 to $630 (wide, ~9% width around current price) Breakeven: $550 to the downside, $655 to the upside Max loss: Theoretically large on either side if QQQ makes an extreme move — THIS IS THE RISK Probability of profit: ~55-65% (if QQQ stays range-bound between FOMC and April OPEX)
CRITICAL WARNING: Naked short options have unlimited theoretical risk. The $575 short put has severe downside if Iran conflict escalates dramatically (QQQ gaps to $540-560). Only experienced traders with proper margin accounts and defined stop-loss discipline should attempt this. Use position sizing of no more than 1-2% of portfolio notional exposure. Consider adding a long $555 put and long $645 call to convert to a defined-risk iron condor if margin is a concern.
⚠️ Risk Factors
Don't get caught off-guard by these real dangers:
-
🔴 FOMC binary event Wednesday — coin flip risk: The March 18 dot plot is genuinely two-sided. Rate hold is near-certain, but the dot plot could remove the last projected 2026 cut — that would be a significant negative for growth stocks. Alternatively, Powell could maintain dovish flexibility. ANY position taken before Wednesday is a directional coin flip on Fed language.
-
🛢️ Iran conflict escalation or de-escalation is unpredictable: Oil at $106/bbl is the silent killer for tech multiples. If the Strait of Hormuz conflict widens, energy costs push CPI above 3%, the Fed's hands are tied. Semiconductor supply chains face helium shortages from Qatar that could directly hit Nvidia and AVGO production. But a ceasefire could trigger a vicious short-covering rally that destroys bearish positions.
-
🎢 Triple Witch amplification: Friday March 20 is quarterly expiration. The $250M in new put open interest, combined with existing positions, means dealer hedging flows will be enormous. Markets can "pin" to specific strikes OR make exaggerated moves compared to normal weeks — volatility should be expected to remain elevated through Friday's close.
-
🤖 AI ROI debate hasn't resolved: The combined hyperscaler AI capex of $635-665B in 2026 with free cash flow potentially dropping up to 90% is the structural cloud over the Nasdaq. Amazon projected to turn FCF negative in 2026. DeepSeek V4 potentially releasing this month adds another dose of "AI ROI skepticism" risk.
-
📉 Microsoft's 18% YTD decline is a weight on QQQ: Microsoft is now down 18% YTD as one of QQQ's largest components. Azure growth decelerating from 39% to 37-38% guided undermines the hyperscaler growth narrative. Microsoft has an OpenAI concentration risk (45% of $625B backlog from OpenAI alone).
-
💸 Semiconductor tariff finalization: The 25%+ broad semiconductor tariff announced February 18 is still pending full implementation. When fully enforced, $6.35B in additional costs hit chip importers — that's directly negative for QQQ's largest components (NVDA, AVGO, AMD).
-
🔄 Great Rotation has momentum: The structural rotation from Mag 7 tech into Energy, Materials, and Industrials has been running since January. Capital is chasing sectors that benefit from inflation and domestic manufacturing narratives. This isn't a single news event — it's a multi-month repositioning that isn't over.
-
📊 QQQ concentration risk: The top 10 holdings represent ~48% of assets. MSFT alone down 18% YTD is a serious structural drag. When the biggest fish get sick, the whole pond feels it.
🎯 The Bottom Line
Real talk: Someone just paid $250.6 MILLION for 4-day puts on the Nasdaq 100. Not 4 months. Not 4 weeks. 4 days. That's not cheap insurance — at those option prices, that money vanishes completely if QQQ doesn't cooperate by Friday. This is a bold, definitive statement from an institution that sees a real risk of a meaningful Nasdaq move before this Friday's Triple Witch expiration.
What this trade tells us:
- 🎯 The $630 strike ($135M primary position) suggests this institution considers $600-$630 the risk zone they want covered — not a crash to $500, but a controlled breakdown of 5-8% from $630 down to $590-$600
- 💰 All 6 strikes are already in-the-money — this is high-conviction protection, not a lottery ticket
- ⚖️ The simultaneous execution across 6 different strikes (a ladder structure) is a sophisticated approach that maximizes delta exposure while distributing risk across a range of outcomes
- 📅 The FOMC Wednesday + Triple Witch Friday combination creates a two-day window of extreme potential volatility — the put buyer clearly saw this as the moment to put on max protection
If you're long QQQ or Nasdaq-heavy stocks:
- ✅ Consider trimming risk ahead of Wednesday's FOMC — the dot plot is genuinely unpredictable this cycle given the Iran oil shock
- 📊 Watch $600 on QQQ closely — it's the single biggest gamma support level and a break below it could trigger accelerated selling toward $590 and $580
- 🛡️ If you want insurance like the institution, a smaller version of this trade — buying the March 20 $595-$590 put spread for $2-4 — captures the most critical support break scenario
- ⏰ Mark Wednesday 2:00 PM ET on your calendar — that's the moment of truth for the near-term QQQ direction
If you're on the sidelines:
- 📅 Wait for FOMC Wednesday to confirm the direction before committing capital
- 🎯 Post-FOMC clarity ($587-$590 on the downside OR $610-$615 on the upside) gives you a better entry with defined risk
- 📈 QQQ's long-term bull case remains intact — analyst consensus 12-month target of $767 implies 28% upside. The AI buildout ($635-665B in hyperscaler capex) is real. This is correction territory, not collapse territory.
- 🔄 After Triple Witch clears and FOMC is behind us, the risk/reward for a recovery trade improves significantly
If you're bearish on the Nasdaq:
- 🎯 The gamma structure says $595, $590, $580, and $575 are the next floors after $600 breaks
- 📉 The most crowded short-term bearish scenario is a break of $600 support into FOMC on Wednesday, followed by a triple-witch amplified move toward $587-$590 by Friday
- ⚠️ Don't overstay: the $250M institutional put trade expires Friday. When that gamma unwinds after expiration, the mechanical selling pressure disappears — Monday March 23 could look very different
Mark your calendar — Key dates this week:
- 📅 March 17 (Monday) — FOMC meeting begins; watch for pre-meeting positioning
- 📅 March 18 (Wednesday) 2:00 PM ET — Fed rate decision + dot plot (THE moment)
- 📅 March 18 (Wednesday) 2:30 PM ET — Powell press conference (crucial language parsing)
- 📅 March 20 (Friday) — Triple Witch quarterly expiration; $250M put trade expires
- 📅 April 3 — March jobs report
- 📅 April 10 — March CPI (expected to be elevated from Iran oil spike)
- 📅 April 23-30 — Mega-cap tech Q1 earnings season begins
Final verdict: The $250.6M put ladder is a rare and emphatic signal from someone managing serious institutional capital. They see enough risk in the next 4 trading days — FOMC dot plot + Triple Witch — to spend a quarter billion dollars on downside protection. That's not panic. That's discipline. Respect the message, manage your risk, and let the FOMC catalyst show its hand before making aggressive new bets in either direction.
The Nasdaq is not broken. But it is at a critical technical and macro crossroads. Trade accordingly. 💪
Disclaimer: Options trading involves substantial risk of loss and is not suitable for all investors. This analysis is for educational and informational purposes only and does not constitute financial advice or a recommendation to buy or sell any security. Past performance does not guarantee future results. The unusual options activity described reflects large institutional trades that may represent hedging, speculation, or complex portfolio management strategies not applicable to retail investors. Options can expire worthless, and buyers can lose 100% of their premium. Always consult a licensed financial professional before trading. The FOMC decision and geopolitical events described carry binary risk that can result in rapid, substantial losses. Position sizing should reflect your individual risk tolerance and financial situation.
About QQQ — Invesco QQQ Trust: The Invesco QQQ Trust is an exchange-traded fund that tracks the Nasdaq-100 Index, holding the 100 largest non-financial companies listed on the Nasdaq exchange. With approximately $387-392 billion in assets under management, QQQ is one of the world's most actively traded ETFs, with top holdings including Apple, Microsoft, Nvidia, Amazon, Meta, Alphabet, Broadcom, and Tesla. The fund closed 2025 up +19.45% and is down approximately 2% YTD in 2026 following a 12.6% correction from mid-February all-time highs.