RBLX Position Closing - $5.8M in Puts Exiting Before Expiration
January 22, 2026 | Position Management Activity Detected
The Quick Take
Someone just closed out $5.8M worth of RBLX put positions this morning with these contracts expiring TOMORROW (January 23rd). The trade tape shows a $4M sale of short puts at the $83 strike and a $1.8M closeout of long puts at $78 - both tagged as closing orders with MEDIUM confidence. With RBLX trading at $74.85 and Q4 earnings just 14 days away on February 5th, this is smart position management rather than a directional bet. Translation: Institutional traders are tidying up their books before tomorrow's expiration!
Company Overview
Roblox Corporation (RBLX) is the dominant player in user-generated gaming platforms with massive global reach:
- Market Cap: $53.12 Billion
- Industry: Services - Prepackaged Software
- Current Price: $74.85
- Primary Business: Free-to-play online video game platform with ~150M daily active users enabling creators to build games while generating revenue through in-game purchases (Robux) and advertising
The Option Flow Breakdown
The Tape (January 22, 2026)
| Date | Time | Symbol | Buy/Sell | Call/Put | Expiration | Strike | Volume | Premium | Order Type | Strategy | Confidence | Z-Score | Classification |
|---|---|---|---|---|---|---|---|---|---|---|---|---|---|
| 2026-01-22 | 10:54:15 | RBLX | BUY | PUT $78 | 2026-01-23 | $78 | 5,100 | $1.8M | BTC | Close Long Put | MEDIUM | 1.97 | ABOVE_AVERAGE |
| 2026-01-22 | 10:54:15 | RBLX | SELL | PUT $83 | 2026-01-23 | $83 | 4,600 | $4.0M | STC | Close Short Put | MEDIUM | 3.65 | EXTREMELY_UNUSUAL |
What This Actually Means
This is position management ahead of tomorrow's expiration! Here's the breakdown:
-
$83 Put Sale (STC - Sell to Close): This trader was SHORT the $83 puts (sold them earlier) and is now buying them back to close for $4M. With RBLX at $74.85, these puts are $8.15 in-the-money. The seller likely pocketed premium when RBLX was higher and is now closing at a loss, OR this was part of a spread where the other leg expired worthless.
-
$78 Put Buy (BTC - Buy to Close): This trader was LONG the $78 puts and is now selling them to close for $1.8M. With RBLX at $74.85, these puts are $3.15 in-the-money. This is profit-taking on a winning bearish position.
Unusual Score Breakdown:
- $83 Put: Z-Score of 3.65 = EXTREMELY_UNUSUAL (only happens a few times per month)
- $78 Put: Z-Score of 1.97 = ABOVE_AVERAGE (notable but not extraordinary)
- Volume/OI ratios above 0.8 for both trades indicate HIGH ACTIVITY relative to open interest
What's happening here: Both trades executed at the SAME TIME (10:54:15) suggesting coordinated position management - possibly the same trader unwinding a put spread structure. With expiration tomorrow, any in-the-money options would face assignment risk. These traders are choosing to close cleanly rather than deal with stock delivery mechanics.
Technical Setup / Chart Check-Up
YTD Performance Chart
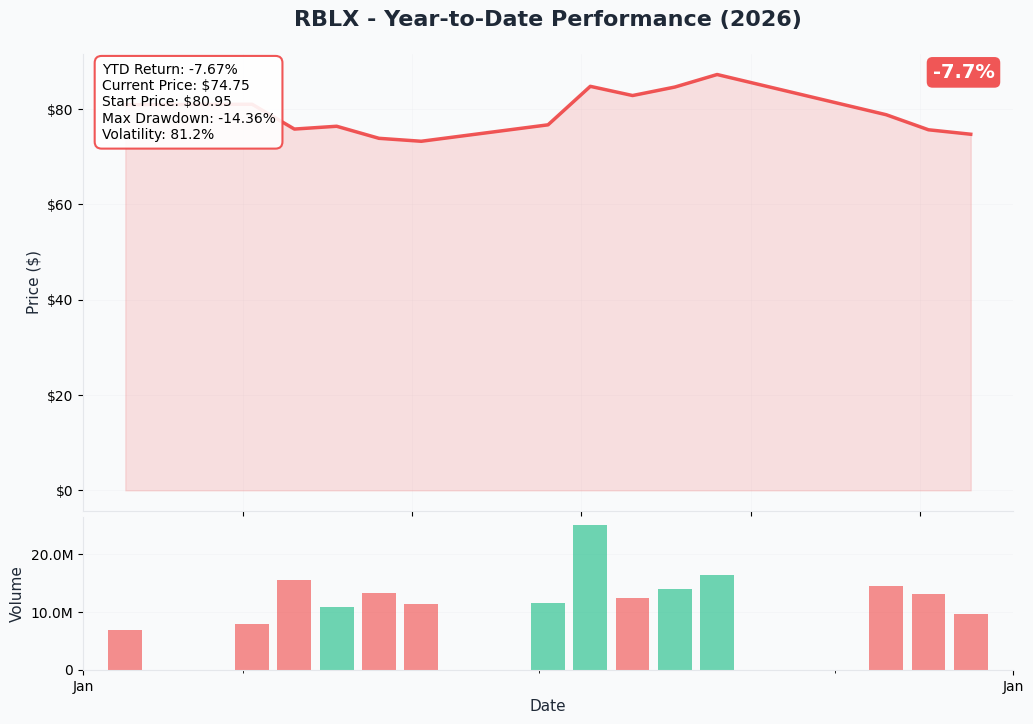
RBLX has had a wild ride - starting January near $81 before dropping approximately 6% to current levels around $74-75. Looking back at the past year:
Key observations:
- 52-Week Range: $50.10 - $150.59 (massive swing!)
- All-Time High: $141.56 hit on September 29, 2025
- Recent Volatility: Stock gained nearly 11% on January 13, 2026 on favorable analyst feedback
- YTD Performance: Down approximately 6% from year start
- Current Status: Trading near the lower end of recent range, 47% below September highs
Gamma-Based Support & Resistance Analysis
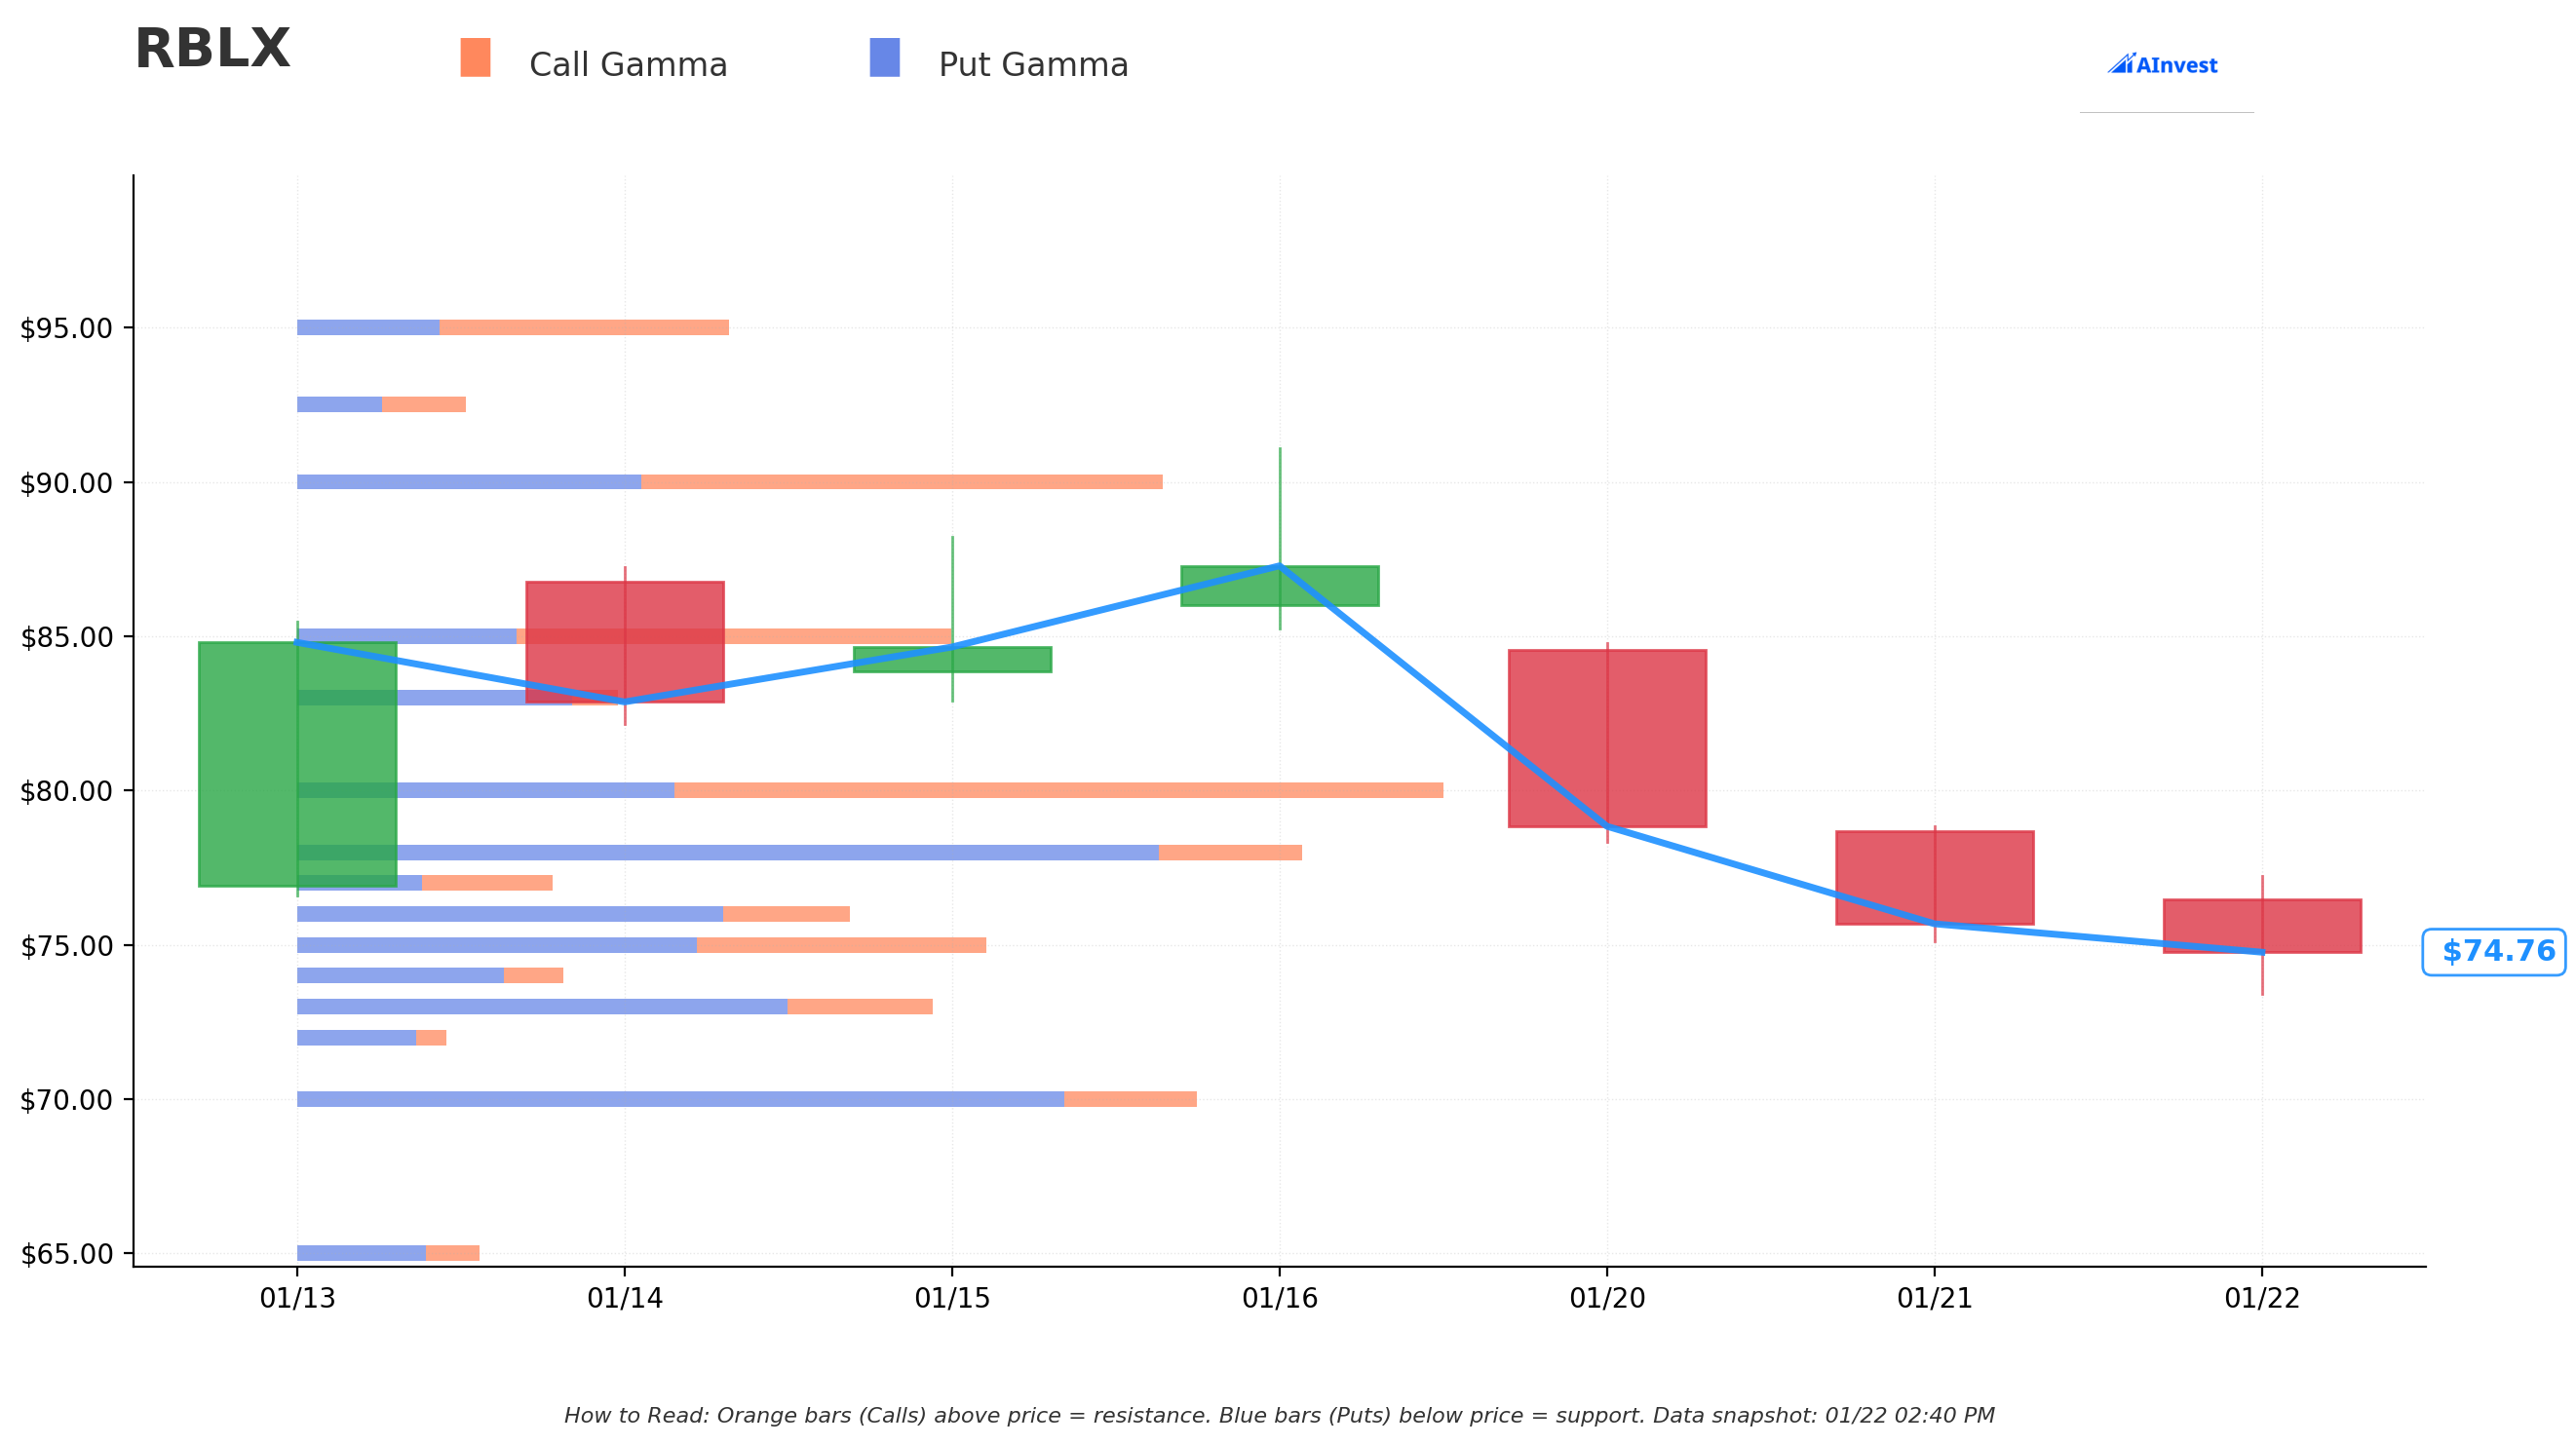
Current Price: $74.85
The gamma exposure map reveals critical price magnets and barriers:
Support Levels (Put Gamma Below Price):
- $74 - Immediate support with 1.16B total gamma exposure (Net GEX: -0.64B = put-heavy, dealers buy dips here)
- $73 - Secondary support at 2.76B total gamma (Net GEX: -1.50B = strong floor)
- $70 - Major structural floor with 3.91B gamma (Net GEX: -2.75B = THE LINE IN THE SAND)
Resistance Levels (Call Gamma Above Price):
- $75 - Immediate ceiling with 2.99B total gamma (Net GEX: -0.49B)
- $76 - Light resistance at 2.40B gamma (Net GEX: -1.30B)
- $77 - Minor level at 1.11B gamma (Net GEX: +0.03B = balanced)
- $78 - Major ceiling at 4.36B gamma (Net GEX: -3.12B = dealers sell into rallies) - THIS IS THE PUT TRADE STRIKE!
- $80 - Strong resistance with 4.98B gamma (Net GEX: +1.70B = call-heavy)
- $83 - Secondary resistance at 1.39B gamma - THIS IS THE OTHER PUT TRADE STRIKE!
- $85 - Extended target at 2.84B gamma (Net GEX: +0.93B)
What this means for traders: RBLX is trading in a TIGHT channel between $74 support and $75 resistance. The overall Net GEX Bias is BEARISH (29.4B put gamma vs 24.5B call gamma), which means dealers are positioned to amplify downward moves and resist rallies.
Notice the connection: The put trade strikes at $78 and $83 align perfectly with key gamma levels. The $78 strike sits at 4.36B gamma (second highest resistance level), while $83 sits at a minor but notable level. Traders were positioned for a move toward these levels that didn't materialize - now they're closing before expiration.
Implied Move Analysis
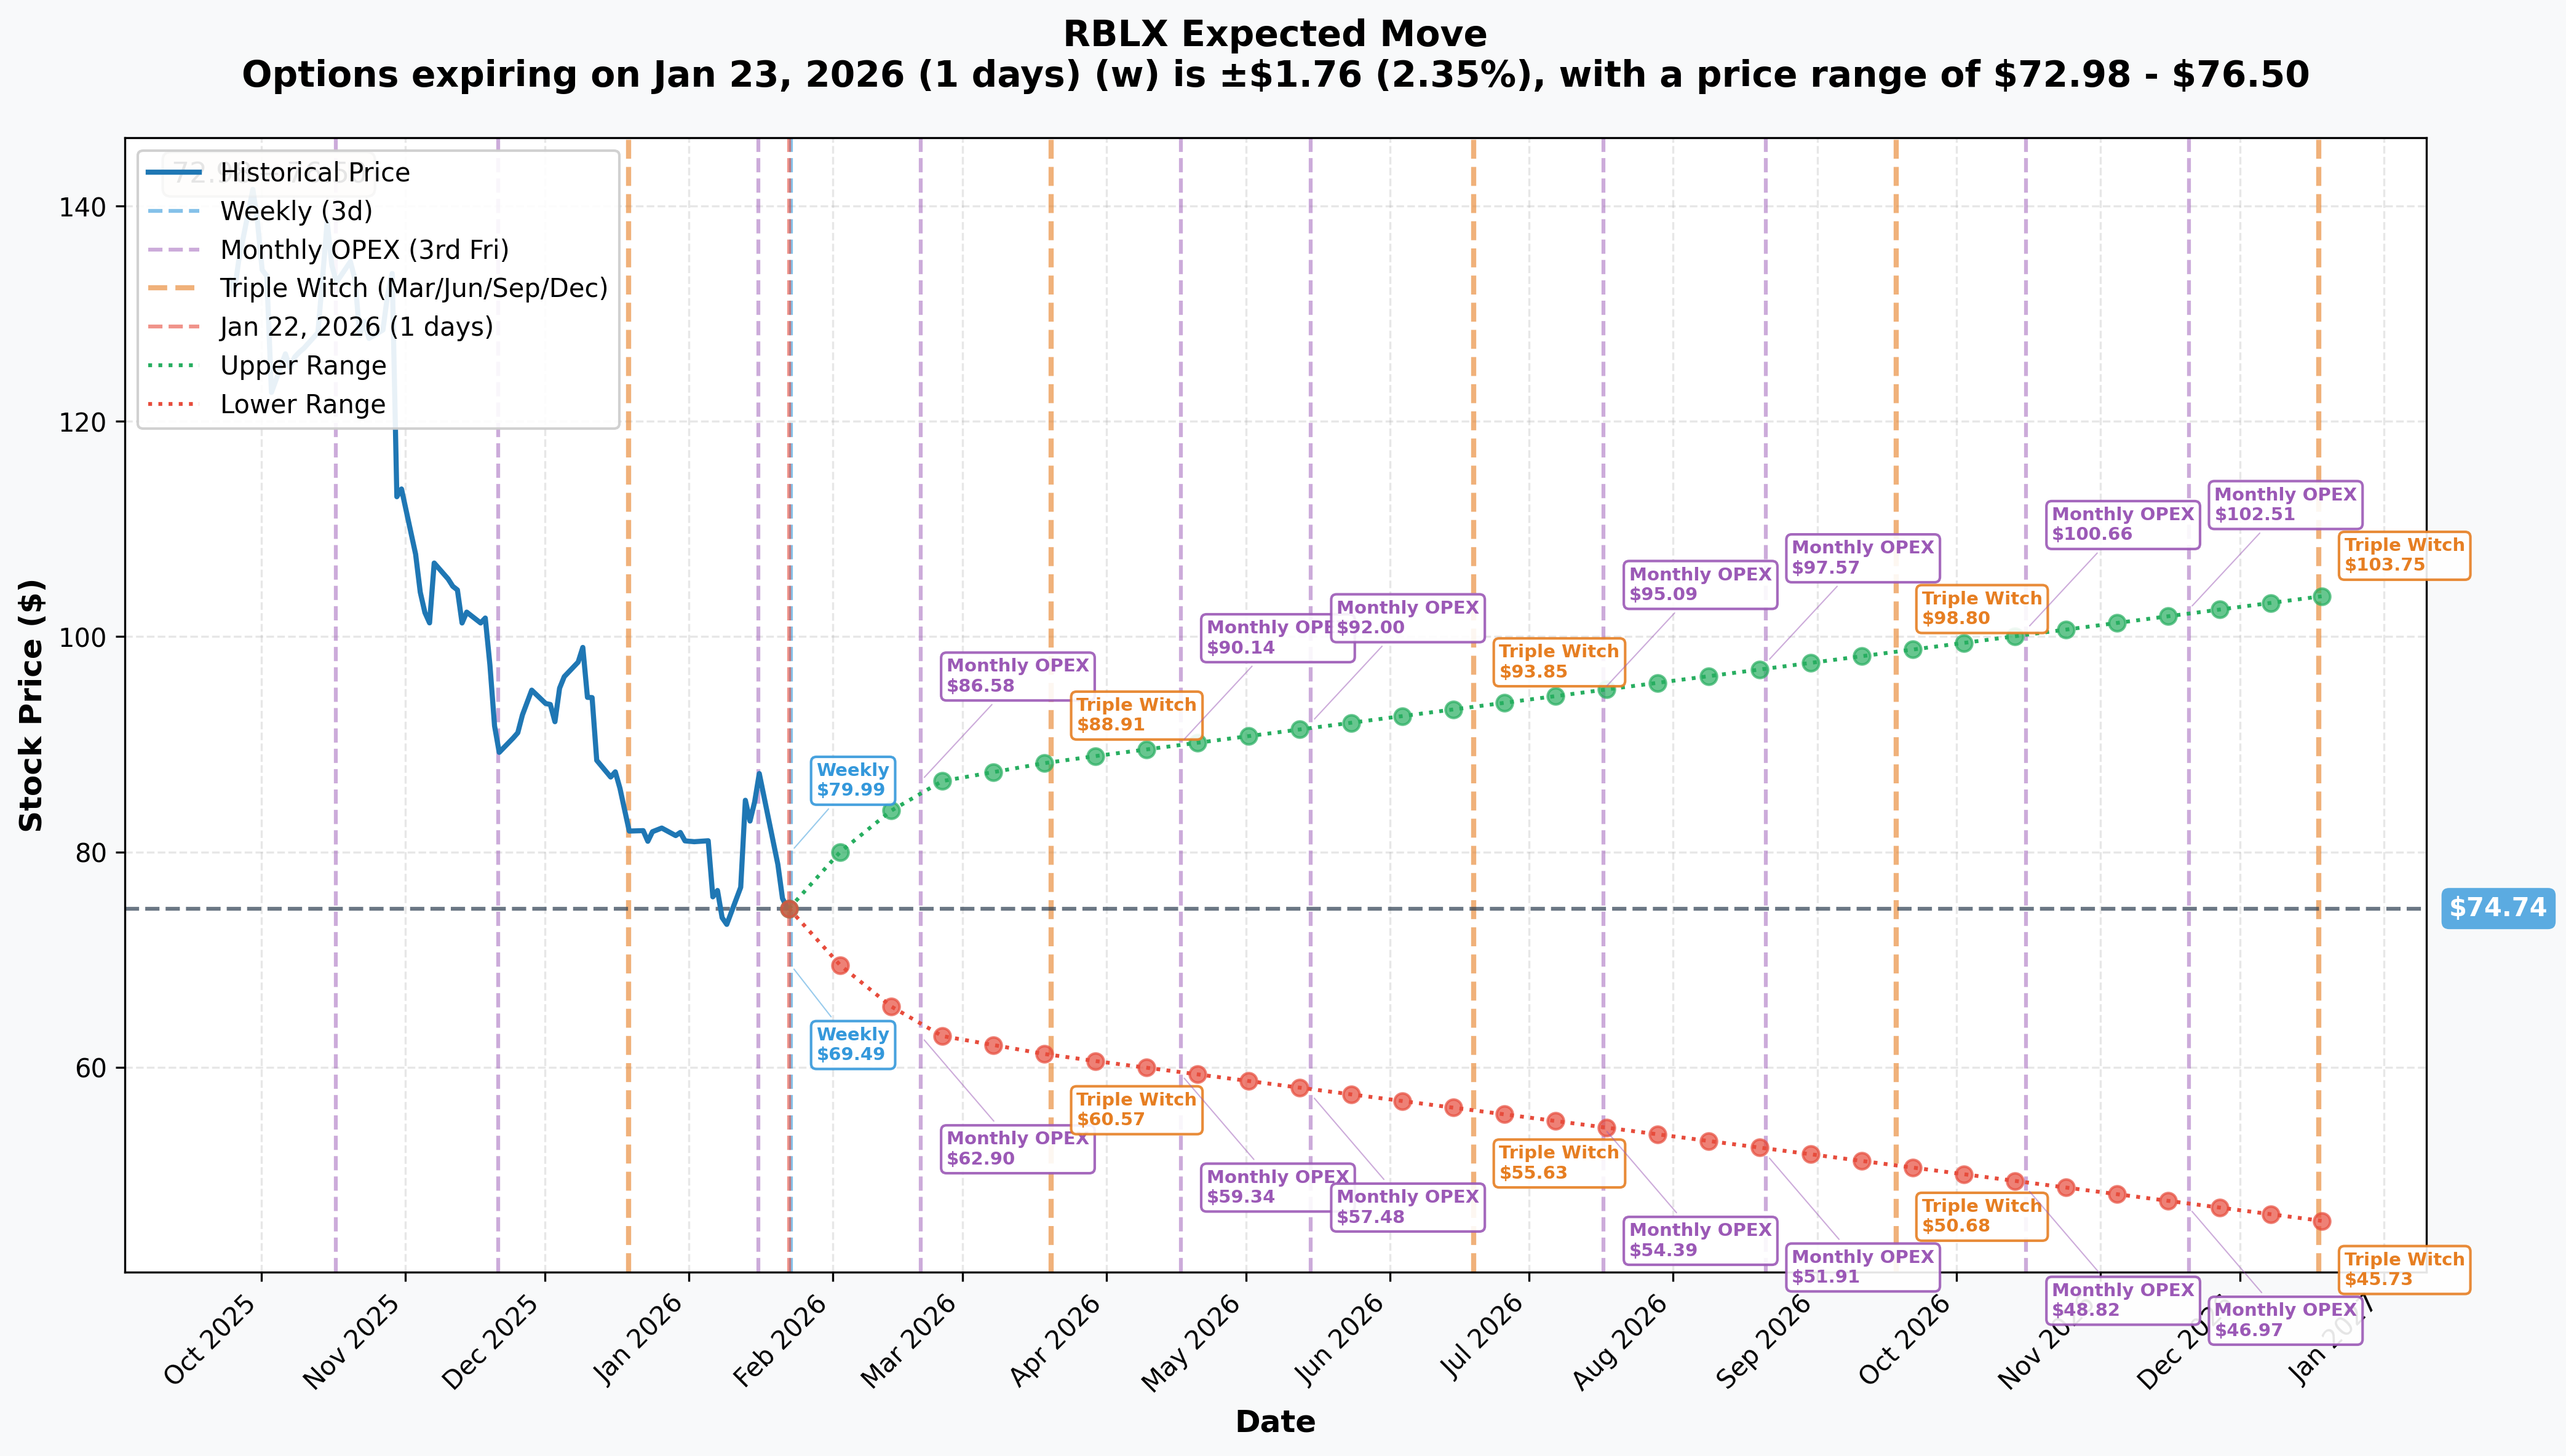
Options market pricing for upcoming expirations:
| Timeframe | Expiry Date | Days Out | Implied Move % | Implied Move $ | Range |
|---|---|---|---|---|---|
| Weekly | 2026-01-23 | 1 | 2.35% | $1.76 | $72.98 - $76.50 |
| Monthly OPEX | 2026-02-20 | 29 | 15.44% | $11.54 | $63.20 - $86.28 |
| Triple Witch | 2026-03-20 | 57 | 18.28% | $13.66 | $61.08 - $88.40 |
| LEAPS | 2026-12-18 | 330 | 38.81% | $29.01 | $45.73 - $103.75 |
Translation for regular folks: Options traders expect a modest 2.35% move ($1.76) by tomorrow's expiration - that's the range these puts are playing in. But looking out to February earnings (February 5), the market is pricing in a MASSIVE 15%+ move with a range of $63-$86. The market expects FIREWORKS around Q4 earnings!
Key insight: The monthly implied move of 15.44% into February earnings reflects significant uncertainty around Roblox's 2026 guidance and profitability trajectory. Given the company's history of widening losses despite strong user growth, this volatility premium is justified.
Catalysts
Upcoming Catalysts (Next 30 Days)
Q4 2025 / Full Year 2025 Earnings - February 5, 2026 (14 DAYS AWAY!) [Source: Roblox IR, Yahoo Finance]
Consensus Estimates:
- Q4 Revenue: $1.72B
- Q4 Bookings: $2.24B (TD Cowen estimate, +65% YoY)
- FY26 Bookings Estimate: $8.09B (TD Cowen, revised down from $8.48B)
Key Metrics to Watch:
- DAU growth trajectory (hit 151.5M in Q3, targeting continued expansion)
- APAC monetization progress (ABPDAU gap: US $40.18 vs APAC $5.27)
- 2026 guidance and margin outlook (management projects slight compression)
- DevEx payout trajectory (hit record $427.9M in Q3)
Regulatory Milestones:
- Brazil online safety law takes effect March 2026
- UK Online Safety Act compliance ongoing (fines up to 10% of global revenues)
Past Catalysts (Last 3 Months)
Q3 2025 Results (October 30, 2025):
- Revenue: $1.36B (+48% YoY)
- Bookings: $1.92B (+70% YoY), surpassing $1.7B analyst projections
- Net Loss: $257M (widened from $240M YoY)
- DAUs: 151.5M (+70% YoY), record high
CES 2026 Advertising Announcements (January 2026):
- New "Homepage Feature" CPM-based ad format in closed beta
- Expanded programmatic partnerships: Amazon DSP, Liftoff, Index Exchange, Magnite, PubMatic
- Rewarded Video format live across 400+ experiences, 90%+ completion rates
Analyst Activity:
- Goldman Sachs upgraded to Buy, raised PT to $180 (Street high)
- JPMorgan downgraded to Neutral, PT cut to $100 from $145
- Jefferies cut PT to $85 on 2026 growth concerns
- Consensus: Buy (72% Buy, 27% Hold), Average PT: $132-$145
Price Targets & Probabilities
Using gamma levels, implied move data, and upcoming catalysts, here are the scenarios:
Bull Case (25% probability)
Target: $85-$90
How we get there:
- Q4 earnings crush expectations with bookings above $2.2B and surprise profitability improvements
- 2026 guidance surprises to upside with margin expansion commentary
- APAC monetization accelerating faster than expected (closing the ABPDAU gap)
- AI tools and advertising revenue providing meaningful contribution
- Break above $80 gamma resistance triggers technical rally to $85-$90
Key metrics needed:
- Bookings growth sustaining 50%+ into 2026
- Path to profitability articulated with specific timeline
- DAUs continuing toward 160M+ trajectory
- Regulatory headwinds manageable without major margin impact
Base Case (50% probability)
Target: $70-$80 range (CHOPPY CONSOLIDATION)
Most likely scenario:
- Solid Q4 earnings meeting consensus (~$1.7B revenue, $2.0-2.1B bookings)
- 2026 guidance in-line with analyst expectations (~21% bookings growth)
- Continued losses with margin compression as guided
- Trading within gamma support ($70-$74) and resistance ($78-$80) bands
- Market digests strong 2025 growth, waits for profitability inflection
This is the base case: Stock consolidates in current range, February earnings provide clarity on 2026 trajectory, volatility normalizes post-event.
Bear Case (25% probability)
Target: $60-$70 (TEST MAJOR SUPPORT)
What could go wrong:
- Q4 guidance disappoints with bookings growth decelerating faster than expected
- December engagement slower than modeled (TD Cowen flagged this concern)
- Child safety litigation headlines resurface (300+ legal actions ongoing)
- International regulatory actions expand (more bans like Qatar, Kuwait)
- Margin compression worse than expected from safety investments
- Break below $70 gamma support triggers cascade toward $60
Critical support levels:
- $74: Immediate support (current gamma floor)
- $70: Major structural floor (3.91B gamma - MUST HOLD)
- $63: Extended support (monthly implied move lower bound)
Trading Ideas
Conservative: Wait for Earnings Clarity
Play: Stay on sidelines until February 5th earnings volatility settles
Why this works:
- Earnings in 14 days creates binary event risk with 15%+ implied move
- Stock already down 6% YTD and 47% from September highs - catching falling knife risk
- Analysts increasingly cautious with multiple PT cuts
- Child safety litigation overhang creates headline risk
- Better entry likely post-earnings after direction established
Action plan:
- Watch February 5th earnings for bookings ($2.0B+ needed), 2026 guidance quality, and margin commentary
- Look for pullback to $65-70 support zone post-earnings for potential long entry
- If stock rallies to $80+ on strong results, reassess upside thesis
Risk level: Minimal (cash position) | Skill level: Beginner-friendly
Balanced: Post-Earnings Put Spread for Hedging
Play: After earnings, consider put spread if remaining long or entering new position
Structure: Buy $72 puts, Sell $65 puts (February 20 expiration)
Why this works:
- IV crush after earnings makes put spreads cheaper
- Defined risk ($7 wide = $700 max risk per spread)
- Targets gamma support zone where stock would likely stabilize
- Protects against continuation of YTD downtrend
- 28 days to expiration gives time for any guidance-related selling to play out
Entry timing:
- Wait 1-2 days post-earnings for IV collapse
- Only enter if stock trades $72+ (gives room to work)
- Skip if stock already below $68 (spread too close to ATM)
Risk level: Moderate | Skill level: Intermediate
Aggressive: February Strangle (ADVANCED ONLY!)
Play: Bet on volatility exceeding implied move around earnings
Structure: Buy $80 calls + Buy $68 puts (February 20 expiration)
Why this could work:
- Implied move of 15% may underestimate binary risk given:
- First guidance post-exceptional 2025 (70% bookings growth hard to compare)
- Profitability path still unclear
- Regulatory headwinds accelerating
- Management projecting margin compression
- RBLX has history of violent post-earnings moves (gained 11% on January 13 alone)
- Wide strike selection captures both directional outcomes
CRITICAL WARNING - DO NOT attempt unless you:
- Have traded straddles/strangles through earnings before
- Can afford to lose ENTIRE premium
- Understand IV crush mechanics
- Plan to close within 24-48 hours post-earnings
Risk level: EXTREME | Skill level: Advanced only
Risk Factors
Don't get caught by these potential landmines:
-
Earnings binary event in 14 days: February 5th results create MASSIVE volatility risk with 15%+ implied move. Stock could gap 10-15% either direction based on 2026 guidance quality and margin outlook. Any disappointment magnified given 2025 was exceptional (+70% bookings growth).
-
Profitability remains elusive: Despite 151.5M DAUs and $1.9B quarterly bookings, Roblox posted $257M net loss in Q3 2025. Management guides margin compression in 2026 from DevEx, infrastructure, and safety investments. Market patience for "growth at all costs" is waning.
-
Child safety litigation overhang: 300+ legal actions tied to exploitation claims including suits from Louisiana, Florida, and Texas AGs. Stock dropped 15% in October 2025 after safety investment announcements. Any negative headlines could trigger sharp selloff.
-
International regulatory risk: Already banned in Qatar, Kuwait, Turkey, Iran, China. UK Online Safety Act fines up to 10% of global revenues. Brazil law effective March 2026. Compliance costs rising.
-
2026 growth deceleration concerns: Bookings growth expected to slow from 70% YoY to ~21% YoY (Jefferies estimate). TD Cowen flagged slower December engagement. Challenging comparables from exceptional 2025.
-
Valuation multiple compression: P/S multiple contracted from 45x to 30x as profitability concerns persist. At $53B market cap on projected $6.6B FY25 bookings, stock still trades at 8x bookings - premium valuation requiring continued execution.
-
Insider selling activity: 5M+ shares sold by 35 insiders in past 3 months raises internal sentiment questions.
-
Fortnite competitive pressure: Epic Games aggressively expanding creator economy with 74% revenue share (vs Roblox's ~70%). Unity partnership could expand Fortnite content library in 2026.
The Bottom Line
Real talk: These put trades are NOT directional signals - they're position management before tomorrow's expiration. Someone closing out $5.8M in puts with contracts expiring in less than 24 hours is simply tidying up their book, not making a statement about RBLX direction.
What this trade tells us:
- Traders had bearish positions established at higher RBLX prices ($78-$83 strikes)
- The $83 short put is now deep in-the-money and being closed at a loss
- The $78 long put is in-the-money and being closed at a profit
- Coordinated timing suggests possible spread unwind
- No new directional signal here - this is housekeeping
The real event to watch: Q4 2025 earnings on February 5th. The market is pricing in a 15%+ move, reflecting massive uncertainty around:
- 2026 guidance quality - Will growth decelerate sharply from 70% bookings growth?
- Path to profitability - When does the $250M+ quarterly loss stop?
- Margin compression - How bad will DevEx and safety investments impact 2026?
- Regulatory resolution - Any updates on 300+ legal cases?
If you're watching RBLX:
- Wait for February 5th earnings to establish direction
- Look for entry at $65-70 support zone if bearish scenario plays out
- Need to see profitability path and sustainable 30%+ bookings growth for bullish thesis
- Consider spreads to manage the elevated implied volatility
If you're bearish:
- Put spreads post-earnings offer defined risk approach
- First support at $70 (major gamma floor), extended support at $63 (implied move lower bound)
- Wait for earnings - premature positioning risks whipsaw
Mark your calendar - Key dates:
- January 23 - Tomorrow's expiration (these put trades expire)
- February 5 (Thursday after close) - Q4 FY2025 / Full Year earnings report (14 DAYS!)
- February 20 - Monthly OPEX (key post-earnings expiration)
- March 2026 - Brazil online safety law effective
- Q1-Q2 2026 - AI tools and advertising platform expansion
Final verdict: RBLX presents a classic growth-vs-profitability dilemma. The 151.5M DAUs and 70% bookings growth are exceptional, but widening losses, regulatory headwinds, and decelerating 2026 growth projections create significant risk. Today's put activity is just expiration housekeeping - the real action comes February 5th.
Be patient. Let earnings establish direction. The entry opportunity will present itself.
Disclaimer: Options trading involves substantial risk of loss and is not suitable for all investors. This analysis is for educational purposes only and not financial advice. Past performance doesn't guarantee future results. Earnings create binary event risk with potential for 10-15%+ gaps either direction. Always do your own research and consider consulting a licensed financial advisor before trading.
About Roblox Corporation: Roblox operates a free-to-play online video game platform with approximately 150 million daily active users, enabling creators to build games while generating revenue through in-game purchases and advertising. Market cap: $53.12 billion in the Services - Prepackaged Software industry.