Silver Crash Triggers $18.9M Put Close-Out -- Whale Exits Massive Short Put Position as Junior Miners Crater!
January 30, 2026 | Unusual Activity Detected
The Quick Take
Someone just closed out $18.9 MILLION worth of SILJ short puts in a single trade -- selling to close 45,000 contracts across two strikes on the same day silver suffers its worst crash in 14 years. With SILJ down from $37.54 to $32.35 (a brutal -13.8% drop), this trader is buying back their short puts at a loss to stop the bleeding. Both puts are deep in-the-money with only 7 days until expiration. Translation: This is a risk-off, "get me out now" trade. Someone had a big bullish bet via short puts and the silver crash forced them to close before things get worse.
ETF Overview
Amplify Junior Silver Miners ETF (SILJ) tracks junior companies engaged in silver mining, exploration, and development:
- AUM: ~$6.13 billion
- Index Tracked: Nasdaq Junior Silver Miners Total Return Index
- Holdings: 65 equity positions in junior silver mining companies
- Expense Ratio: 0.69%
- Inception: November 27, 2012
- Dividend Yield: ~16.4% (trailing)
- 1-Year Return: +244.97% (prior to today's crash)
- Top Holdings: Hecla Mining (HL) 12.54%, First Majestic Silver (AG) 11.49%, Coeur Mining (CDE) 8.53%, Wheaton Precious Metals (WPM) 5.22%, Endeavour Silver (EXK) 4.60%
The Option Flow Breakdown
The Tape (January 30, 2026 @ 10:34:33):
| Time | Symbol | Side | Buy/Sell | Type | Expiration | Premium | Strike | Volume | OI | Size | Spot | Option Price | Option Symbol |
|---|---|---|---|---|---|---|---|---|---|---|---|---|---|
| 10:34:33 | SILJ | MID | SELL | PUT $37.50 | 2026-02-06 | $11M | $37.50 | 30,000 | 30,000 | 29,990 | $34.60 | $3.60 | SILJ20260206P37.5 |
| 10:34:33 | SILJ | MID | SELL | PUT $39.50 | 2026-02-06 | $7.9M | $39.50 | 15,000 | 15,000 | 14,995 | $34.60 | $5.29 | SILJ20260206P39.5 |
What This Actually Means
Let's break down what is really going on here, because this is a big deal:
- Sell to Close (STC): Both trades are closing positions. This trader previously SOLD these puts (a bullish bet) and is now buying them back to exit.
- Deep In-The-Money: The $37.50 put has $2.90 of intrinsic value ($37.50 - $34.60) and the $39.50 put has $4.90 of intrinsic value ($39.50 - $34.60). Both are underwater for the put seller.
- Massive Position Size: 29,990 + 14,995 = 44,985 total contracts, controlling 4.5 million shares worth roughly $155 million in notional exposure.
- Time Pressure: Only 7 days to expiration (Feb 6). With puts this deep ITM, assignment risk is real and imminent.
- Volume = Open Interest: Volume matches OI exactly on both strikes, meaning this single trade IS the entire position. This was one entity's full position being unwound.
What happened here in plain English: Someone had sold puts on SILJ when silver was flying -- a very profitable trade while the rally continued. They collected premium and were happy as long as SILJ stayed above $37.50 and $39.50. Then silver crashed 21% in a single day. SILJ plunged from $37.54 to $32.35. Suddenly those "safe" short puts went massively in-the-money, and this trader faced potential assignment on 4.5 million shares of a cratering ETF. They paid $18.9M to close out and stop the bleeding. This is a forced exit, not a happy one.
Why it matters for YOU: This is what capitulation looks like in the options market. When a $19M position gets unwound into crash-level volatility, it tells us that even well-capitalized players are hitting their pain threshold on silver. The question is: was this the bottom, or just the beginning of the unwind?
Technical Setup / Chart Check-Up
One Calendar Year Chart
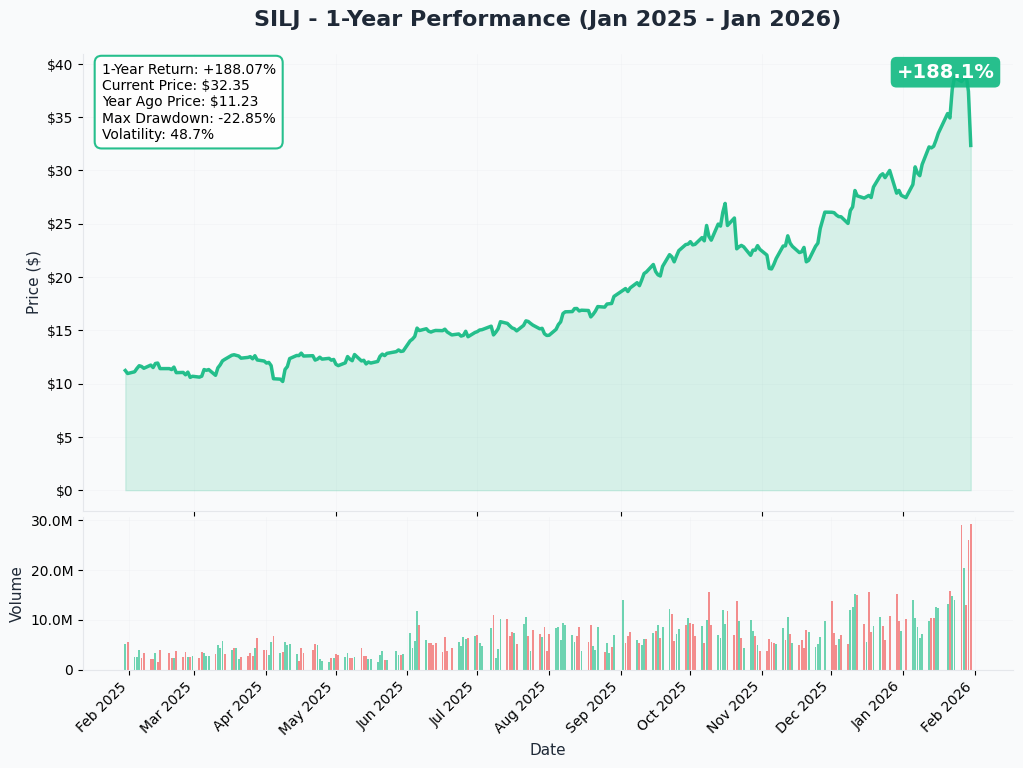
SILJ has been on an incredible run, returning +244.97% over the past year -- but today's action changes the picture dramatically:
- 52-Week Range: $10.01 - $41.10
- January 29 Close: $37.54
- Current Price (Jan 30): $32.35 (-13.8% intraday)
- 1-Month Return: +39.43% (before today's crash)
- P/E Ratio: 78.28x (extremely stretched)
- Trading Volume (Jan 29): 26 million shares vs. 17.1 million average -- distribution volume
The chart shows a textbook parabolic move that is now experiencing its first serious correction. After rallying from ~$10 to $41 over the past year, today's drop to $32.35 wipes out roughly two weeks of gains in a single session.
Gamma-Based Support & Resistance Analysis
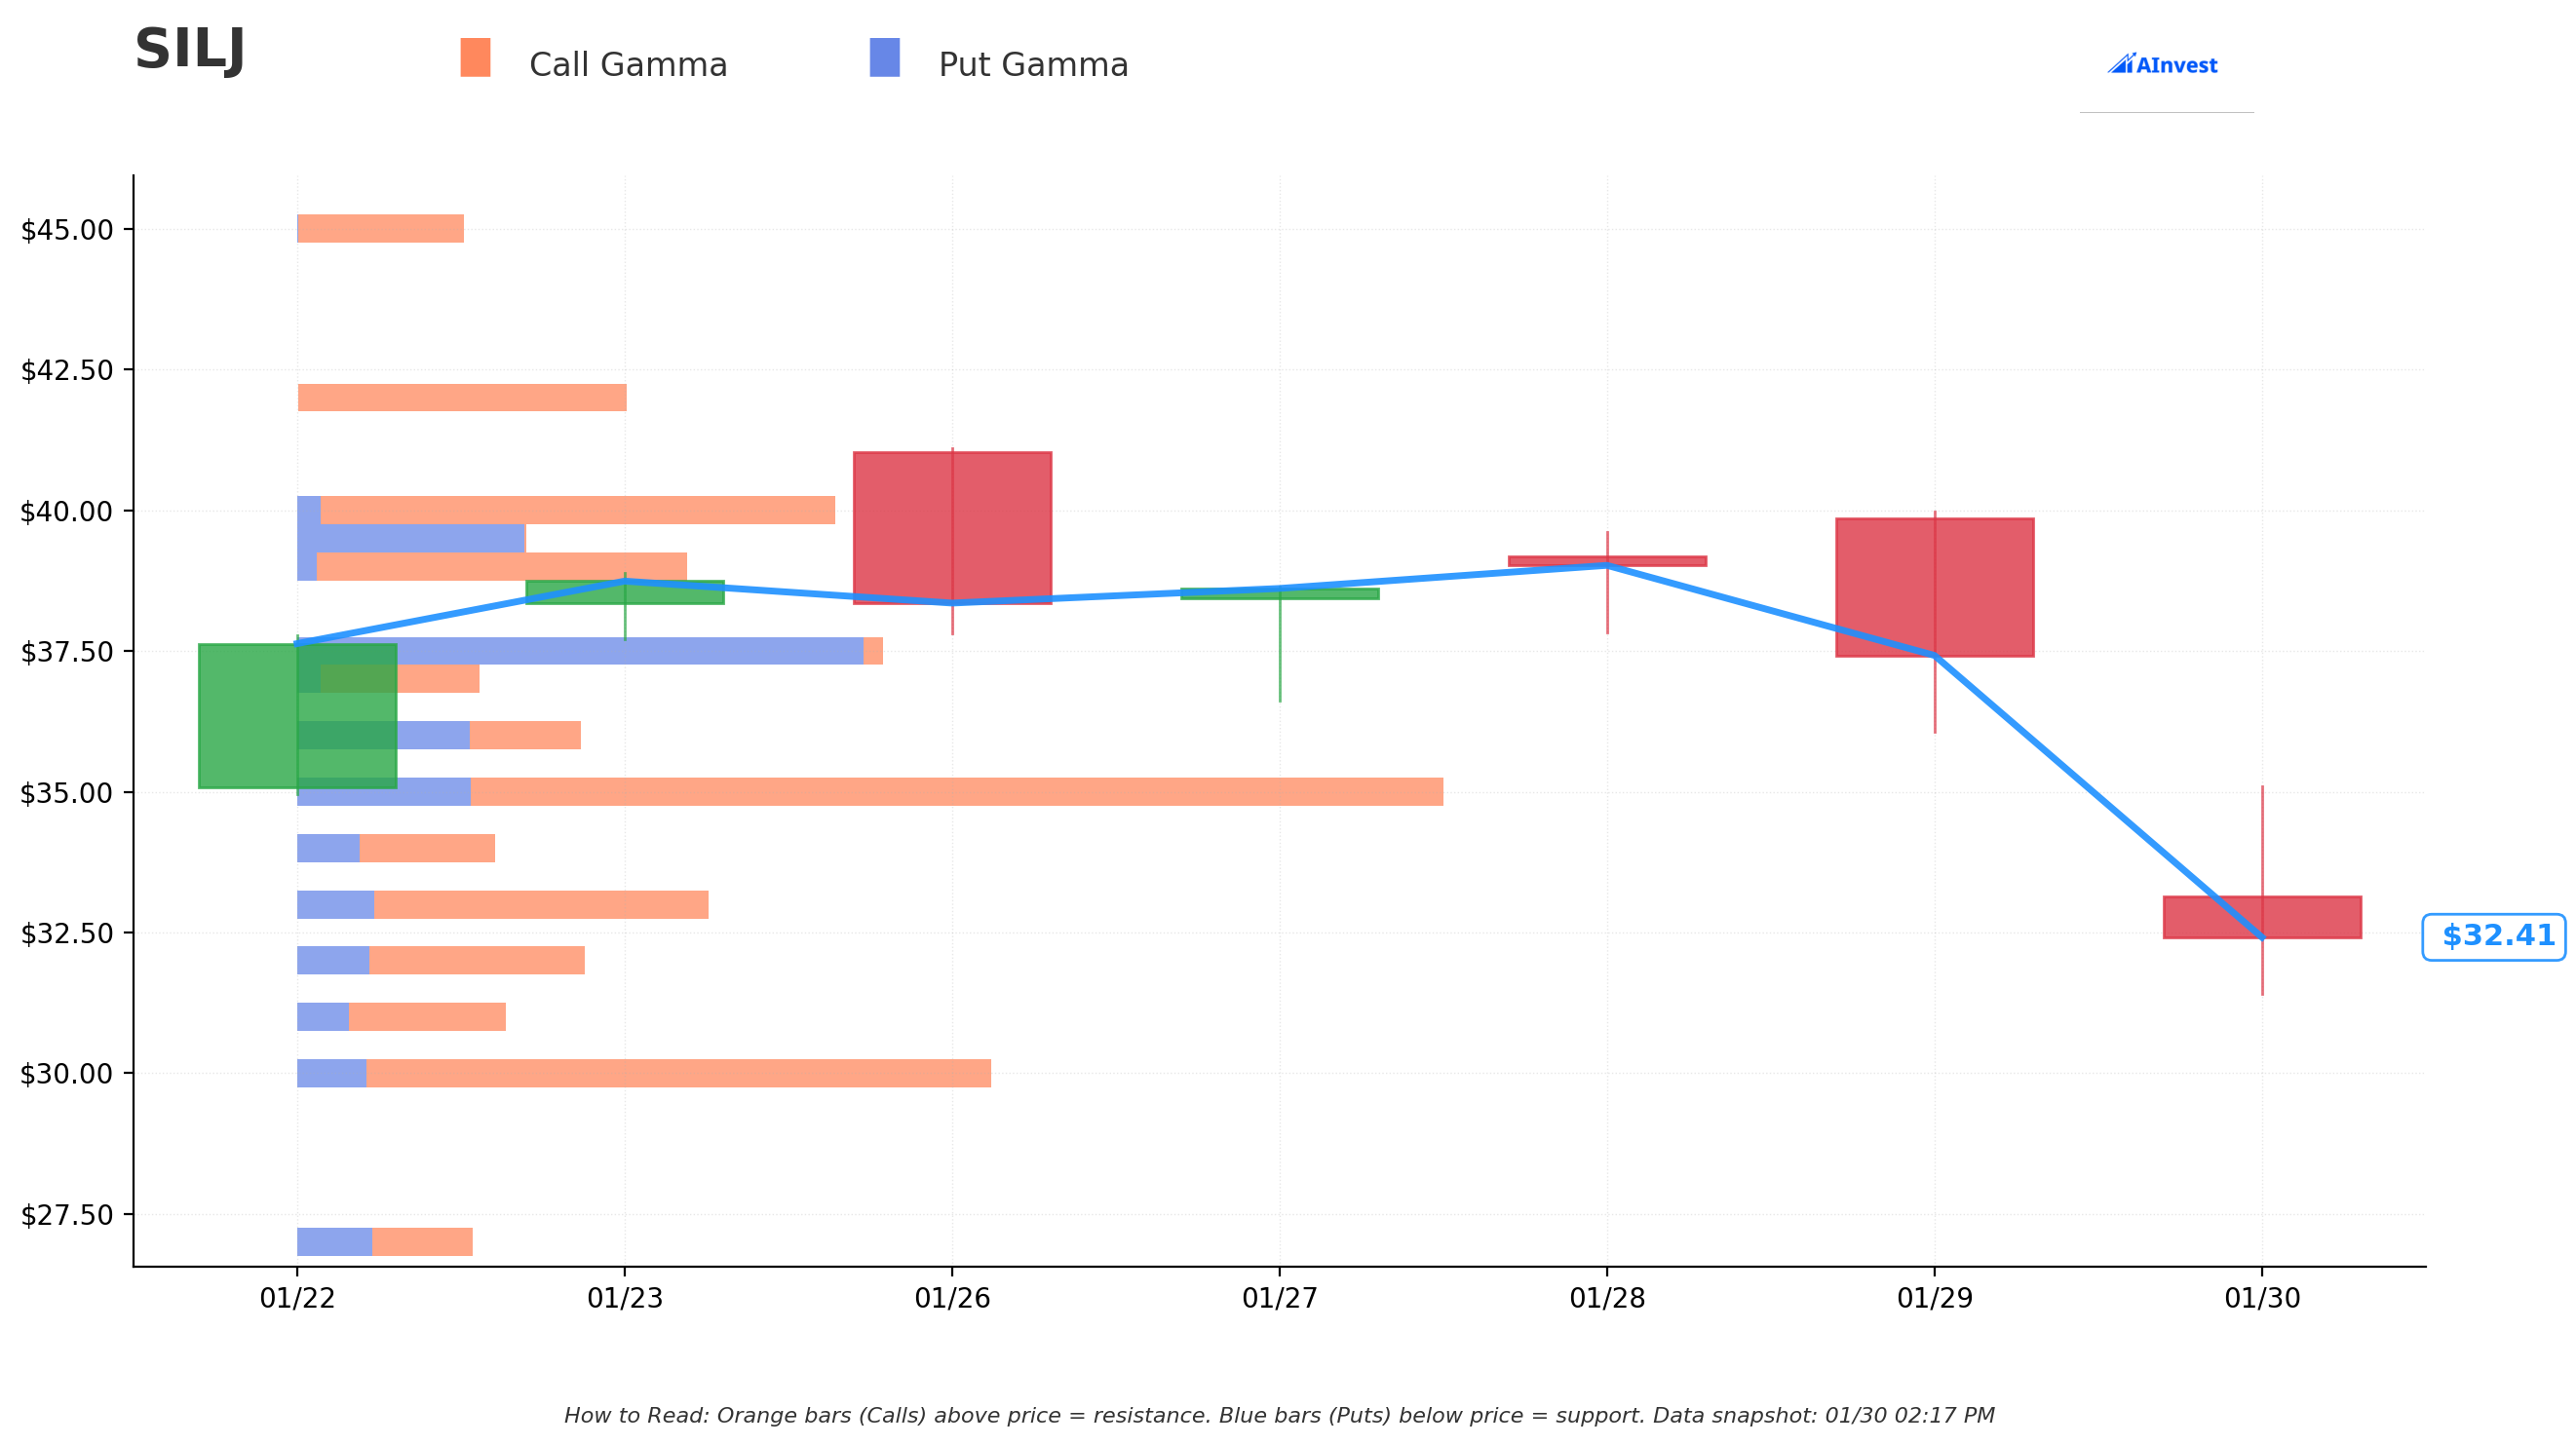
Current Price: $32.35
The gamma exposure map shows where dealer hedging creates mechanical support and resistance:
Support Levels (Where Dealers Buy Dips):
- $32 (Gamma: 3) - Immediate support just below current price
- $31 (Gamma: 2) - Secondary support if $32 breaks
- $30 (Gamma: 7) - STRONGEST SUPPORT -- major gamma wall with the highest support score. This is the line in the sand.
- $27 (Gamma: 2) - Deep support if the sell-off intensifies
Resistance Levels (Where Dealers Sell Rallies):
- $33 (Gamma: 4) - First resistance overhead
- $34 (Gamma: 2) - Secondary resistance
- $35 (Gamma: 11) - STRONGEST RESISTANCE -- massive gamma wall. SILJ needs to reclaim this level to confirm the recovery
- $36 (Gamma: 3) - Additional overhead
- $37 (Gamma: 2) - Aligns with the closed $37.50 put strike
What this means for traders: SILJ is sitting right at the $32 gamma support level. The $30 level below is the big floor with the highest gamma score (7). If SILJ holds $30, the bull case for a recovery bounce remains intact. However, $35 is a brick wall of resistance above -- any bounce will face selling pressure there.
Net GEX Bias: Bullish -- despite the crash, call-side gamma still dominates the positioning. This suggests dealers will provide some buying support on further dips, which could help stabilize the sell-off.
Implied Move Analysis
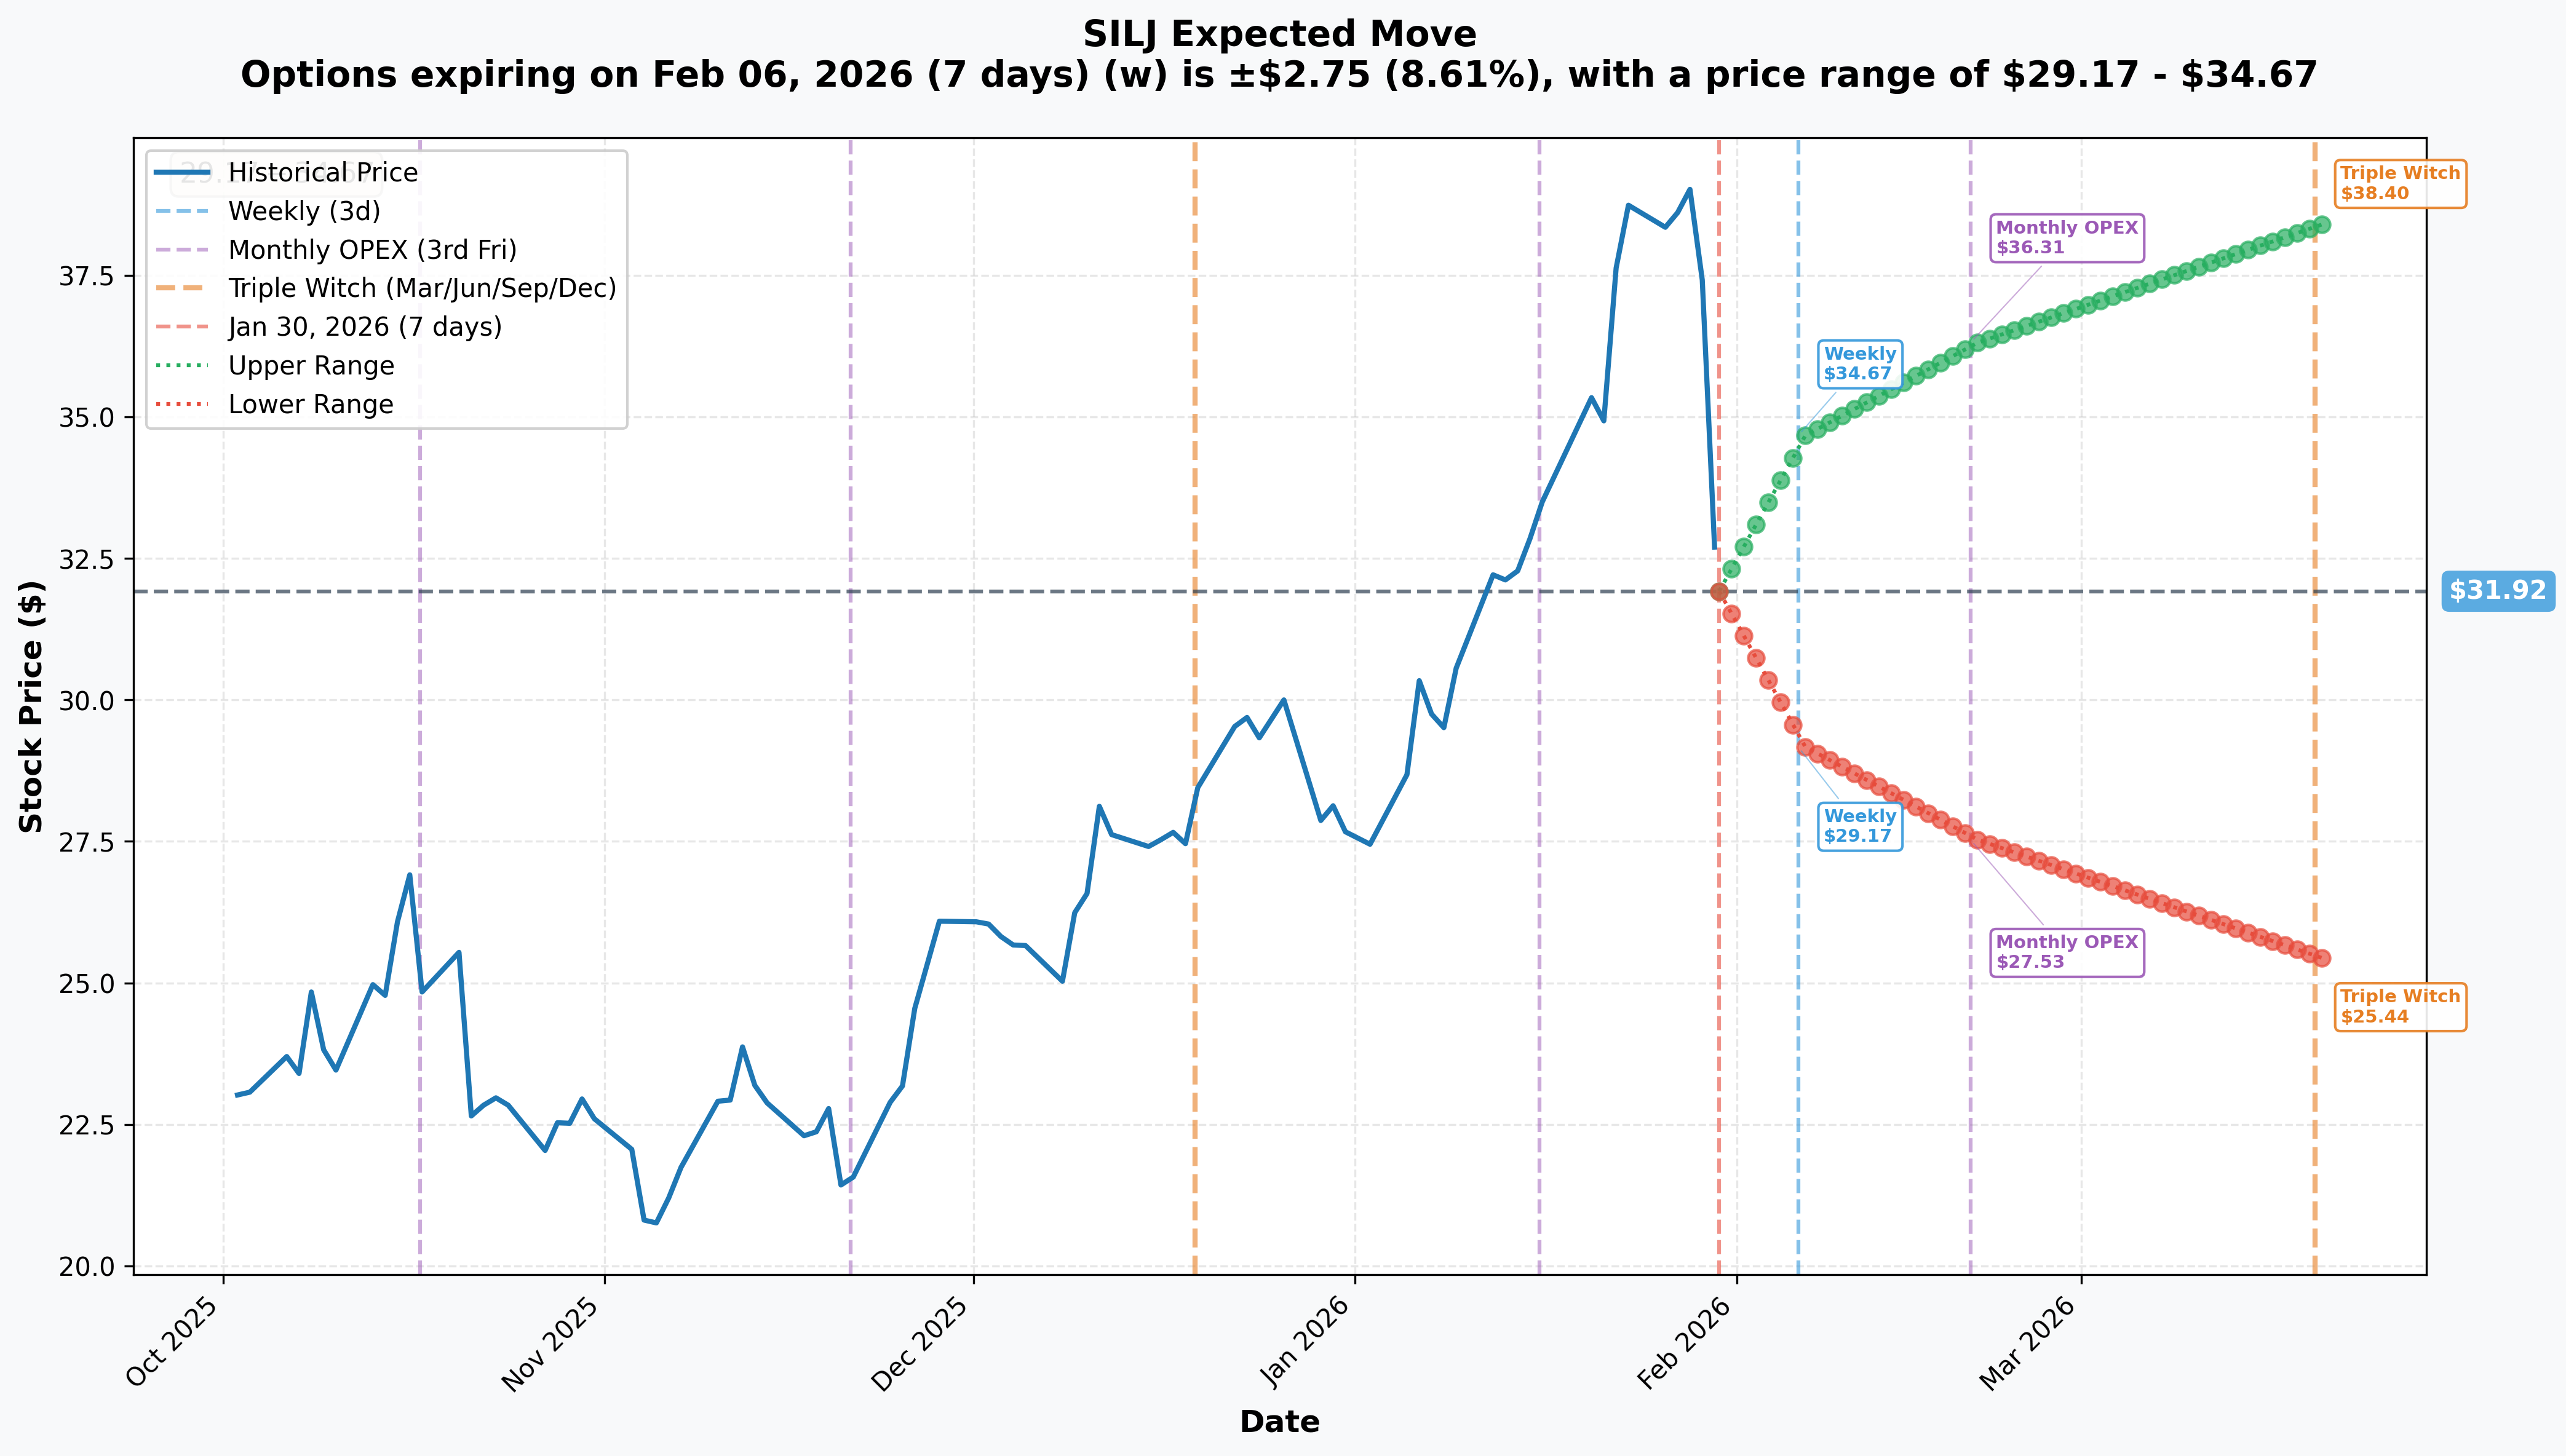
Options market pricing for upcoming expirations:
- Weekly (Feb 6 - 7 days): +/-$2.75 (8.6%) --> Range: $29.17 - $34.67
- Monthly OPEX (Feb 20 - 21 days): +/-$4.39 (13.8%) --> Range: $27.53 - $36.31
- Quarterly Triple Witch (Mar 20 - 49 days): +/-$6.48 (20.3%) --> Range: $25.44 - $38.40
What the options market is telling us: The weekly implied move range of $29.17 - $34.67 is the most relevant for the closed put positions. Notice that $34.67 is below both put strikes ($37.50 and $39.50) -- the options market is saying those puts were virtually guaranteed to expire in-the-money. No wonder the trader closed them.
The monthly OPEX range stretches down to $27.53 on the low end, which would be a 15% decline from here. The quarterly range goes as low as $25.44 -- a potential 21% further decline. The market is pricing in elevated volatility in both directions, but the downside risk is substantial.
Catalysts
What Just Happened (The Crash Trigger)
Silver's Worst Day in 14 Years -- January 30, 2026
Silver plunged from a record $121.67/oz (set January 29) to approximately $91/oz today -- a 21% single-day crash. This is silver's biggest daily drop in 14 years, triggered by:
- CME margin hikes: CME Group raised margins by an additional 25% after a prior 13.6% hike in December, triggering over $1 billion in leveraged position liquidations within hours
- Profit-taking cascade: After a parabolic run from ~$28/oz to $122/oz in 12 months, leveraged longs are rushing for the exits
- Physical bullion premiums: Had reached 40% over spot with a paper-to-physical ratio of 356:1 -- classic squeeze dynamics now unwinding
Recent Catalysts (Why Silver Went Parabolic in the First Place)
China's Silver Export Controls (January 1, 2026)
China formalized silver exports under a license-based system, restricting exports to only 44 state-approved companies. With Beijing controlling an estimated 60-70% of globally traded refined silver, this effectively mirrors China's rare earth export playbook and was a major fuel for the January rally.
COMEX Short Squeeze
A massive short squeeze developed in mid-January with 33.45 million ounces physically withdrawn in just seven days (~26% of registered inventory). Registered COMEX stocks fell to approximately 30 million ounces. Today's crash is the other side of that squeeze unwinding.
Hecla Mining (Top SILJ Holding) Record Results
SILJ's largest holding announced preliminary 2025 results on January 26: full-year revenue surpassed $1.2 billion for the first time, adjusted EBITDA exceeded $500 million, and net leverage fell to 0.3x from 1.8x. Fundamentally strong, but the market does not care about fundamentals during a crash.
U.S. Designates Silver as Critical Mineral
In November 2025, the U.S. Department of the Interior added silver to its critical minerals list, recognizing its strategic importance in energy and defense technologies. This designation could unlock government funding for domestic mining projects -- a longer-term tailwind.
Upcoming Catalysts (What to Watch Next)
Earnings Season for Top Holdings (February 2026)
| Company | Ticker | Expected Date | Revenue Estimate |
|---|---|---|---|
| Hecla Mining | HL | ~February 12, 2026 | $346.91M |
| Coeur Mining | CDE | February 18, 2026 | TBD |
| First Majestic Silver | AG | ~February 19-20, 2026 | $363.19M |
These reports will reveal exceptional margins given AISC of ~$13/oz vs. silver averaging $50-67/oz in Q4 2025. The question is whether the market looks forward (crashing silver) or backward (record profits).
COMEX March 2026 Delivery Pressure
Open interest on March silver futures far exceeds registered physical stocks. The delivery window beginning late February could trigger another round of squeeze dynamics -- or more forced liquidation, depending on how the current crash resolves.
Federal Reserve Policy Path
The Fed held rates at 3.5-3.75% at the January meeting. Fed Chair Powell's term expires in May 2026, with former Fed governor Kevin Warsh nominated as successor. A dovish successor accelerates precious metals; a hawkish one cools them.
Silver Supply Deficit Extends to Sixth Year
The Silver Institute projects the global silver market will post its sixth consecutive annual supply deficit in 2026. Cumulative deficit from 2021-2025 is approximately 820 million ounces. Over 70% of silver is a byproduct of base metal mining, meaning producers cannot easily increase supply in response to price signals.
Solar PV and AI Data Center Demand
Solar PV silver consumption is projected to exceed 230 million ounces by 2026, and AI data center expansion is creating a new silver demand vector through semiconductors and chip packaging.
Price Targets & Probabilities
Using gamma levels, implied move data, the crash dynamics, and the structural catalyst backdrop, here are the scenarios for SILJ over the next 1-3 months:
Bear Case (35% probability)
Target: SILJ $25-$28 (Silver $65-$75/oz)
How we get there:
- Silver's crash continues as CME margin hikes force more liquidation
- The parabolic move from $28/oz to $122/oz gives back 40-50%, landing silver at $60-$75/oz
- Junior miners suffer amplified drawdowns due to operational leverage
- COMEX March delivery pressure adds to selling, not buying
- P/E compression from 78x toward 30-40x as forward silver estimates get slashed
- HSBC's forecast of $68.25/oz average proves closer to reality than the bull case
For context: Even at $25, SILJ would still be up 150% from its 52-week low of $10.01. This is a correction within a bull market, not the end of the world.
Base Case (40% probability)
Target: SILJ $30-$35 (Silver $80-$100/oz)
Most likely scenario:
- Silver stabilizes in the $80-$100/oz range after the crash -- painful but manageable
- SILJ bounces off the $30 gamma support wall and consolidates between $30-$35
- February earnings from Hecla, Coeur, and First Majestic show record profits, providing fundamental support
- The structural supply deficit narrative reasserts itself as panic subsides
- China's export controls continue to constrain supply, putting a floor under prices
- Volatility remains elevated but the worst of the liquidation is over
Key level to watch: $30 is the strongest gamma support. If SILJ holds this level, the base case plays out.
Bull Case (25% probability)
Target: SILJ $36-$42 (Silver $100-$120/oz)
What needs to go right:
- Silver quickly V-bottoms and reclaims $100/oz as dip-buyers step in
- COMEX March delivery pressure reignites squeeze dynamics
- Record miner earnings in February drive a re-rating of mining stocks
- Fed signals additional rate cuts, boosting precious metals
- Cyclical analysis pointing to September 2026 peak remains valid -- today was just a shakeout
- SILJ reclaims $35 resistance and pushes toward the prior highs
This is the "today was the bottom" scenario. Possible, but chasing a falling knife is risky.
Trading Ideas
Conservative: Wait and Watch at $30 Support
Play: Set limit buy orders for SILJ shares at $29.50-$30.50 (strongest gamma support zone)
Why this works:
- The $30 level has the highest gamma score (7), meaning dealer hedging creates a natural floor
- Buying into a crash requires a plan -- $30 gives you a defined entry with a clear stop-loss at $27
- The structural bull case for silver (supply deficit, China controls, solar/AI demand) has not changed
- You are buying at a 20% discount to yesterday's close
- Risk/reward: stop at $27 = 10% risk, target $35-$38 = 17-27% upside
Action plan:
- Wait for SILJ to test $30 with conviction (look for volume confirmation)
- Buy a half position at $30, add the other half if it holds and bounces
- Stop-loss at $27 (below the deep gamma support)
- Target: $35-$38 over the next 4-8 weeks as silver stabilizes
Risk level: Low-Moderate | Skill level: Beginner-friendly
Balanced: Sell Cash-Secured Puts at $30 Support
Play: Sell SILJ February 20 $30 puts to collect premium while the market panics
Why this could work:
- Implied volatility is elevated after the crash, making puts expensive and premium rich
- The $30 strike aligns perfectly with the strongest gamma support level
- If SILJ stays above $30, you keep the premium as pure profit
- If SILJ drops to $30, you get assigned and own shares at the best support level -- right where you would want to buy anyway
- February miner earnings could provide a catalyst for stabilization
Why this could go wrong:
- Silver could keep crashing -- parabolic unwinds can be vicious and multi-day
- If SILJ drops to $25, you own shares at $30 with an immediate 17% paper loss
- Cash-secured puts require significant capital ($3,000 per contract in cash)
- Volatility expansion could move the puts against you before expiration
Risk level: Moderate | Skill level: Intermediate
Aggressive: Buy the Crash with March Calls
Play: Buy SILJ March 20 $33 calls (currently near ATM with elevated IV)
Why this could work:
- The quarterly implied move range extends to $38.40 on the upside -- 18% higher from here
- February earnings from top holdings should be blowout numbers (AISC $13/oz vs. $50-67/oz silver)
- COMEX March delivery pressure could reignite squeeze dynamics
- If silver V-bottoms, junior miners typically snap back faster than bullion
- 49 days of runway gives time for the panic to subside
Why this could go wrong:
- Buying calls into a crash is catching a falling knife -- the trend is aggressively down
- Elevated IV means you are paying a premium for time value that could evaporate if vol crushes
- If silver keeps dropping, theta and delta will eat your position alive
- This is a leveraged bet that requires conviction the worst is over
Risk level: High | Skill level: Advanced
Risk Factors
Do not ignore these potential landmines:
-
Parabolic blow-off risk is REAL and HAPPENING: Silver just dropped 21% in a single day -- its worst crash in 14 years. After surging from $28 to $122 in approximately 12 months, a 30-50% correction would still leave silver above $60/oz. Historical precedent (1980, 2011) shows precious metals can give back the majority of parabolic gains. SILJ as a small-cap miner ETF amplifies both the upside AND the downside.
-
CME margin hikes are actively fighting the rally: CME has raised silver margins multiple times -- 13.6% in December 2025 and another 25% recently. Further hikes could trigger additional waves of forced liquidation. Today's crash wiped out $1 billion in leveraged positions in hours -- and more could follow.
-
Valuation is stretched beyond reason: SILJ trades at a 78.28x P/E ratio. That is pricing in perfection. If silver stabilizes at $80-$90/oz instead of resuming its climb to $120+, earnings estimates get revised down and multiples compress. The analyst consensus price target of $33.60 already implies downside from yesterday's $37.54 close.
-
China could reverse export controls: China has shown willingness to use strategic metals as negotiating leverage. If export controls are loosened as part of trade negotiations, supply floods back into the market.
-
Fed hawkish pivot: If inflation re-accelerates and the Fed signals fewer rate cuts, precious metals lose a key tailwind. Higher real yields make non-yielding assets like silver less attractive.
-
Junior miner operational risks: Small-cap miners face permitting delays, cost inflation, labor shortages, and geological risk. Many SILJ holdings have concentrated operations and limited financial buffers. In a falling silver price environment, the weakest miners get hit the hardest.
-
ETF premium/discount risk: During extreme volatility like today, SILJ may trade at significant premiums or discounts to its net asset value. The 26 million shares traded on January 29 (vs. 17.1M average) signals distribution, and today's volume is likely even higher.
The Bottom Line
Real talk: This $18.9 million position close is a capitulation event. When someone unwinds 45,000 put contracts into the worst silver crash in 14 years, it tells us one thing: the pain trade is ON for silver bulls.
What this trade tells us:
- The position was likely established when SILJ was trading above $37.50-$39.50 -- the puts were originally sold as bullish bets that the ETF would stay elevated
- Silver's 21% crash turned profitable short puts into massive liabilities overnight
- The volume-equals-OI pattern confirms this was a single entity's full position exit -- they are done
- MID execution (not aggressively sweeping) shows some price discipline even in panic mode
- The 7-day expiration means assignment was imminent -- this was a "close now or own 4.5 million shares of a crashing ETF" decision
The big picture: Silver's structural bull case has NOT changed. The supply deficit is real (sixth consecutive year). China's export controls are real (60-70% of globally traded refined silver). Solar and AI demand are real (230M+ ounces projected for 2026). But parabolic moves always correct, and today is that correction.
If you are a silver bull:
- Do NOT try to catch this falling knife today. Let the dust settle.
- Watch the $30 level on SILJ -- that is your strongest gamma support and the line in the sand
- February earnings from Hecla (Feb 12), Coeur (Feb 18), and First Majestic (Feb 19-20) will be blowout numbers and could stabilize sentiment
- The structural thesis needs weeks to months to play out -- there is no rush to get back in
If you are watching from the sidelines:
- This crash is creating the first real buying opportunity in silver miners in months
- Wait for SILJ to find a bottom and build a base before entering
- A 20% crash in SILJ creates an entry point that was not available last week
- Size appropriately -- position no more than 3-5% of your portfolio in a single volatile sector ETF
If you are cautious:
- Silver dropped from $122 to $91 in ONE DAY. That kind of volatility can wipe out accounts
- The P/E of 78x leaves zero margin for error on valuation
- Junior miners are small-cap, volatile, and operationally risky even in good times
- If silver drops another 20% to $73/oz (toward HSBC's $68.25 forecast), SILJ could easily revisit $20-$25
Mark your calendar -- Key dates:
- February 6, 2026 -- These closed puts expire (Feb 6 weekly OPEX)
- February 12, 2026 -- Hecla Mining (HL) Q4 earnings
- February 18, 2026 -- Coeur Mining (CDE) Q4 earnings
- February 19-20, 2026 -- First Majestic Silver (AG) Q4 earnings
- Late February 2026 -- COMEX March silver futures first delivery notice
- May 2026 -- Fed Chair Powell term expiration; Warsh confirmation
- September 2026 -- Projected 360-day cyclical peak for SILJ
Final verdict: The $18.9M put close-out is a clear signal that the silver correction is inflicting real pain on large players. But corrections in bull markets are where fortunes are made -- IF you buy at the right level with the right size. The $30 gamma wall on SILJ is the level to watch. Let the crash play out, wait for stabilization, and be ready to act when the panic subsides. Silver's best days may still be ahead, but today is a day for patience, not heroics.
Disclaimer: Options trading involves substantial risk of loss and is not suitable for all investors. This analysis is for educational purposes only and not financial advice. Past performance does not guarantee future results. SILJ is an extremely volatile ETF tied to small-cap silver miners and commodity prices. Silver dropped 21% in a single day on January 30, 2026 -- similar or greater moves could occur in either direction. Junior mining stocks carry operational, geological, and financial risks that can result in total loss. Always do your own research and consider consulting a licensed financial advisor before trading.
About Amplify Junior Silver Miners ETF: SILJ tracks junior companies engaged in silver mining, exploration, and development. The fund holds 65 equity positions that derive the majority of revenue from silver mining or global silver production. AUM of approximately $6.13 billion with an expense ratio of 0.69%. Renamed from ETFMG Prime Junior Silver Miners ETF on January 29, 2024.