🛢️ SLB: Someone Just Loaded Up $2.4M in Calls While Iran Shakes the Oil World!
📅 March 5, 2026 | 🔥 Unusual Activity Detected
🎯 The Quick Take
Someone just dropped $2.4M on nearly 10,000 SLB May $50 calls -- with a volume-to-OI ratio of 2.27x and a z-score of 22.27 (classified as EXTREMELY UNUSUAL). This is a massive new bullish position on the world's largest oilfield services company, placed while the Iran-Hormuz crisis drives oil prices to multi-month highs. The trader needs SLB at $52.44 by mid-May for this to pay off -- and with 28 out of 30 analysts rating SLB a Strong Buy with an average target of $53.07, the smart money clearly thinks it gets there.
🏢 Company Snapshot
SLB Limited (NYSE: SLB) -- formerly known as Schlumberger -- is the world's premier oilfield-services company, operating across three growth engines: core oil and gas services, digital solutions, and new energy businesses. The company generates over three-fourths of its revenue internationally and maintains nearly $3B in digital-related annual revenue. Founded in 1926, SLB is the undisputed global leader in oil and gas field services.
📊 Key Stats:
- 💰 Market Cap: ~$71.6B
- 🏭 Industry: Oil & Gas Field Services (SIC: Oil & Gas Field Services, NEC)
- 👥 Employees: ~109,000
- 📍 Headquarters: Houston, TX
- 🌐 Website: slb.com
- 📈 52-Week Range: $31.11 - $52.40
💰 The Option Flow Breakdown
📊 What Just Happened
| Detail | Value |
|---|---|
| 📅 Date & Time | March 5, 2026 at 10:26 AM ET |
| 🎯 Contract | SLB May 15, 2026 $50 Call |
| 📦 Size | 9,998 contracts |
| 💵 Premium Paid | ~$2.4M (~$2.44 per contract) |
| 🏷️ Spot Price | $47.53 |
| 📊 Volume vs OI | 10,000 vs 4,400 (2.27x ratio) |
| 🔀 Side | Bought at the MID |
| 🧩 Strategy | Long Call (Buy-to-Open) |
| 📉 Z-Score | 22.27 (EXTREMELY UNUSUAL) |
🤓 What This Actually Means
Let me break this down. A trader walked in and bought nearly 10,000 call contracts on SLB -- more than double the entire existing open interest at this strike. A z-score of 22.27 means this trade is roughly 22 standard deviations above normal activity. To put that in perspective, you might see something this unusual a handful of times per year across all tickers, let alone in a single energy name.
Here's what makes it stand out:
✅ 5.2% out-of-the-money -- The $50 strike sits above the current $47.53 price. This isn't deep OTM gambling or ITM hedging -- it's a "I think oil services are heading higher" kind of bet with a clean round-number strike.
✅ Paid at the mid -- They didn't chase the ask. Executing at the midpoint signals a patient, experienced operator with a plan -- not someone panic-buying into the Iran headlines.
✅ 71 days of runway -- The May 15 expiration captures three major catalysts: the OPEC+ meeting (April 5), Q1 earnings (~April 24), and continued Iran conflict developments.
✅ Breakeven at ~$52.44 -- That's 10.3% above the current price. Sounds like a stretch? The average analyst price target is $53.07, and the 52-week high is $52.40. This trader is betting SLB reclaims its recent highs.
✅ $50M in notional exposure -- Controlling ~$50M worth of SLB stock for a $2.4M premium. That's 20:1 leverage -- and serious institutional conviction.
This is definitely not your neighbor Bob's Robinhood account. With a 9.1:1 call/put ratio already skewing heavily bullish on SLB, this whale is adding fuel to an already one-sided options market.
📈 Technical Setup / Chart Check-Up
YTD Price Action
SLB has been on a monster run, rallying from its September 2025 low of $31.11 to a 52-week high near $52.40 -- a gain of over 68% in about five months. The stock broke well above both its 50-day and 200-day moving averages during this surge, driven by the ChampionX integration, a multi-billion-dollar Aramco contract, and a broader oil services sector rally.
The recent pullback from ~$52 to ~$47 coincides with the Iran conflict disruption -- the broader market sold off (S&P -0.7%, Dow -400 pts) even as oil prices spiked. This created what looks like a buy-the-dip window for the whale trade.
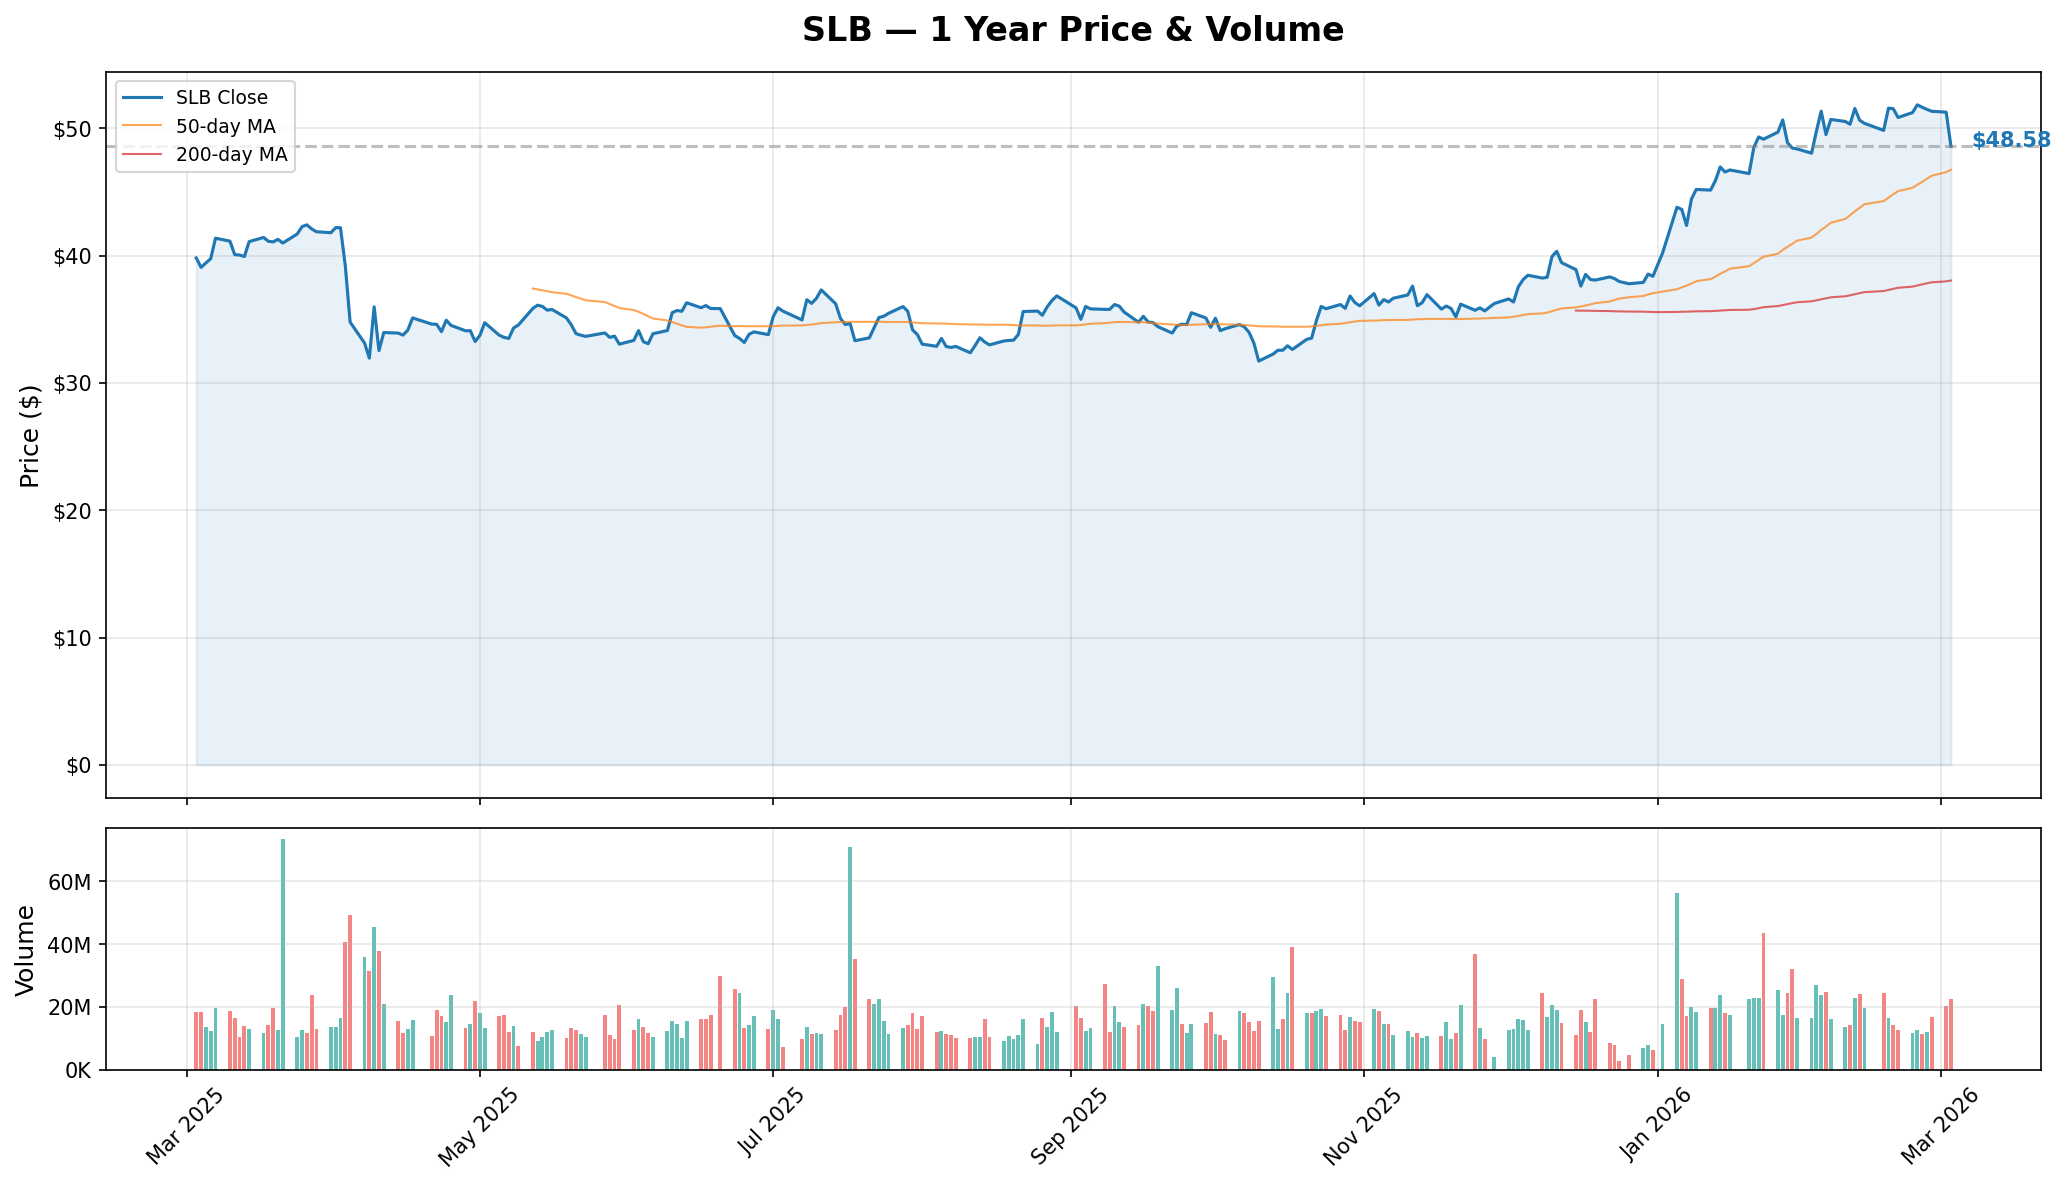
Key observations from the chart:
- 📈 Price is well above the 200-day MA (~$39.54), confirming the long-term uptrend is intact
- 📈 The 50-day MA is rising and currently around ~$46-47, providing dynamic support
- 📉 The ~$5 pullback from the $52 high has brought SLB back to its 50-day MA -- a classic "retest the moving average" setup
- 📊 Volume was elevated on the sell-off days, suggesting some panic selling that may now be exhausted
🔵🟠 Gamma-Based Support & Resistance Analysis
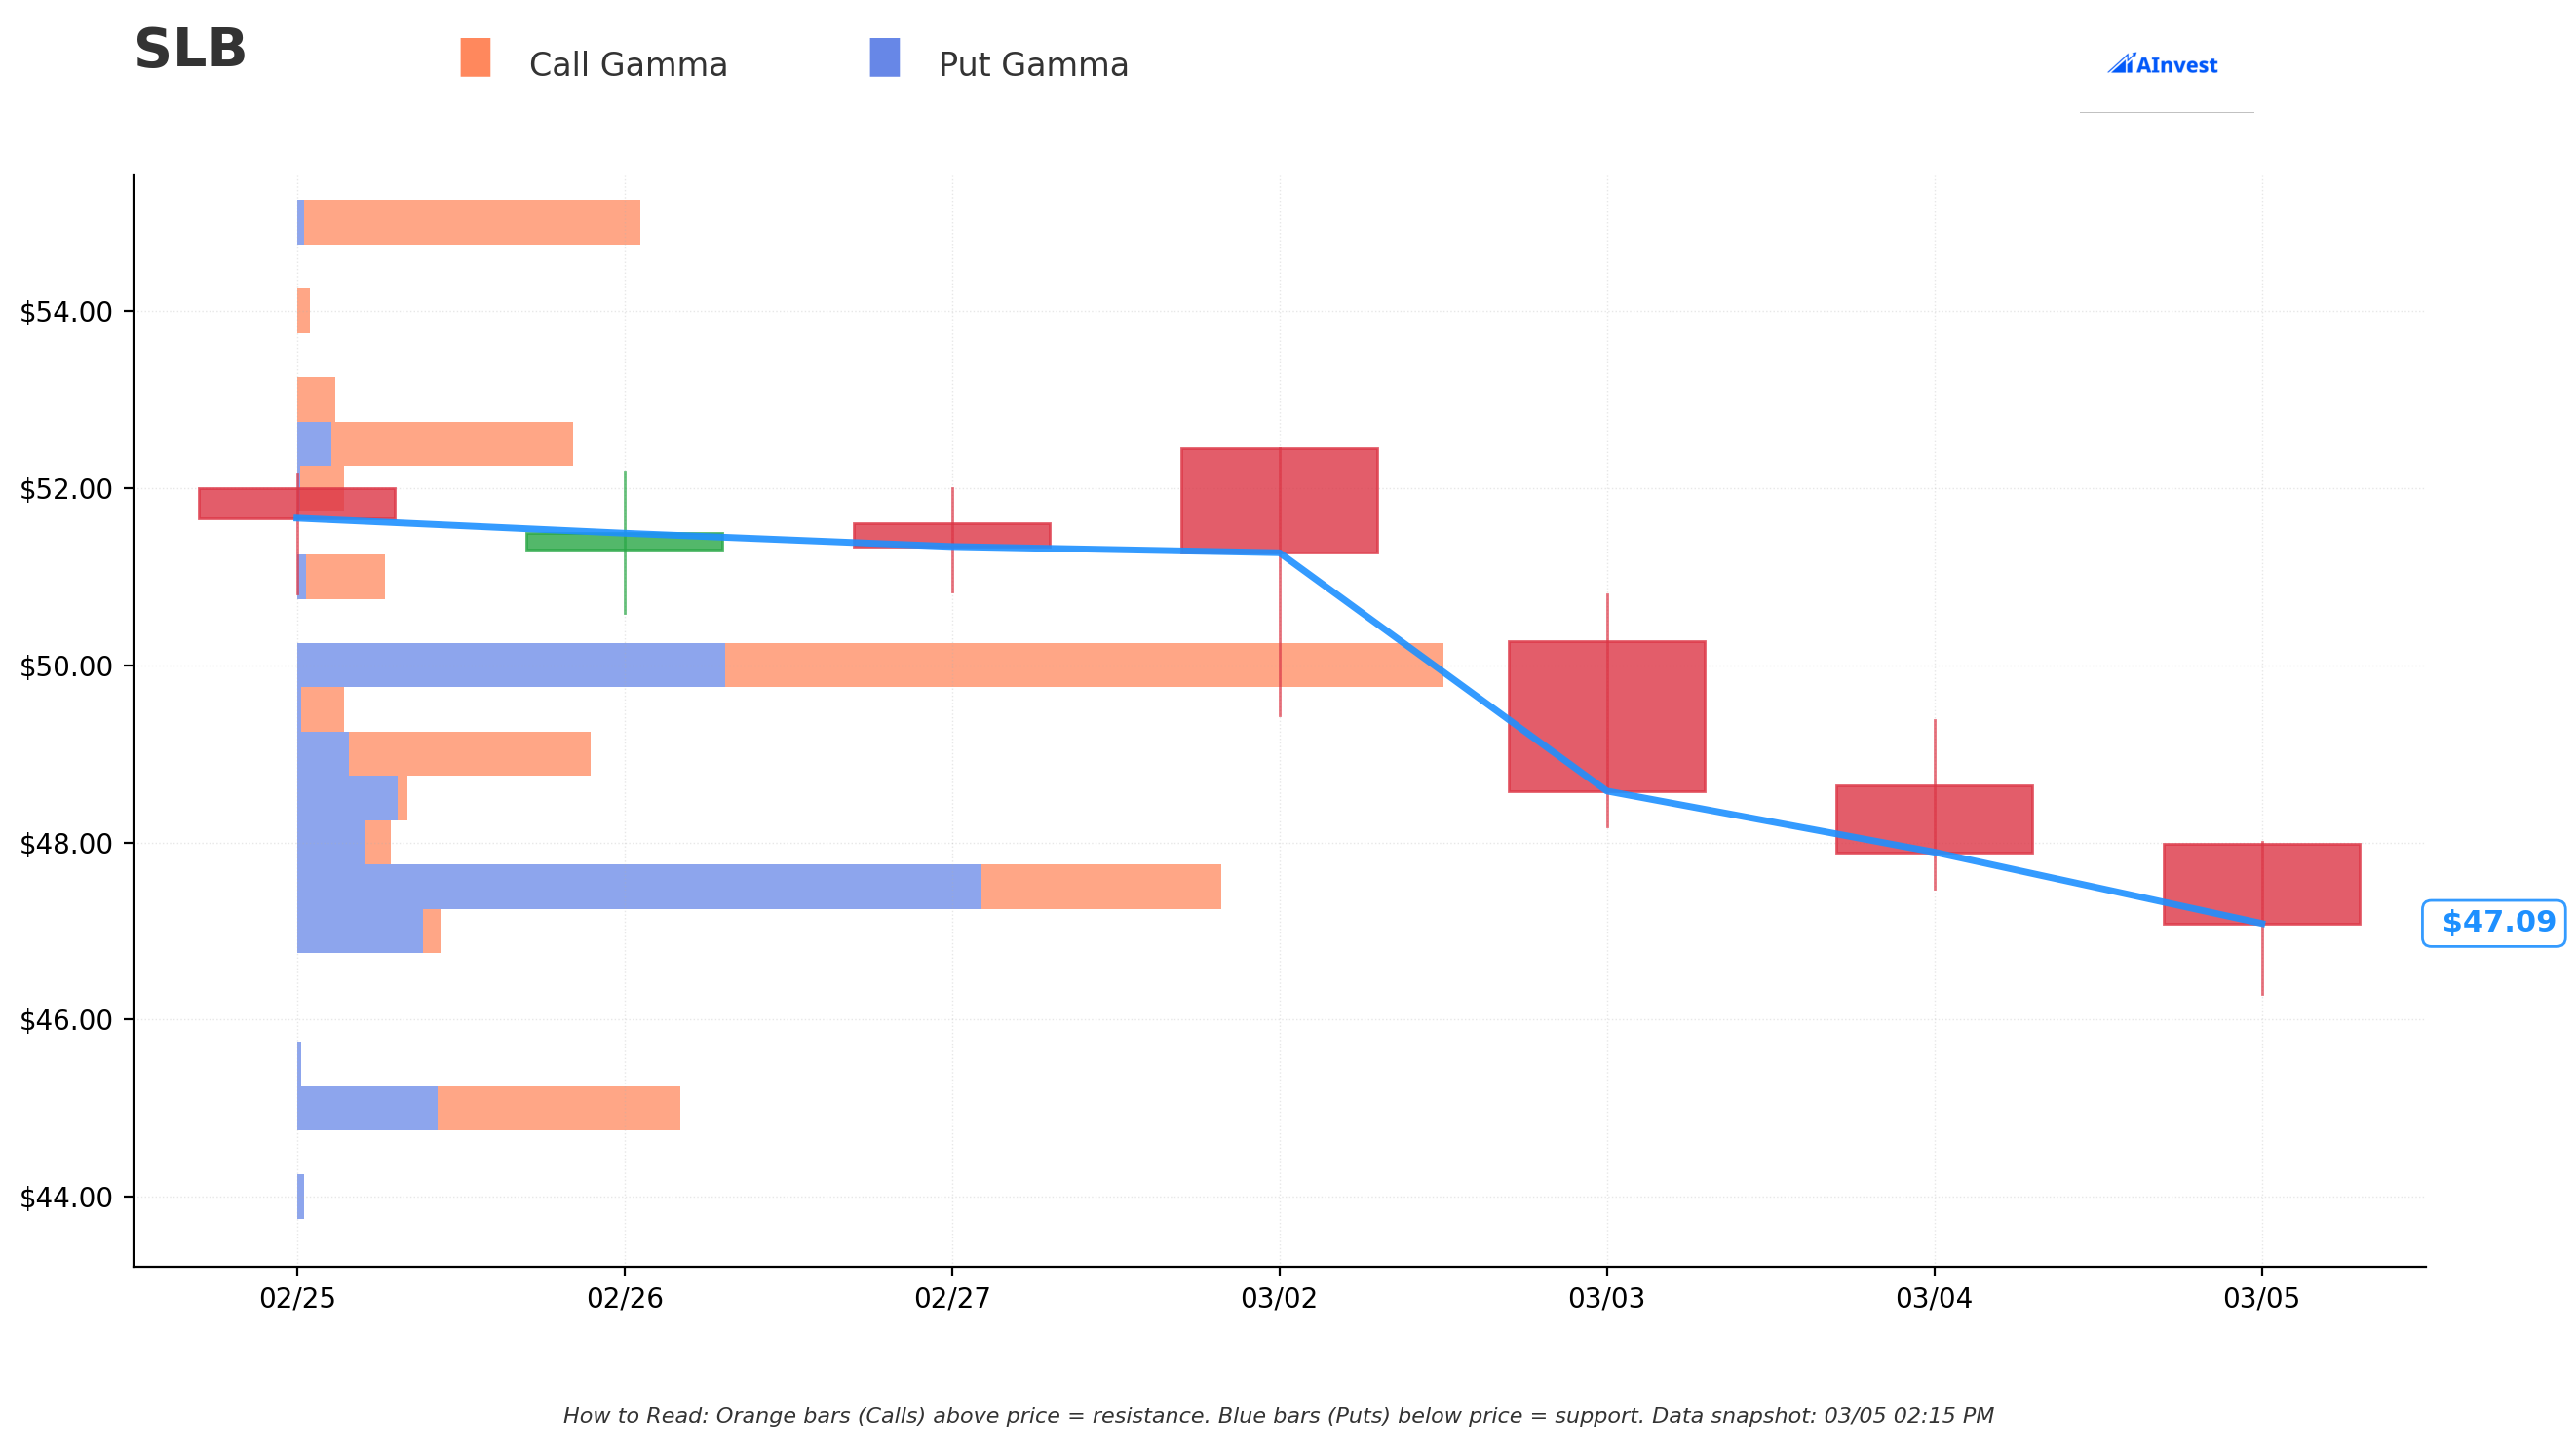
The gamma exposure chart reveals where options market makers have concentrated their positioning:
Key Gamma Levels:
- 🟠 $55 (Max Gamma Strike) -- The highest gamma concentration sits here, acting as the gravity zone. If SLB catches a strong bid from oil prices or earnings, hedging flows could accelerate price toward this level.
- 🟠 $52.50 -- Secondary resistance that aligns with the 52-week high ($52.40). This is the "breakout or rejection" level.
- 🟠 $50 -- The strike targeted by our whale trader. Significant call gamma here means if SLB pushes above $50, dealer hedging could generate additional buying pressure.
- 🔵 $47.50 -- Near-term support. Current price ($47.53) is sitting right at this gamma level, which may act as a floor in the short term.
- 🔵 $45 -- Deeper support. A break below $47 would find buying interest here from put-side hedging flows.
From the gamma chart, we can see the last two weeks told a story: SLB dropped from $52+ levels down to $47, breaking through multiple gamma support zones as the Iran conflict rattled markets. The call gamma (orange bars) above price at $48, $50, and $52 represents overhead resistance that turns into tailwind once reclaimed. The put gamma (blue bars) visible below at $45-47 suggests a support floor is forming at current levels.
💡 Translation: The options market is saying the $47-$50 corridor is the battleground. Hold $47 support, and the path opens to a run back toward $50-$52.50. Lose $45, and things could get ugly.
📉 Implied Move Analysis
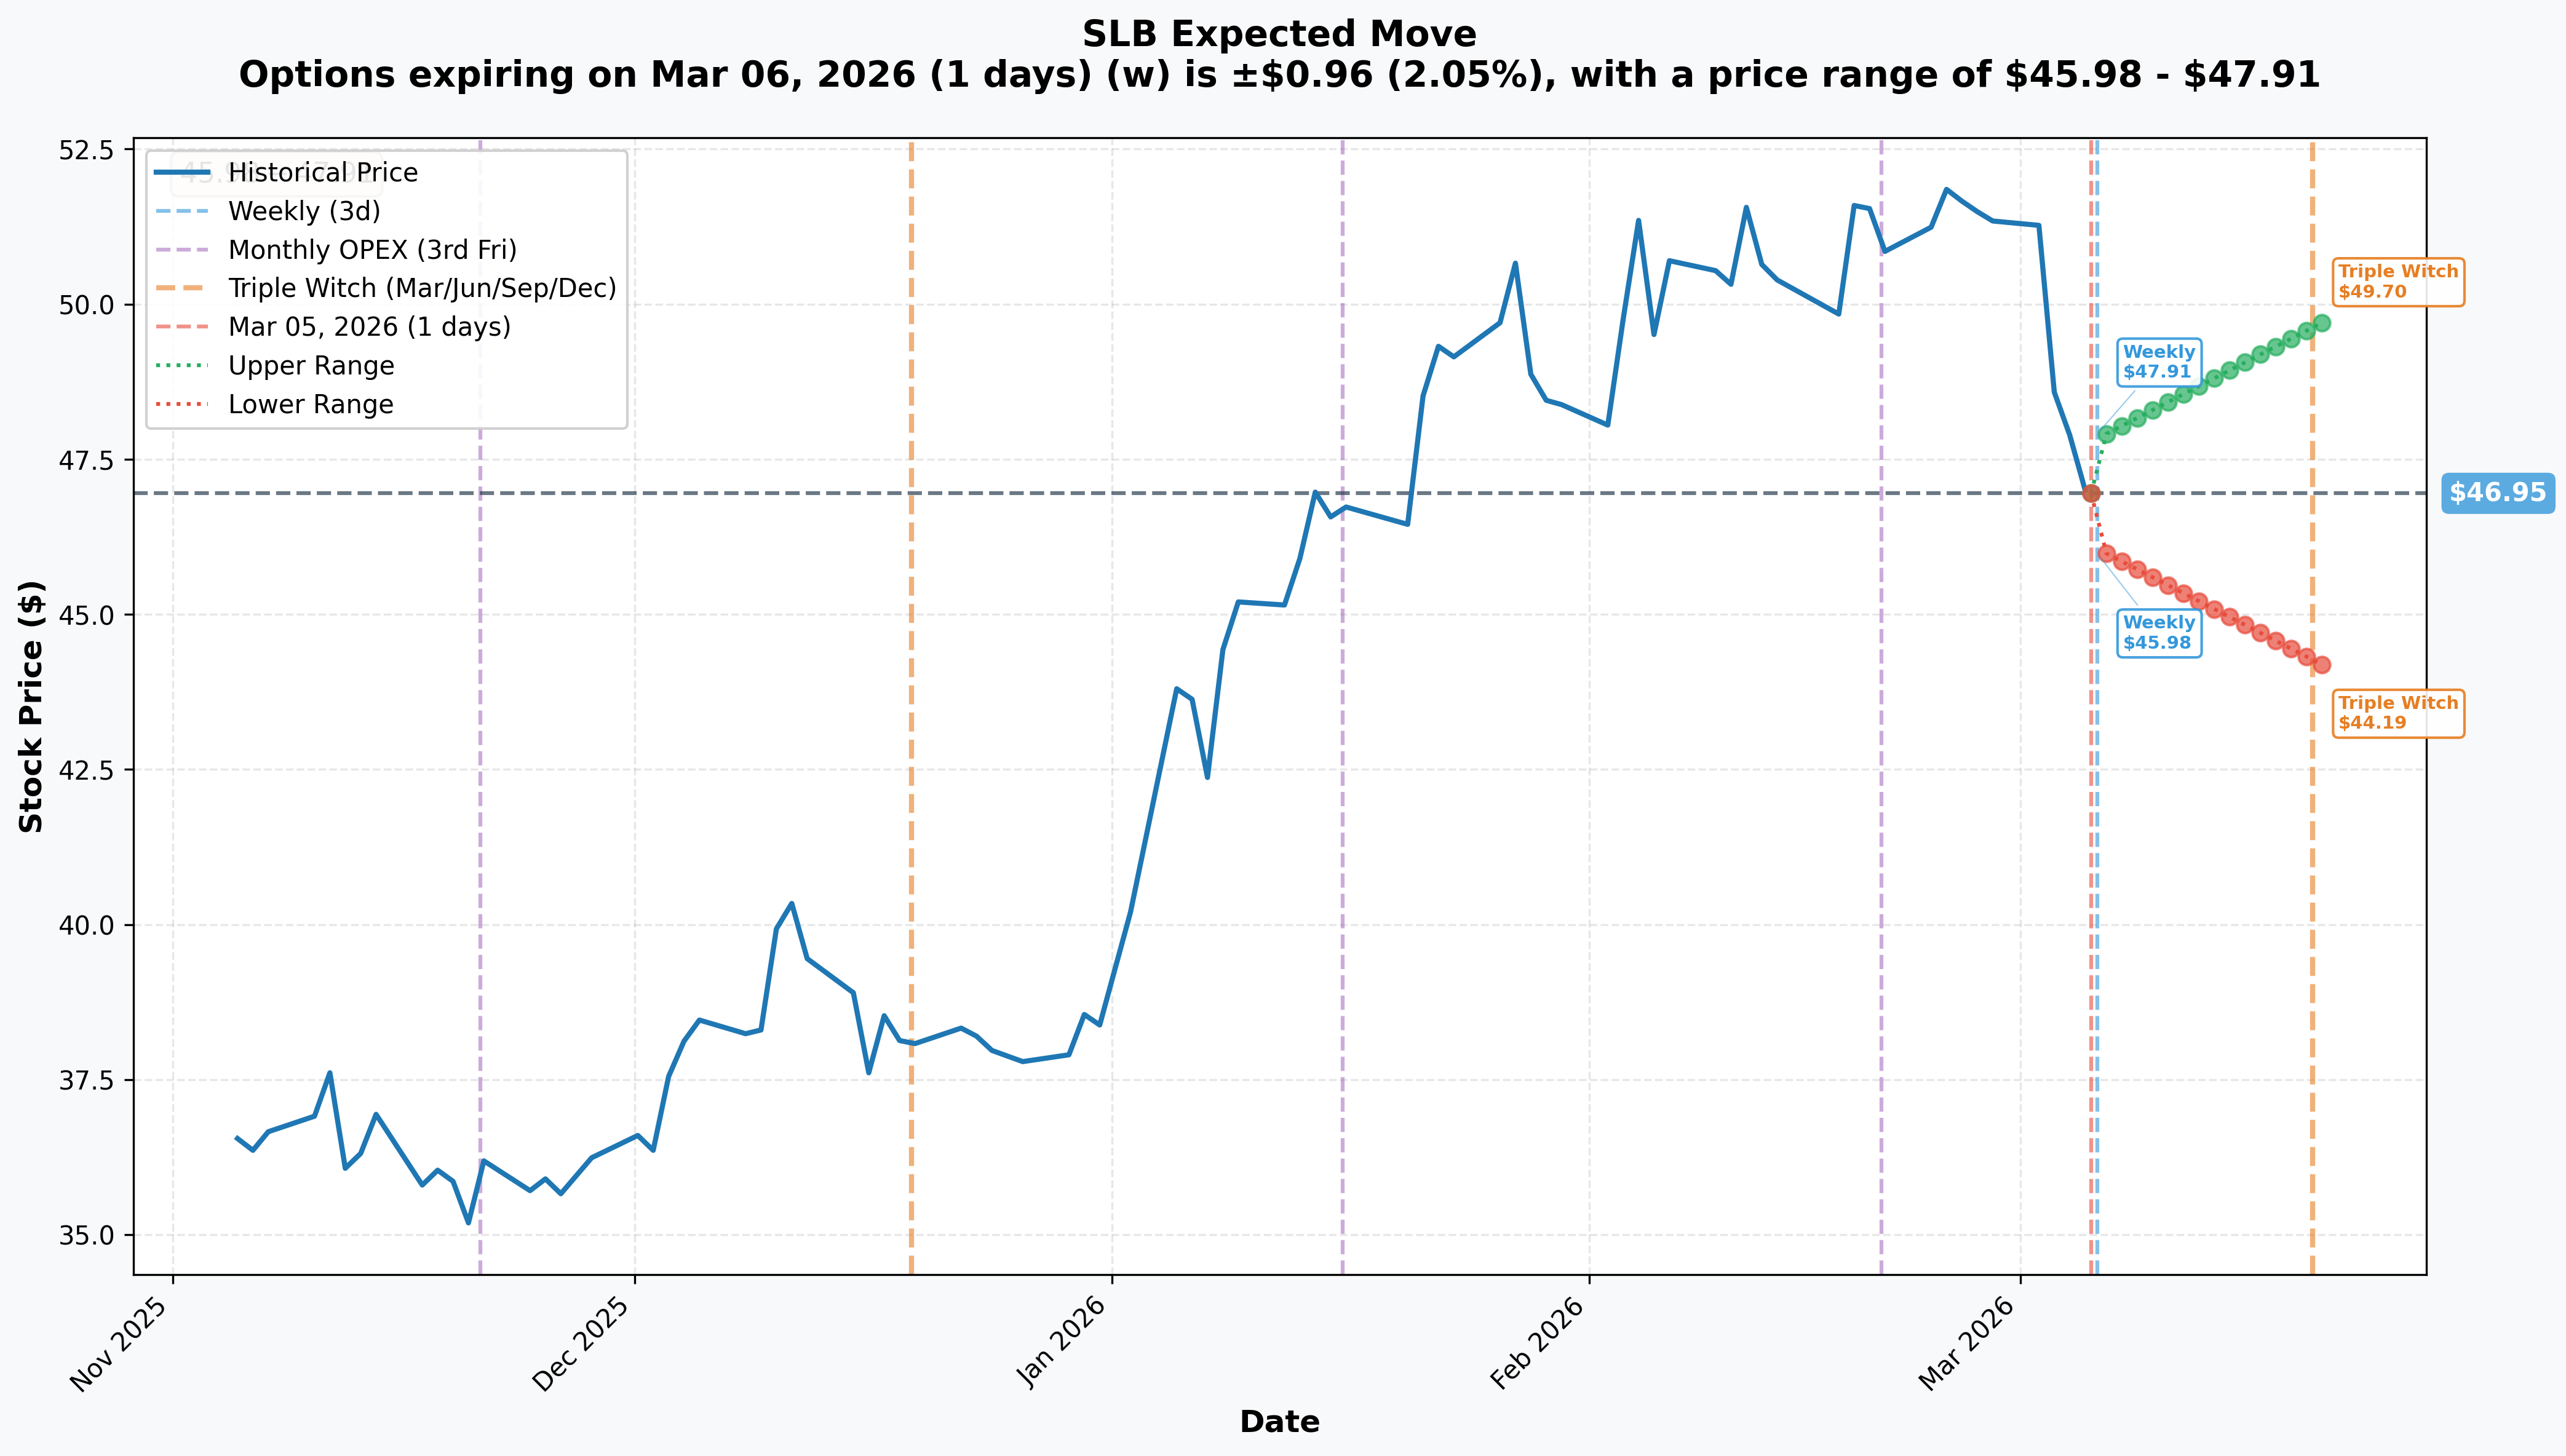
The options market is pricing in the following expected moves:
| Timeframe | Expiration | Implied Move | Range |
|---|---|---|---|
| 📅 Weekly | March 6 | ±2.1% (±$0.96) | $45.98 - $47.91 |
| 📅 Monthly OPEX / Triple Witch | March 20 | ±5.9% (±$2.76) | $44.19 - $49.70 |
👀 The critical insight: The $50 strike on the whale trade sits above the March monthly implied move upper range of $49.70. This means the market is not currently pricing SLB to reach $50 by March OPEX -- but the May 15 expiration gives the trader 71 days and multiple catalysts to get there. With IV at 41 (mid-range in the 28-65 52-week window), options aren't even pricing in peak uncertainty yet. If the Iran situation escalates further, IV expansion alone could boost these calls before SLB even moves.
🎪 Catalysts
📅 Upcoming (Next 1-3 Months)
🔥 Maritime War-Risk Insurance Cancellations -- March 5 (TODAY) Major insurers issued "Notice of Cancellation" for war-risk coverage effective today. This could escalate shipping disruptions through the Strait of Hormuz, where ~20% of global oil transits. Any tanker disruptions could send oil higher, which is bullish for SLB.
📊 OPEC+ Monthly Meeting -- April 5 The April production increase of 206k b/d is already decided. The May decision is pending -- and if Iran supply gets knocked offline, OPEC+ producers (Saudi Arabia, UAE) may need to boost output to fill the gap. More production = more demand for SLB's services. This is the perfect catalyst for oilfield services stocks.
💰 SLB Dividend Ex-Date -- ~April 2 $0.295/share quarterly dividend -- a 3.5% increase from the prior quarter. Income-focused buyers may step in ahead of this date.
📈 Q1 2026 Earnings -- ~April 24 Consensus estimates: $0.62 EPS / $8.88B revenue. Q1 is typically SLB's weakest seasonal quarter, but here's the key -- SLB's 2026 guidance assumes oil in the high-$50s to low-$60s. With WTI at $76.47 right now, there's significant upside to that guidance if oil prices stay elevated. Management commentary on the Iran conflict's impact on international activity will be the number one thing to listen for.
✅ Recently Completed
📋 Q4 2025 Earnings (January 22) -- Revenue of $9.75B (+5.0% YoY), EPS of $0.78 ex-charges. Beat expectations with strong free cash flow of $2.29B. 2026 guidance of $36.9-37.7B revenue set a positive tone.
🏗️ Aramco Five-Year Contract (December 23, 2025) -- Multi-billion dollar stimulation services contract for Saudi unconventional gas fields. This provides multi-year backlog visibility.
🤝 OneSubsea $100M+ Contract (February 18) -- SLB shares rose 3.51% on the announcement. OneSubsea delivered ~$4B in subsea bookings in 2025 with a path to >$9B cumulative over 2026-2027.
🔗 ChampionX Integration -- Closed July 2025 for $7.8B. Annual pre-tax synergies target of ~$400M, with 70-80% expected to be realized in 2026 ($280-320M this year). Integration completed smoothly.
⚔️ Iran Conflict (February 28 - ongoing) -- Operation "Epic Fury" launched U.S.-Israel strikes against Iran. Brent surged from ~$70 to >$80; WTI hit $76.47. Goldman Sachs estimates the market is pricing a ~4-week conflict duration with tail risk to $130/bbl if Hormuz is fully blocked.
🎲 Price Targets & Probabilities
Based on the gamma levels, implied move bands, analyst targets, and the catalyst window through May 15, here's how we see it playing out:
🐻 Bear Case: $42-$45 (20% probability)
If the Iran conflict de-escalates rapidly, the $10-15 oil risk premium evaporates and SLB could give back its recent gains. A breakdown below the $45 gamma support would open the door to a retest of the low $40s. The $2.4M call trade would be a total loss. This scenario plays out if oil drops back below $65, Q1 earnings disappoint, and the broader market risk-off intensifies. The $45 gamma support and the 200-day MA at $39.54 are the floors to watch.
⚖️ Base Case: $49-$52 (50% probability)
SLB stabilizes around $47-48, then grinds higher as OPEC+ confirms production increases (bullish for services demand) and Q1 earnings come in better than feared thanks to elevated oil prices. The stock reclaims $50 -- which is both the whale trade's strike and a major psychological level -- and pushes toward $52, just below the 52-week high. The call trade breaks even at $52.44, so this is a "small loss to small winner" zone depending on exactly where we land. The consensus analyst target of $53.07 supports this range.
🚀 Bull Case: $52-$58 (30% probability)
Oil stays elevated above $75, OPEC+ accelerates production to fill the Iran gap (massively bullish for SLB), and Q1 earnings blow past estimates since SLB guided for $58-62 oil but is getting $76. ChampionX synergies track ahead of schedule. SLB breaks out above the $52.40 52-week high and runs toward the $55 max gamma strike or higher. At $55, the May $50 calls would be worth ~$5 each -- roughly a 105% return on the $2.44 entry. Analyst high-end targets reach $60-$74, giving substantial room if the geopolitical tailwind persists.
💡 Trading Ideas
🛡️ Conservative: "The Oil Hedge" -- Bull Call Spread
Buy SLB May 15, 2026 $50 Call / Sell May 15, 2026 $55 Call
- 💵 Estimated Net Debit: ~$1.20-$1.50
- 🎯 Max Profit: ~$3.50-$3.80 per spread (at $55+)
- 📉 Max Loss: Premium paid (~$1.20-$1.50)
- 📊 Breakeven: ~$51.20-$51.50
- ✅ Why this works: You're following the whale's direction but capping risk by selling the $55 call right at the max gamma strike. The short leg reduces your cost by roughly 40-50%, and the $55 cap still gives you a realistic target backed by multiple analyst upgrades to the $53-$54 range. You get a 2.5:1 reward-to-risk ratio with the catalyst window fully in play. This is the "sleep well at night while still catching the oil trade" approach.
⚖️ Balanced: "The Whale Shadow" -- Long May $50 Call
Buy SLB May 15, 2026 $50 Call at ~$2.40-$2.50
- 💵 Cost: ~$240-$250 per contract
- 🎯 Profit Target: $54-$55 (potential $150-$260 profit per contract)
- 📉 Max Loss: Premium paid
- 📊 Breakeven: ~$52.44
- ✅ Why this works: This mirrors the whale trade exactly. You're buying the same contract with 71 days of runway through OPEC+ (April 5), earnings (~April 24), and ongoing geopolitical developments. The 28 out of 30 analysts at Strong Buy and the fact that SLB is guiding for $58-62 oil while WTI is at $76 gives you fundamental backing. If oil stays elevated, this trade has real legs. Size it at 1-2% of your portfolio -- don't go overboard. The breakeven at $52.44 is the 52-week high zone, so you need a genuine breakout for this to work.
🚀 Aggressive: "The Hormuz Bet" -- Short-Dated Call Spread into OPEC+
Buy SLB April 17, 2026 $49 Call / Sell April 17, 2026 $53 Call
- 💵 Estimated Net Debit: ~$1.30-$1.60
- 🎯 Max Profit: ~$2.40-$2.70 per spread (at $53+)
- 📉 Max Loss: Premium paid
- 📊 Breakeven: ~$50.30-$50.60
- ✅ Why this works: This captures the OPEC+ meeting on April 5 and any Iran escalation headlines in the next 6 weeks. If OPEC+ announces accelerated production increases to fill Iran's supply gap -- which multiple analysts expect -- SLB could pop hard. The $49 long strike is only ~3% OTM, giving you a reasonable entry point. The April expiration also captures the ex-dividend date (~April 2), which sometimes brings buyers in ahead of time. This is higher risk, higher conviction -- if the oil situation heats up further, this trade could double quickly.
⚠️ Risk Factors
🔴 Iran Conflict -- Double-Edged Sword -- While higher oil prices are generally bullish for SLB, the company has massive operations in Saudi Arabia and UAE -- both countries that Iran has threatened to strike. If hostilities spread to Gulf state infrastructure, SLB's actual on-the-ground operations could face disruption. Higher oil prices don't help if your rigs are shut down.
🔴 Rapid De-Escalation Risk -- Goldman Sachs estimates the market is pricing a ~4-week conflict. If a ceasefire materializes quickly, the $10-15/bbl risk premium disappears overnight, and SLB could retrace back to the low $40s. The entire thesis rests on sustained elevated oil.
🔴 Already Up 43% From Lows -- SLB has rallied 25-43% since late 2025. Some analysts note the "good news is already priced in." At the ~$51 pre-selloff level, SLB traded at ~17x earnings -- above the historical average for oilfield services. The dip helps, but this isn't a deep value play.
🔴 Q1 Seasonal Weakness -- Consensus shows a -13.9% YoY EPS decline for Q1. The first quarter is traditionally the weakest for oilfield services. If the numbers disappoint even against lowered expectations, the stock could sell off hard.
🔴 U.S. Rig Count Declining -- Baker Hughes data shows 550 active rigs, down ~7% from a year ago. While SLB generates 75%+ of revenue internationally, domestic activity weakness signals broader caution among E&P operators.
🔴 Breakeven is Elevated -- The $52.44 breakeven for the whale trade requires a 10.3% rally. While analyst targets support it, SLB needs to reclaim its 52-week high for this bet to pay off. That's not a given in the middle of a geopolitical crisis that could swing either direction.
🎯 The Bottom Line
Real talk: A $2.4M bet on nearly 10,000 SLB May $50 calls with a z-score of 22.27 is the kind of trade that pops up on the tape maybe a few times a year. This is fresh institutional money, placed with conviction, on the world's most important oilfield services company during the most significant geopolitical event for oil markets in years.
The thesis is straightforward: oil stays elevated above $70, OPEC+ producers scramble to fill the Iran gap (which means more drilling and more demand for SLB's services), and the company's Q1 earnings benefit from oil prices that are $15+ above their guidance assumptions. If that scenario plays out, $52-55 is very achievable by mid-May.
Here's your action plan:
📈 If you're bullish on oil: The conservative bull call spread ($50/$55 May) gives you a 2.5:1 reward-to-risk ratio following the whale's direction. Wait for SLB to hold $47 support and show signs of stabilization before committing capital.
👀 If you're watching from the sidelines: Keep your eyes on the OPEC+ meeting on April 5. If OPEC+ signals accelerated production to offset Iran disruptions, that's your green light for SLB. Also watch WTI crude -- as long as it holds above $70, the bull case for oilfield services remains intact.
🐻 If you're bearish: Respect the $45 gamma support level and the 200-DMA at $39.54. A rapid Iran de-escalation is your trigger -- if WTI drops back below $65, SLB could quickly retrace to the low $40s. Consider put spreads only if the geopolitical situation clearly resolves.
📅 Mark your calendar:
- March 5 (TODAY) -- Maritime war-risk insurance cancellations take effect
- April 2 -- SLB dividend ex-date ($0.295/share)
- April 5 -- OPEC+ monthly meeting (May production decision)
- ~April 24 -- SLB Q1 2026 earnings ($0.62 EPS consensus)
- May 15 -- This trade's expiration day
The whale has laid down $2.4M saying SLB rallies through the chaos. With 71 days, three major catalysts, and oil prices running hot, this is one of the most compelling energy flow trades on the tape right now. 🎯
Disclaimer: This analysis is for informational and educational purposes only and should not be considered financial advice. Options trading involves significant risk of loss and is not suitable for all investors. Always do your own research, understand the risks, and consider your financial situation before making any trading decisions.