🥈 SLV Massive $16.9M Synthetic Long - Bullish Bet on Silver's Breakout! 🚀
📅 November 14, 2025 | 🔥 Unusual Activity Detected
🎯 The Quick Take
Someone just constructed a $16.9 MILLION synthetic long stock position in SLV at 12:32:17 today! This sophisticated trade bought 20,000 call contracts and sold 20,000 put contracts at the $40 strike expiring March 20, 2026 - creating pure bullish exposure for 126 days. With silver riding a historic 77.5% YTD rally to near 14-year highs at $47.42, smart money is doubling down on continued strength toward $50-65 analyst targets. Translation: Institutional capital is betting BIG that silver's rally has further to run!
📊 Company Overview
iShares Silver Trust (SLV) is the largest silver ETF providing direct exposure to physical silver bullion:
- Assets Under Management: ~$24 Billion (dominant silver ETF)
- Industry: Commodity Contracts Brokers & Dealers
- Current NAV: $48.87 / Market Price: $47.42 (as of Nov 13)
- Structure: Each share represents physical silver held in vaults
- 538.4M shares outstanding backed by silver bullion
💰 The Option Flow Breakdown
The Tape (November 14, 2025 @ 12:32:17):
| Time | Symbol | Side | Buy/Sell | Type | Expiration | Premium | Strike | Volume | OI | Z-Score | Spot | Option Price |
|---|---|---|---|---|---|---|---|---|---|---|---|---|
| 12:32:17 | SLV | - | BUY | CALL | 2026-03-20 | $15.0M | $40 | 20K | N/A | 12.77 | $47.42 | $7.50 |
| 12:32:17 | SLV | - | SELL | PUT | 2026-03-20 | $1.9M | $40 | 20K | N/A | 19.38 | $47.42 | $0.95 |
Net Position: LONG synthetic stock at $40.00 strike (currently $7.42 in-the-money)
🤓 What This Actually Means
This is a synthetic long stock position - economically identical to owning 2 million shares of SLV! Here's the breakdown:
- 💸 Net premium paid: $13.1M ($15M calls - $1.9M puts collected)
- 🎯 Effective entry price: $40.95 per share ($40 strike + $0.95 net debit)
- 📊 Current profit: ~$6.47 per share unrealized × 2M shares = $12.9M floating gain!
- ⏰ Time to expiration: 126 days (captures Q4 2025 and Q1 2026 catalysts)
- 🏦 Institutional positioning: This is sophisticated options structuring, not retail speculation
What's really happening here: This trader constructed a synthetic long position (long calls + short puts at same strike) which behaves exactly like owning 2 million shares of SLV but with capital efficiency advantages. At current price of $47.42, they're sitting on $12.9M in unrealized gains but clearly believe silver has more room to run toward $50-65. The structure shows conviction in continued upside while capturing the December Fed meeting catalyst, ongoing supply deficits, and gold-silver ratio compression.
Unusual Score: 🔥 EXTREMELY UNUSUAL
- Call Z-Score: 12.77 = Only occurs a few times per year for this size
- Put Z-Score: 19.38 = Literally off-the-charts unusual activity
- Size: 20,000 contracts = 2,000,000 shares = $94.8M notional exposure
- Context: This is hedge fund-scale positioning in a precious metals ETF
📈 Technical Setup / Chart Check-Up
YTD Performance Chart
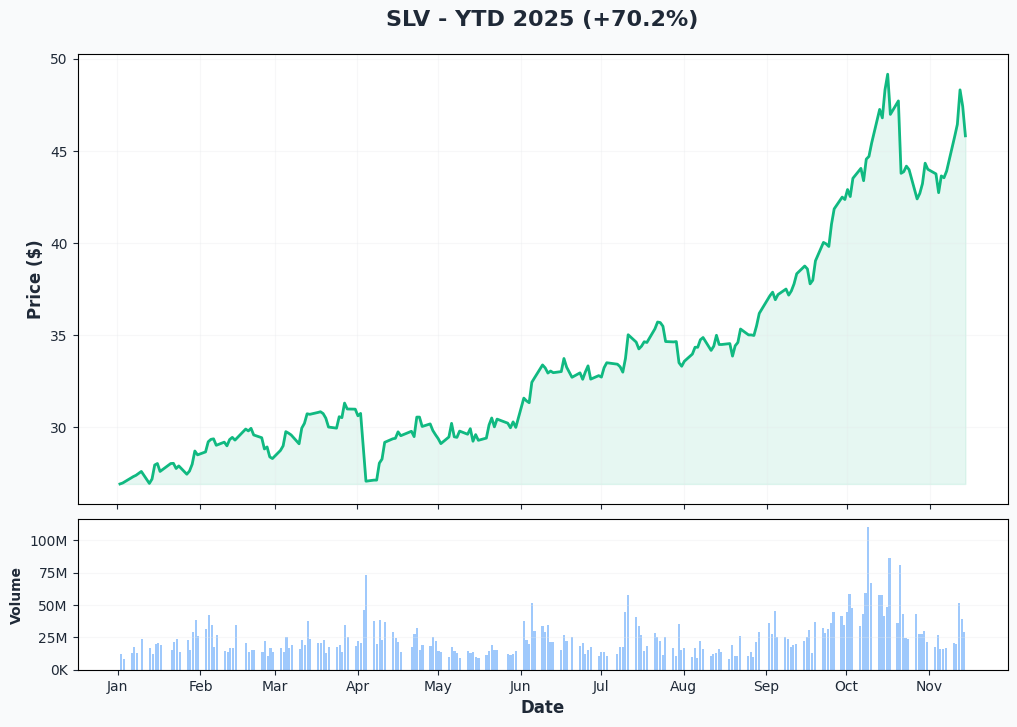
SLV is absolutely crushing it - up +77.54% YTD with a current price of $47.42 (started 2025 around $26.70). The chart tells a powerful precious metals bull market story - after testing lows around $26.23 in Q1, silver has rocketed to near 14-year highs of $49.09.
Key observations:
- 🚀 Sustained breakout: Broke through $30 resistance in Q2, never looked back
- 📈 Acceleration phase: Vertical move from $40 in late summer to $48+ currently
- 🎯 Testing 14-year highs: Approaching $50 psychological level (2011 peak was $49.80)
- 📊 Healthy consolidation: Brief pullbacks absorbed by buyers, trend intact
- ⚠️ Recent profit-taking: November outflows of -$289.63M suggest some trimming at highs
Gamma-Based Support & Resistance Analysis
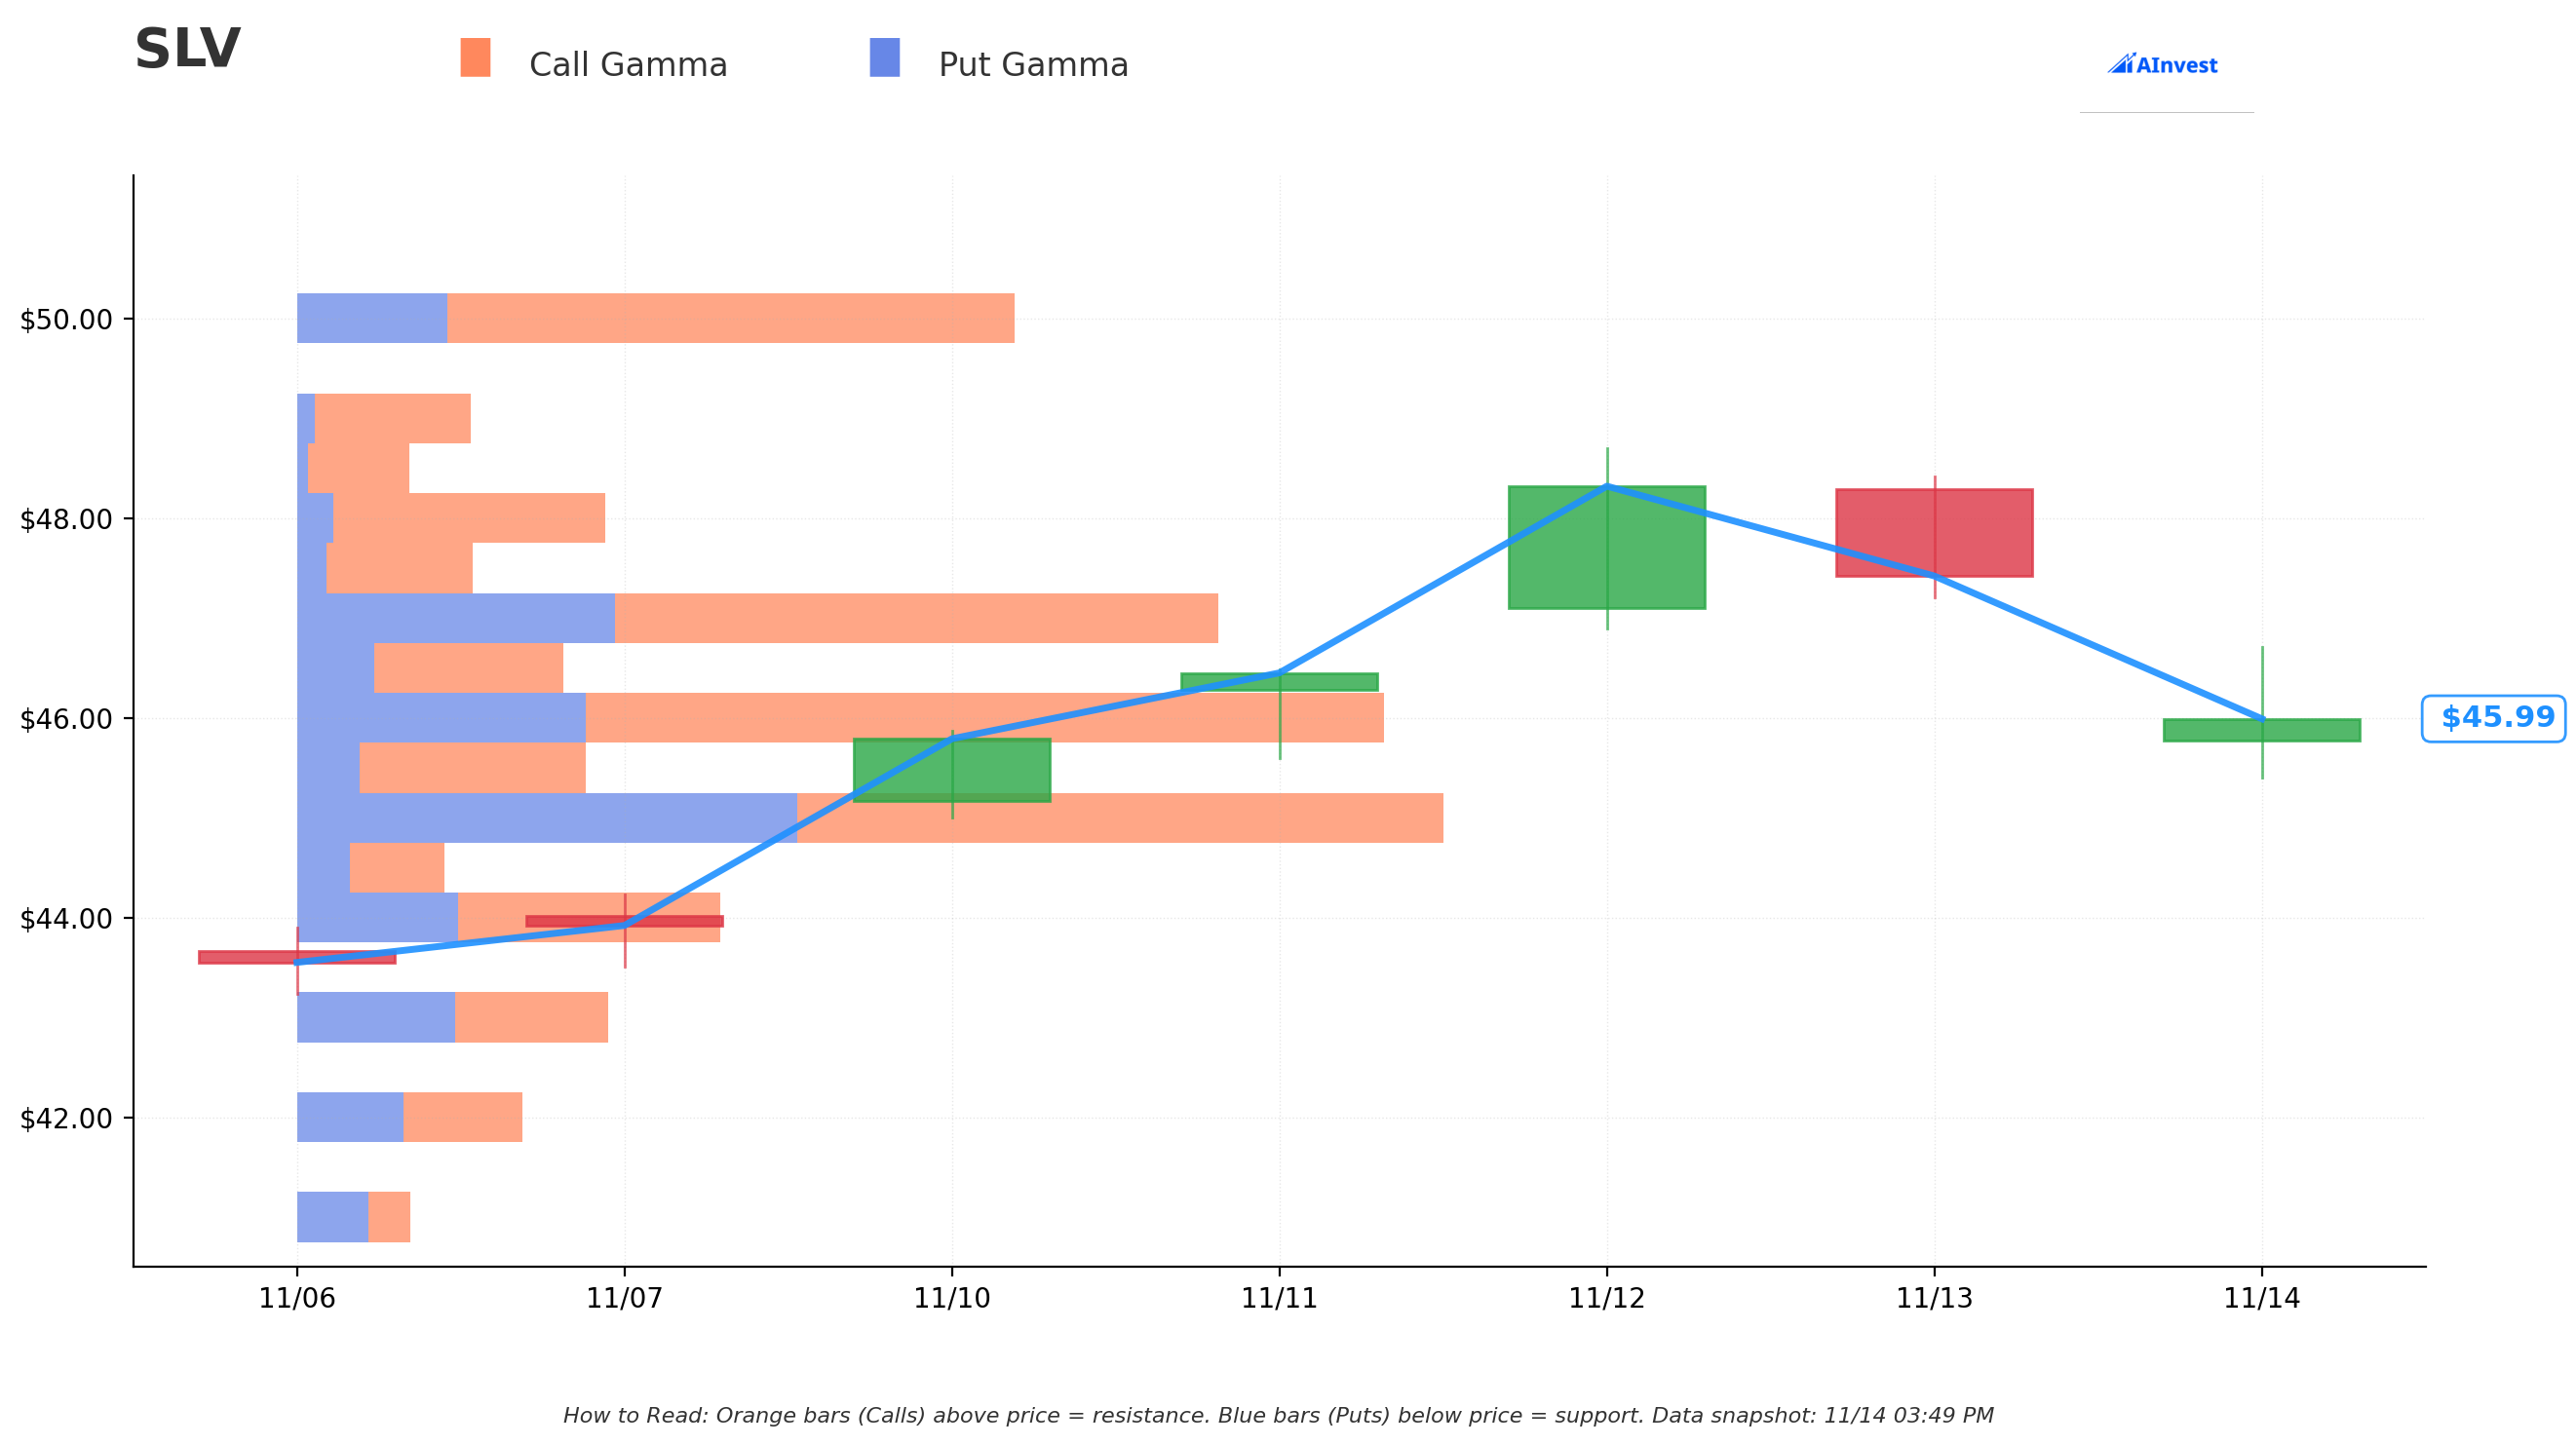
Current Price: $47.42
The gamma exposure map reveals critical price magnets and barriers for silver's next move:
🔵 Support Levels (Put Gamma Below Price):
- $46.00 - Immediate support with significant put gamma concentration on SLV puts
- $45.00 - Major floor where dealers will aggressively buy dips on SLV put spreads
- $44.00 - Secondary support level (weekly implied move lower bound)
- $42.00 - Deep support zone marking 10% pullback from highs on SLV calls/puts
- $40.00 - Structural floor (EXACTLY where synthetic long is struck - not coincidental!)
🟠 Resistance Levels (Call Gamma Above Price):
- $48.00 - Immediate ceiling, current battle zone on SLV calls
- $49.00-$50.00 - CRITICAL resistance (14-year high at $49.09, psychological $50) - SLV call chains
- $51.00 - Extended target if $50 breaks (quarterly implied move upper range) on SLV calls
- $52.00 - Bull case target zone on SLV calls
What this means for traders: SLV is testing the critical $48-50 resistance zone that has capped silver for over a decade. The gamma data shows heavy call positioning at $50, creating natural resistance as market makers hedge by selling SLV into rallies. However, the massive put support at $40 (where this synthetic long is positioned) shows institutions are willing to defend that level aggressively. This setup suggests either consolidation in the $45-49 range OR a powerful breakout above $50 that could trigger momentum to $52-55.
Notice anything? The synthetic long buyer struck EXACTLY at $40 where there's structural gamma support and conviction-level positioning. They're protected on downside and positioned for upside acceleration if silver breaks out.
Net GEX Positioning: Moderately bullish with heavier call gamma at $50+ strikes vs put gamma below $45, suggesting the options market is pricing in upside bias.
Implied Move Analysis
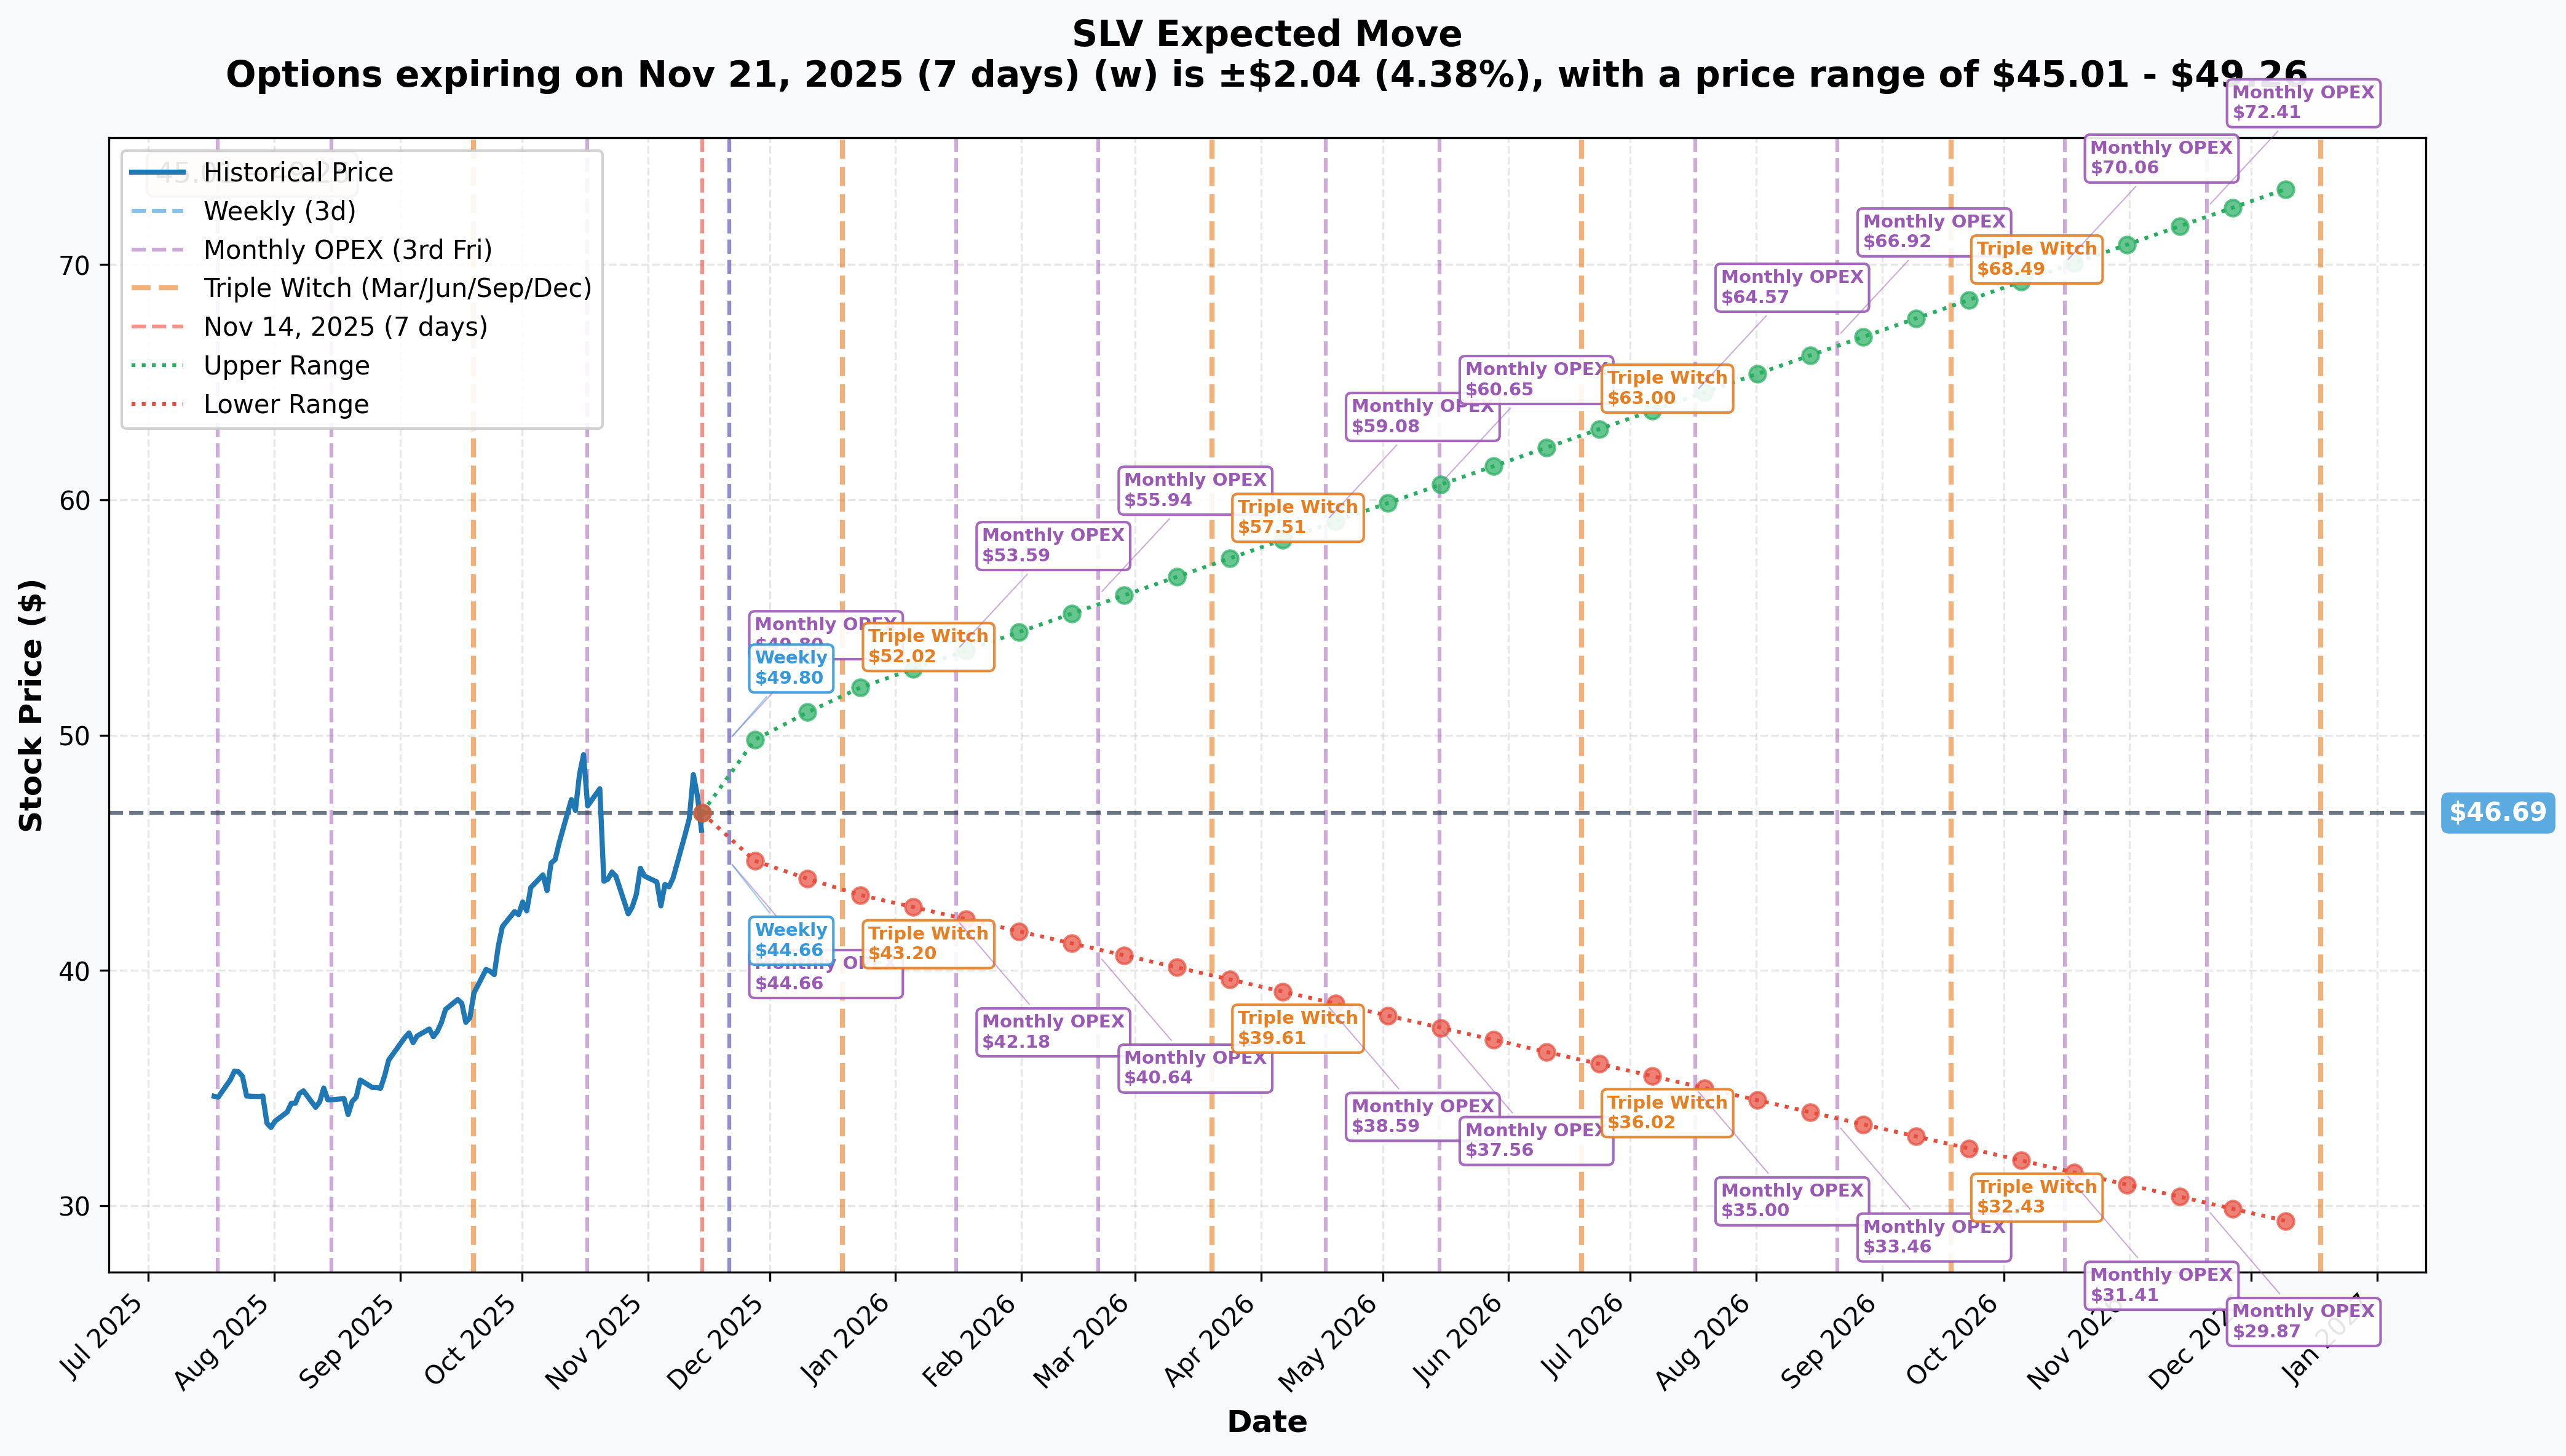
Options market pricing for upcoming expirations:
- 📅 Weekly (Nov 21 - 7 days): ±$2.04 (±4.38%) → Range: $45.01 - $49.26
- 📅 Monthly OPEX (Nov 21 - 7 days): ±$2.04 (±4.38%) → Range: $45.01 - $49.26
- 📅 Quarterly Triple Witch (Dec 19 - 35 days): ±$3.78 (±8.09%) → Range: $43.36 - $51.78
- 📅 March OPEX (Mar 20 - 126 days - THIS TRADE!): Synthetic position expires here
Translation for regular folks: Options traders are pricing in a 4.4% move ($2) by next Friday and an 8% move ($3.78) through December expiration. The market expects moderate volatility around the December 10th Fed decision and year-end positioning. The weekly implied move upper range of $49.26 suggests the market sees about 50% odds of testing the critical $49-50 level in the next week.
The December expiration range of $43.36-$51.78 is CRITICAL - it captures the Fed meeting catalyst and shows the market pricing roughly 20% upside potential ($51.78) vs 8.5% downside risk ($43.36) from current levels. This asymmetric range supports the bullish thesis.
Key insight: The relatively modest implied volatility (4-8%) compared to silver's recent moves (up 77% YTD) suggests options may be UNDERPRICING potential for a breakout above $50 or pullback below $45. This creates opportunity for directional trades.
🎪 Catalysts
🔥 Immediate Catalysts (Already Happened - Building Momentum)
Record Price Levels Achieved (October 2025)
Silver has been on fire through Q4 2025, achieving milestones not seen in over a decade:
- 🏆 Silver reached all-time high of $54.471 on October 17, 2025, surpassing both 2011 peak ($49.80) and 1980 high ($49.50)
- 📈 Strong September rally from $40.20 on Aug 29 to $46.64 by end of September, intraday high $47.41
- 💎 As of November 12, spot silver trading at $50.03 following improved rate cut expectations
- 🎯 Trading near 14-year highs, testing critical $50 psychological resistance
Fed Rate Cut Cycle Underway (September-November 2025)
The Federal Reserve has delivered multiple rate cuts supporting precious metals:
- 💰 Markets priced in three 25bp cuts in September, October, and December after holding rates at 4.25%-4.50% through mid-August
- 📊 Spot silver rose 3.6% to $50.03 on improved rate cut expectations following weak economic data in November
- 🎯 Lower rates diminish opportunity cost of holding non-yielding assets like silver, making them more attractive vs fixed income
- 📈 Historical precedent: When real rates fall below 1%, precious metals perform strongly
Supply Deficit Enters Fifth Consecutive Year
The structural supply-demand imbalance continues to worsen:
- 🏭 Global silver market projected to have 117.7 million ounce deficit in 2025 per World Silver Survey 2025
- 📊 This is the FIFTH consecutive year of structural deficit, with cumulative shortage since 2021 reaching 796-820 million ounces
- 💎 Overall 2025 deficit estimated at sizeable 95Moz
- ⚠️ This is NOT a temporary squeeze - it's a multi-year structural shortage
Record ETF Inflows (YTD through November)
Investment demand for silver has exploded:
- 📈 Exchange-traded product holdings up roughly 18% through November 6, generating YTD rise of 187Moz
- 💰 Reflects investor concerns over stagflation, Federal Reserve independence, government debt sustainability, and US dollar safe haven status
- 🚀 2025 silver ETF inflows already surpassing 2024's totals by midyear
- 💎 Silver-backed ETPs reached $40 billion valuation by mid-2025
Dollar Weakness Supporting Rally
Currency dynamics strongly favor silver:
- 📉 US Dollar Index has fallen approximately 10% in 2025, significant weakening from Fed rate cuts
- 💵 Silver has gained impressive 32% YTD through July 14, significantly outpacing gold's 27% over same period
- 🌍 Weaker dollar makes dollar-denominated silver more attractive to international buyers, boosting demand
- 📊 Silver has strong inverse relationship with US Dollar Index - when dollar weakens, silver typically strengthens dramatically
🚀 Near-Term Catalysts (Next 6 Months)
Federal Reserve December Meeting - December 10, 2025 (26 DAYS AWAY!) 📊
The next Fed decision could be the catalyst that determines if silver breaks $50:
- 📅 Next Fed interest rate decision scheduled for December 10, 2025
- 💭 Fed Chair Powell indicated cut "not a foregone conclusion," noting "strongly differing views" within committee
- 📊 However, recent weak US economic data has boosted expectations for December cut
- 🎯 If Fed cuts by 25bp as expected, average real rate will fall below 1%, with 2-3 more cuts resulting in negative real rates
- 🚀 Negative real interest rates historically correlate with strong precious metals performance
Expected Impact:
- If Fed cuts: Silver likely tests $50-52 as opportunity cost of holding silver decreases further
- If Fed holds: Potential pullback to $44-46 support, but longer-term thesis intact
- Hawkish surprise: Could trigger 8-10% correction to $42-44
Industrial Demand Explosion (2025-2026)
Silver's unique dual nature as precious metal AND industrial commodity creates powerful demand tailwinds:
Solar Sector Expansion:
- 📱 Silver demand in solar sector expected to reach 261 million ounces in 2025, up 5.5% from previous year
- 🌞 In 2025, solar demand projected to account for 14% of global demand, up from 5% in 2014
- 🔆 Silver Institute expects 20% increase in solar PV market this year alone
- 🌍 Despite pressure on US renewable projects under Trump, global photovoltaics installations expected to achieve another all-time high in 2025
Electric Vehicle Demand:
- 🚗 Automotive industry uses approximately 80 million ounces annually, expected to increase to 90 million by 2025
- ⚡ Each EV contains 25-50 grams (0.8-1.6 ounces) of silver
- 🌐 With over 17 million EVs projected globally in 2025, EV manufacturing is major contributor to rising industrial demand
Total Industrial Fabrication:
- 🏭 Silver industrial fabrication forecast to grow 3% in 2025, volumes on track to surpass 700 million ounces for FIRST TIME in history
- 📊 Industrial demand now accounts for over 60% of total global silver consumption, accelerating in 2025
Gold-Silver Ratio Reversion Trade (Q1-Q2 2026)
One of the most compelling technical setups in precious metals:
Current Valuation Gap:
- ⚖️ Gold-silver ratio currently at roughly 80 to 83 ounces of silver per ounce of gold in November 2025
- 📊 Ratio sits well above 60:1 to 75:1 historical average, with long-term average since 1900 between 50:1 and 60:1
- 💎 High GSR (like today's 80-83:1) typically suggests silver is undervalued relative to gold, signaling potential buying opportunity
Projected Ratio Compression:
- 🎯 Short-term target for 2025-2026 is for GSR to move toward 70:1, then gradually to 50:1
- 💰 GSR of 70:1 combined with gold price of $3,000-$3,300 would give silver price of $42-$47 USD per ounce
- 📈 When ratio rises far above historical 40-60:1 range, it tends to snap back quickly to that mean
Price Target Implications: If gold maintains current trajectory above $4,000/oz and gold-silver ratio compresses to 70:1, silver would trade at approximately $57 per ounce, representing 20%+ upside from current levels. Compression to 60:1 would yield $66 silver (40%+ upside).
Supply Constraints Intensifying (2025-2026)
The supply side cannot respond to higher prices quickly:
Mining Production Challenges:
- ⛏️ Global silver mines projected to yield 835-844 Moz in 2025, representing modest growth but still 7.23% decrease vs 2016 levels
- 🏭 Approximately 75% of silver comes as byproduct from other mining operations, meaning supply cannot quickly respond to price changes
- ⏰ New silver mining projects require 7-15 years from discovery to production, meaning current price strength cannot address immediate deficit
Continued Structural Deficit:
- 📊 Market deficit likely to extend into sixth consecutive year in 2026
- 🎯 Total annual demand approximately 1.2 billion ounces, mine supply provides only about 800 million ounces
- 💎 Even with recycling contributing 150 million ounces, structural gap of roughly 250 million ounces annually remains
Investment Demand Acceleration (H1 2026)
Physical investment demand continues building:
- 📈 Silver physical investment forecast to rise 3% in 2025, thanks to improving demand in Europe and North America
- 🇮🇳 Metals Focus projects 25% YoY increase in physical investment silver demand in 2025 for India
- 💰 Between 2010-2024, cumulative Indian bar and coin demand stood at 840 million ounces
- 🌐 Currency debasement concerns driving investors toward precious metals as essential hedges
⚠️ Risk Catalysts (Negative)
Trump Administration Tariff Policies
Trade policy represents the primary near-term headwind:
- 🇺🇸 On November 4, 2025, President Trump issued executive order modifying reciprocal tariff rates with China
- 📊 Earlier April 2025 tariffs escalated to 145% on Chinese goods
- 🚨 Approximately 70% of US silver imports originate from Canada and Mexico, making market highly sensitive to tariffs on these trading partners
- ⚠️ Unlike gold, silver has key function as industrial metal with over half of global demand for industrial purposes
- 💸 Latest round of US tariffs will likely reduce industrial demand for silver, potentially causing prices to decline if global trade war escalates
Recent Profit-Taking and Outflows
After massive rally, investors taking profits:
- 📉 SLV experienced significant outflows in November with 1-month net flows of -$289.63 million
- 💰 5-day net flows of -$146.24 million suggesting profit-taking after 77% YTD rally
- 📊 Week-over-week outflow of approximately $257.0 million
- ⚠️ While 6-month net flows remain positive at $1.27 billion, near-term outflows signal caution at current levels
Options Market Defensive Positioning
Institutional investors hedging despite rally:
- 🛡️ For November 21 expiry, SLV volatility surface shows elevated demand for downside protection
- 📊 46-strike put shows 52.9% IV versus 33.4% for call, suggesting institutional investors positioning defensively
- 💸 SLV is hard to borrow, with stock-loan fees ranging between 11% and 14% annualized, indicating high short interest
Federal Reserve Policy Uncertainty
The December decision remains uncertain:
- 🤔 Fed Chair Powell indicated December rate cut "not a foregone conclusion" with "strongly differing views" within committee
- 💵 If Fed holds rates steady or signals fewer cuts than expected, could strengthen dollar and pressure silver
- 📊 Dollar's 10% decline in 2025 has been major silver catalyst - any reversal would be significant headwind
Key Resistance at $50
Technical barrier represents major psychological level:
- 🎯 Silver approaching key resistance level at $50 which could determine trajectory going forward
- 📊 Metal has tested this level multiple times in 2025 without establishing sustained breakout
- ⚠️ Failure to break through convincingly could trigger consolidation or pullback to $44-45 support
🎲 Price Targets & Probabilities
Using gamma levels, implied move data, and upcoming catalysts, here are the scenarios through March 20th expiration:
📈 Bull Case (35% probability)
Target: $52-$60
How we get there:
- 💪 Fed delivers December cut and signals 2-3 more in H1 2026, driving real rates negative
- 🚀 Silver breaks decisively above $50 psychological barrier, triggering technical rally
- 🌐 Gold-silver ratio compresses from 83:1 toward 70:1 as silver outperforms gold
- 📊 Industrial demand continues accelerating toward record 700M+ ounces
- 💎 Sixth consecutive year of deficit emerges for 2026, intensifying supply concerns
- 🇨🇳 China physical buying accelerates as economic stimulus measures boost demand
- 📈 ETF inflows resume as FOMO kicks in above $50
- ⚖️ Tariff concerns ease or industrial demand proves resilient
Key metrics needed:
- Sustained trading above $50 for 3+ consecutive days
- Dollar index continuing decline below 100
- Solar and EV demand exceeding 350M ounces combined
- ETF inflows returning to positive territory
Synthetic Long P&L: At $55: Profit = $14.05 per share × 2M shares = $28.1M gain (215% ROI on $13.1M net premium paid) At $60: Profit = $19.05 per share × 2M shares = $38.1M gain (291% ROI)
Probability assessment: 35% because it requires Fed cooperation, technical breakout confirmation, and sustained momentum. However, fundamental backdrop (supply deficit, industrial demand, ratio reversion) strongly supports this scenario.
🎯 Base Case (45% probability)
Target: $44-$51 range (CONSOLIDATION)
Most likely scenario:
- ✅ Fed delivers December cut but guidance is cautious (1-2 more cuts in 2026, not 3-4)
- 📱 Silver tests $50 multiple times but fails to hold, creating trading range
- ⚖️ Industrial demand solid but tariff concerns cap enthusiasm
- 💎 Supply deficit continues but doesn't accelerate beyond current projections
- 🔄 Trading within gamma support ($44-45) and resistance ($49-50) bands through Q1 2026
- 📊 Market digests massive YTD gains (77%), waits for next catalyst
- 💤 Gold-silver ratio stays elevated at 75-80:1, compression delayed to H2 2026
- 🛡️ Recent outflows stabilize, neither major inflows nor continued redemptions
This is healthy consolidation after parabolic rally: Stock digests gains in $44-51 range, builds base for next leg higher. Synthetic long position maintains substantial unrealized gains but doesn't accelerate dramatically.
Synthetic Long P&L: At $47: Profit = $6.05 per share × 2M shares = $12.1M gain (92% ROI) - essentially current position At $50: Profit = $9.05 per share × 2M shares = $18.1M gain (138% ROI)
Why 45% probability: This reflects most likely path given stretched technical position, elevated tariff uncertainty, and natural profit-taking after 77% rally. Fundamentals remain supportive but near-term catalysts mixed.
📉 Bear Case (20% probability)
Target: $38-$44 (TEST SUPPORT)
What could go wrong:
- 😰 Fed holds in December or signals only 1 more cut in 2026 - hawkish surprise
- 🚨 Dollar strengthens on improving US economic data, breaking inverse correlation
- ⏰ Tariff escalation significantly impacts industrial demand - solar/EV sectors hit
- 💸 Broader commodity selloff drags silver lower (economic slowdown fears)
- 📊 China economic weakness intensifies, reducing industrial consumption
- 🤖 Technical breakdown below $45 triggers cascade of stop-losses
- 💰 ETF outflows accelerate beyond -$500M monthly, creating selling pressure
- 🔨 Recycling surges as high prices incentivize secondary supply, narrowing deficit faster than expected
- 📉 Break below $44 support triggers momentum to $40, testing synthetic long strike
Critical support levels:
- 🛡️ $45: Weekly implied move lower bound - MUST HOLD or momentum shifts bearish
- 🛡️ $44: Major gamma floor from options positioning
- 🛡️ $40: Synthetic long strike + deep structural support - likely intense buying here
Synthetic Long P&L: At $42: Profit = $1.05 per share × 2M shares = $2.1M gain (16% ROI) - most gains evaporate At $40: Profit = -$0.95 per share × 2M shares = -$1.9M loss (15% loss) - breakeven at strike At $38: Loss = -$2.95 per share × 2M shares = -$5.9M loss (45% loss)
Probability assessment: Only 20% because it requires multiple negative catalysts to align simultaneously. Silver's structural fundamentals (5th year of deficit, record industrial demand, ratio dislocation) provide strong downside support. The synthetic long buyer clearly has conviction that $40 holds.
💡 Trading Ideas
🛡️ Conservative: Wait for $50 Breakout Confirmation
Play: Stay in cash or metals positions until silver decisively breaks above $50
Why this works:
- ⏰ December 10th Fed decision in 26 days creates binary event risk - better to wait for clarity
- 🎯 $48-50 is 14-year resistance zone that has rejected multiple breakout attempts in 2025
- 📊 Already up 77% YTD - significant gains captured, limited urgency to chase
- 💸 Better risk/reward waiting for breakout confirmation above $50 with volume
- 📉 If breakdown below $45 occurs, can enter at much better levels with reduced risk
- 🤔 Recent -$289M SLV outflows signal smart money taking profits at highs
Action plan:
- 👀 Watch December 10th Fed decision closely - dovish (25bp cut + soft guidance) = bullish, hawkish = bearish
- 🎯 If silver breaks above $50.50 on strong volume (>2x average), that's BUY signal for momentum
- ✅ Alternatively, pullback to $44-45 gamma support creates attractive entry with 15% margin of safety
- 📊 Monitor weekly ETF flows - return to positive inflows confirms investor confidence
- ⏰ Revisit position Q1 2026 when industrial demand data (solar/EV) provides confirmation
Risk level: Minimal (cash/existing metals position) | Skill level: Beginner-friendly
Expected outcome: Avoid potential 10-15% whipsaw if consolidation continues. Get better entry if pullback occurs. Participate in breakout if it materializes with confirmation.
⚖️ Balanced: Bull Call Spread Targeting $50-52
Play: Buy bull call spread on SLV capturing upside to resistance while limiting capital at risk
Structure: Buy $48 calls, Sell $52 calls (January 16, 2026 expiration)
Why this works:
- 📊 Defined risk spread ($4 wide = $400 max risk per spread)
- 🎯 Targets breakout above $50 resistance to $52 level
- ⏰ 63 days to expiration captures December Fed decision and year-end positioning
- 💰 Limited capital required compared to buying stock or naked calls
- 🎢 If Fed delivers dovish cut, silver likely tests $50-52 range
- 🛡️ Max loss defined and acceptable if thesis doesn't play out
Estimated P&L (current market pricing):
- 💰 Pay approximately $2.00-2.50 net debit per spread
- 📈 Max profit: $150-200 per spread if SLV above $52 at January expiration (75-100% ROI)
- 📉 Max loss: $200-250 per spread if SLV below $48 at expiration (100% loss of premium)
- 🎯 Breakeven: approximately $50.00-50.50
- 📊 Risk/Reward: ~1:1 which is attractive for defined-risk bullish play
Entry timing:
- ⏰ Enter AFTER December 10th Fed decision IF dovish (don't fight pre-decision uncertainty)
- 🎯 Alternatively, enter if SLV pulls back to $46-47 (spread gets cheaper, better entry)
- ❌ Skip if SLV already above $51 (spread too expensive, limited upside remaining)
Position sizing: Risk only 3-5% of portfolio (this is directional speculation on Fed decision)
Risk level: Moderate (defined risk, bullish directional) | Skill level: Intermediate
🚀 Aggressive: Synthetic Long Replication (ADVANCED ONLY!)
Play: Replicate the institutional trade on SLV at smaller scale - synthetic long stock position
Structure: Buy $46 calls + Sell $46 puts (March 20, 2026 expiration - SAME as the $16.9M trade)
Why this could work:
- 🤝 Essentially "copying" the smart money positioning at current market levels
- 💎 Creates pure bullish exposure identical to owning 100 shares per synthetic position
- 📊 Capital efficient - requires less cash than buying stock outright (though margin/risk similar)
- ⏰ 126 days to expiration captures ALL major catalysts: Dec Fed, Q4/Q1 industrial data, potential ratio compression
- 🚀 If silver moves to $55-60 bull case, profits accelerate dollar-for-dollar
- 💰 Collects premium on short puts (
$3.00) to offset long call cost ($4.50), net debit ~$1.50
Why this could blow up (SERIOUS RISKS):
- 💸 UNLIMITED DOWNSIDE RISK on short puts - if silver crashes to $35, you're assigned 100 shares at $46 ($1,100 loss per synthetic)
- 😱 Margin requirements: Broker will require substantial margin/cash for naked short puts (typically 20-30% of notional)
- ⚠️ Two-way exposure: Unlike spreads, this has no built-in protection - you MUST manage actively
- 📉 Assignment risk: Could be forced to buy SLV at $46 if it drops and puts exercised early
- 🎢 Volatility swings of 10-15% are normal for silver - requires strong stomach
- 💰 If silver goes to $38, loss = $8/share × 100 = $800 per synthetic (plus margin interest)
Estimated P&L per synthetic long:
- 💰 Net cost: ~$1.50 per share net debit ($150 per position)
- 📈 At $52: Profit = $4.50 per share ($450) - 300% ROI
- 📈 At $60: Profit = $12.50 per share ($1,250) - 833% ROI
- 📉 At $42: Loss = -$5.50 per share ($550) - 367% loss
- 💀 At $35: Loss = -$12.50 per share ($1,250) - 833% loss
Breakeven: Approximately $47.50 (strike + net debit)
CRITICAL WARNING - DO NOT attempt unless you:
- ✅ Fully understand synthetic long mechanics and unlimited downside risk
- ✅ Have sufficient margin (broker may require $2,000-3,000 per synthetic position)
- ✅ Can handle assignment of 100 shares at $46 ($4,600 capital requirement)
- ✅ Have experience managing short options and understand early assignment risk
- ✅ Believe silver has <10% chance of breaking below $40 by March
- ⏰ Can actively monitor and adjust position if silver moves against you
- 🛡️ Have plan to close/roll if silver approaches $42-43 (don't let it breach $40)
Position sizing: Absolute maximum 5-10% of portfolio as this is highly leveraged directional bet
Risk level: EXTREME (unlimited downside, margin requirements) | Skill level: Advanced only
Probability of profit: ~50-55% (need silver above $47.50, currently at $47.42 - essentially coin flip with current positioning)
⚠️ Risk Factors
Don't get caught by these potential landmines:
-
⏰ Fed decision in 26 days creates binary event risk: December 10th meeting could go either way. Powell indicated cut "not a foregone conclusion" with "strongly differing views". Hawkish surprise (hold rates or signal only 1 more cut) could trigger 8-10% silver selloff to $42-43. Dovish surprise (cut + soft guidance) likely sends silver to test $50-52. This is 50/50 coin flip with massive implications.
-
💸 After 77% YTD rally, profit-taking intensifying: SLV outflows of -$289.63M in November show smart money trimming at highs. Trading at 14-year highs near $50 psychological level with minimal margin of safety. Any disappointment magnified when asset is up this much. "Sell in May and go away" crowd likely exiting early given massive gains.
-
🇺🇸 Trump tariff policies threaten industrial demand: 70% of US silver imports from Canada and Mexico makes market vulnerable to USMCA trade tensions. Unlike gold, silver has key industrial function with over 50% demand for industrial purposes. Tariff escalation could reduce solar/EV demand despite global strength. This is REAL risk to thesis, not theoretical.
-
💵 Dollar reversal could devastate rally: Silver has strong inverse relationship with Dollar Index - 10% dollar decline in 2025 has been major catalyst. If US economic data improves (employment, GDP, inflation moderating), Fed may turn hawkish, dollar strengthens, and silver gets crushed 15-20% in weeks. This has happened before in 2013, 2016, 2020.
-
📊 Critical $50 resistance has held for 14 years: Silver tested this level multiple times in 2025 without sustained breakout. All-time high was $54.47 in October but quickly rejected. The 2011 peak of $49.80 and 1980 peak of $49.50 create MASSIVE psychological barrier. Heavy call gamma at $50 means market makers will sell into rallies to hedge. Breaking this requires sustained institutional buying - one test won't do it.
-
🛡️ Defensive options positioning signals institutional caution: SLV volatility surface shows elevated put demand with 46-strike put at 52.9% IV vs 33.4% call IV. When puts are MORE expensive than calls despite 77% rally, institutions are buying insurance aggressively. Hard to borrow status with 11-14% stock-loan fees shows high short interest - squeeze potential BUT also crowded trade risk.
-
🌐 Gold-silver ratio could stay elevated longer than expected: Currently at 80-83:1 vs historical 50-60:1, but ratio hit 123:1 in 2020 and stayed elevated for months. "Undervalued" can become MORE undervalued if gold outperforms on safe-haven demand while silver's industrial exposure becomes liability in recession. Compression thesis requires either gold weakness OR silver strength - not guaranteed.
-
🏭 Supply response via recycling could surprise to upside: Silver recycling projected to increase 5% in 2025, volumes surpassing 200M ounces for first time since 2012. At $50 silver, MASSIVE incentive to recycle old jewelry, industrial scrap, electronics. If recycling surges to 250M+ ounces, deficit narrows from 117M to 67M, removing key bullish narrative. This happened in 2011 when silver hit $49 - recycling flood crashed prices 40% in months.
-
🇨🇳 China economic weakness intensifying: Chinese demand expected to weaken due to cautious consumer spending. China is world's largest silver consumer (solar panels, electronics, industrial). If economy slows further or property crisis deepens, industrial demand could disappoint despite global strength. This would hit silver harder than gold.
-
🎢 Volatility creates whipsaw risk: Recent 4-8% implied moves show silver can gap $2-4 on NO NEWS. This isn't a sleepy ETF - it tracks volatile commodity. Max drawdown potential of 15-20% from highs is real even in bull market. Tight stops get run, creating frustration. Need conviction to hold through swings.
🎯 The Bottom Line
Real talk: Someone just bet $16.9 MILLION on silver continuing higher through March 2026 by constructing a synthetic long position at $40. This wasn't a hedge, wasn't a spread, wasn't a gamble - this was a CONVICTION bet that silver's rally has further to run despite already being up 77% YTD at 14-year highs.
What this trade tells us:
- 🎯 Sophisticated institutional player expects silver to trade ABOVE $47.50 through Q1 2026 (that's their breakeven)
- 💰 They're willing to risk unlimited downside below $40 for unlimited upside above current levels
- ⚖️ The March 20 expiration captures December Fed decision, Q4/Q1 industrial data, and potential gold-silver ratio compression
- 📊 Position already showing $12.9M unrealized profit but holder clearly expects $50+ breakout
- ⏰ Timing sophisticated - entering AFTER 77% rally shows belief in continuation, not just early entry
This is NOT a "buy at any price" signal - it's a "the trend is your friend and fundamentals support higher prices" signal.
If you own SLV or physical silver:
- ✅ HOLD your position - fundamentals remain compelling with 5th year of deficit, record industrial demand
- 📊 Set mental alert at $50 breakout (sustained close above = next leg to $52-55)
- ⏰ Watch December 10th Fed decision closely - dovish = add, hawkish = trim
- 🎯 If you've got BIG gains (in since $30-35), consider trimming 20-30% to lock in profits, let rest ride
- 🛡️ Consider $45 as line in sand - break below that suggests consolidation/correction coming
If you're watching from sidelines:
- ⏰ December 10th Fed decision is the next major catalyst - DO NOT chase before then
- 🎯 Post-Fed scenarios: Dovish cut = enter on any dip to $48, Hawkish hold = wait for $44-45 pullback
- 📈 IF SLV breaks convincingly above $50.50 on strong volume, that's momentum buy signal to $52-55
- 🚀 Longer-term (6-12 months), gold-silver ratio compression toward 70:1 and continued industrial demand growth support $55-65 targets
- ⚠️ Current levels ($47-48) offer poor risk/reward - either wait for breakout confirmation or pullback
If you're bearish:
- 🎯 Fighting a 77% rally with institutional synthetic long buying on SLV is dangerous - wait for technical breakdown
- 📊 First meaningful resistance at $45, major support at $44 (weekly implied move lower bound)
- ⚠️ Only short if breaks below $44 on volume - that triggers cascade to $40-42
- 📉 Put spreads targeting $44-40 zone offer defined-risk way to play correction
- ⏰ Timing is EVERYTHING: Premature bearish positioning gets crushed; wait for confirmed reversal
Mark your calendar - Key dates:
- 📅 November 21 (Thursday) - Monthly OPEX, weekly implied move window closes (range: $45.01-$49.26)
- 📅 December 10 (Tuesday) - Federal Reserve interest rate decision (CRITICAL CATALYST!)
- 📅 December 19 (Thursday) - Quarterly triple witch, implied move range: $43.36-$51.78
- 📅 January 16, 2026 (Friday) - Monthly OPEX
- 📅 March 20, 2026 (Friday) - Expiration of this $16.9M synthetic long trade
- 📅 Q1 2026 (Jan-Mar) - Solar and EV industrial demand data releases
- 📅 H1 2026 (Apr-Jun) - Gold-silver ratio compression potentially accelerates
Final verdict: Silver's fundamental story remains EXTREMELY compelling - fifth consecutive year of deficit, record industrial demand toward 700M+ ounces, gold-silver ratio dislocation at 80-83:1, and Fed rate cuts supporting precious metals. The $16.9M institutional synthetic long on SLV is a CLEAR signal: smart money believes we're in early-to-mid stages of a multi-year silver bull market, not the end.
BUT, at 14-year highs after 77% rally with $50 resistance overhead and tariff/Fed uncertainty, near-term volatility is GUARANTEED. Be patient. Let December 10th Fed decision provide direction. If dovish, SLV likely breaks $50 to $52-55. If hawkish, pullback to $44-45 creates better entry. Either way, the long-term thesis (deficit, industrial demand, ratio compression) supports significantly higher prices over 12-24 months.
The silver bull market is real. The question is whether you buy SLV at $47 and ride volatility, or wait for better entry at $44-45 or breakout confirmation above $50. Choose based on your risk tolerance.
Disclaimer: Options trading involves substantial risk of loss and is not suitable for all investors. This analysis is for educational purposes only and not financial advice. Past performance doesn't guarantee future results. The unusual Z-scores (12.77 for calls, 19.38 for puts) reflect this specific trade's size relative to recent SLV history - they do not imply the trade will be profitable or that you should follow it. Synthetic long positions carry unlimited downside risk identical to owning stock. Commodities are highly volatile and can experience rapid price swings. Always do your own research and consider consulting a licensed financial advisor before trading. The December Fed decision creates binary event risk with potential for 5-10% moves either direction.
About iShares Silver Trust (SLV): iShares Silver Trust is the largest silver ETF with approximately $24 billion in assets under management, providing investors direct exposure to physical silver bullion stored in vaults, in the Commodity Contracts Brokers & Dealers industry.