🥈 SLV: $64M Massive Silver Positioning as Fed Decision Looms!
📅 December 9, 2025 | 🔥 Extreme Unusual Activity Detected
🎯 The Quick Take
Someone just deployed $64.2 MILLION across five separate silver option legs in a sophisticated multi-leg strategy! This is institutional money making a major long-term silver bet through March 2026, with near-term hedging through December 19. With the Federal Reserve's rate decision coming December 9-10 and silver already up 100% year-to-date, this complex positioning tells us big money is preparing for more upside while managing near-term volatility.
💰 The ETF Overview
What is SLV?
The iShares Silver Trust (SLV) is the world's largest physically-backed silver ETF, designed to track the price of silver bullion. Launched in 2006, SLV holds actual physical silver bars in vaults and provides investors pure silver exposure without the hassle of storing bars themselves.
Key Stats:
- 💰 AUM: $29.32 billion (as of December 2, 2025)
- 📊 Current Price: $55.06 (December 9, 2025)
- 📈 YTD Performance: +101.04%
- 🏦 Structure: 100% physical silver bullion held in trust
- 💸 Expense Ratio: 0.50%
- 📍 Exchange: NYSE Arca
What's in the Vault: SLV doesn't invest in mining stocks or derivatives - it literally owns physical silver bars stored in London vaults. When you buy shares, you're getting exposure to real metal. The fund's holdings represent approximately 567 million ounces of silver, making it one of the largest silver holders in the world.
💰 The Option Flow Breakdown
📊 What Just Happened
Here's the complete breakdown of this $64.2M silver positioning:
| Date | Time | Buy/Sell | Type | Strike | Expiration | Volume | Premium | Strategy | Z-Score | Classification |
|---|---|---|---|---|---|---|---|---|---|---|
| 12/09 | 10:38:44 | BUY | CALL | $40 | 2025-12-19 | 23,000 | $33.0M | Complex Roll | 4.97 | EXTREMELY UNUSUAL |
| 12/09 | 10:38:44 | SELL | CALL | $50 | 2026-03-20 | 24,000 | $16.0M | Complex Roll | 9.58 | EXTREMELY UNUSUAL |
| 12/09 | 10:38:44 | SELL | PUT | $50 | 2026-03-20 | 23,000 | $5.9M | Complex Roll | 109.28 | EXTREMELY UNUSUAL |
| 12/09 | 11:08:47 | BUY | CALL | $50 | 2026-01-16 | 15,000 | $7.8M | Custom Spread | 1.28 | ABOVE AVERAGE |
| 12/09 | 11:08:47 | SELL | PUT | $50 | 2026-01-16 | 14,000 | $1.5M | Custom Spread | 2.15 | HIGHLY UNUSUAL |
Total Capital Deployed: $64.2 million
🤓 What This Actually Means
Let me break down this complex multi-leg strategy in plain English:
The Near-Term Play (December 19, 2025):
- ✅ Bought $33M worth of deep in-the-money $40 calls - This is closing out an existing position, taking profits on a winning bet as silver sits at $55
- This trade has a Z-score of 4.97, meaning it's 5 standard deviations above normal activity - translation: happens a few times a year
The Long-Term March 2026 Setup:
- 🎢 Sold $50 calls for $16M - Capping upside at $50 but collecting massive premium
- 🛡️ Sold $50 puts for $5.9M - Getting paid to potentially buy silver at $50
- The put volume shows a Z-score of 109.28 - this is astronomically unusual, happening maybe once every few years
- Combined, this creates a short strangle at the $50 strike through March 2026
The January 2026 Bridge:
- 🚀 Bought $7.8M in $50 calls - Maintaining upside exposure through January OPEX
- 💰 Sold $50 puts for $1.5M - Additional premium collection at the $50 level
What It All Means: This trader is rolling profits from a winning December position into a strategic March 2026 setup centered around $50. They're collecting $23.4M in premium by selling both calls and puts at $50, suggesting they believe silver will trade near $50 by March. The $50 strike is clearly the pivotal level in their thesis.
📈 Chart Check-Up
YTD Performance Review
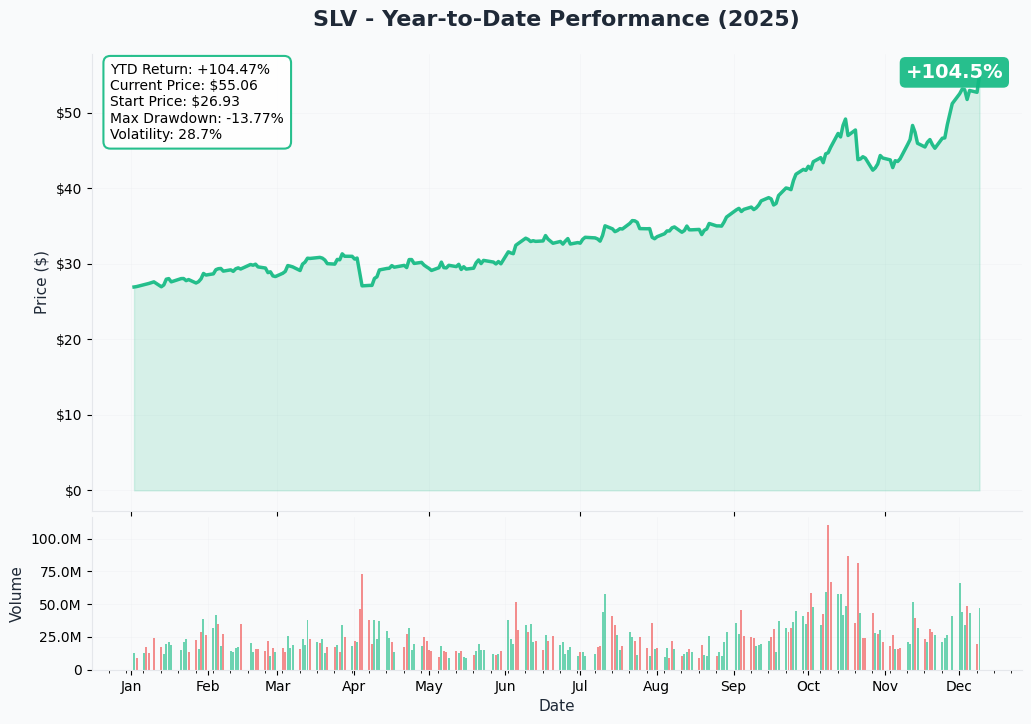
The Epic Silver Rally of 2025:
Silver (SLV) has delivered one of the most spectacular performances in commodity history during 2025. Starting the year around $28 per ounce, SLV has exploded 101% year-to-date to current levels of $55. Let me walk through the key chapters of this historic rally:
Q1 2025 (January-March): The Foundation
- Silver started consolidating in the low $30s, building energy
- Trade tensions and 84% tariffs on Chinese goods caused volatility, briefly dropping silver below $30
- Silver lease rates jumped above 6% in March 2025, signaling physical market stress
Q2 2025 (April-June): The Breakout
- Silver began its systematic march higher, breaking above $35
- During H1 2025, silver-backed ETPs saw net inflows of 95 million oz., taking global holdings to 1.13 billion oz.
- Supply deficit concerns intensified as industrial demand accelerated
Q3 2025 (July-September): The Acceleration
- Silver smashed through $45, then $48 in late September
- On October 9, silver broke its previous all-time high
- Reached all-time high of $54.47 on October 17
Q4 2025 (October-December): The Moonshot
- October pullback to $48 created a launchpad for the final surge
- Historic peak of $57.16 in late November, marking 90% YoY gains
- CME Group's Comex trading halted for 10 hours on November 28 after price spiked to $56.53
- New all-time high of $59.32 on December 5 as Fed rate cut expectations rose
- Silver hit $60.33 on December 9, up 3.79% in a single day
Current Position: As of market close December 9, SLV trades at $55.06, with the ETF managing $29.32 billion in assets. The rally shows no signs of exhaustion, with multiple structural catalysts still in play for 2026.
🎯 Gamma-Based Support & Resistance Analysis
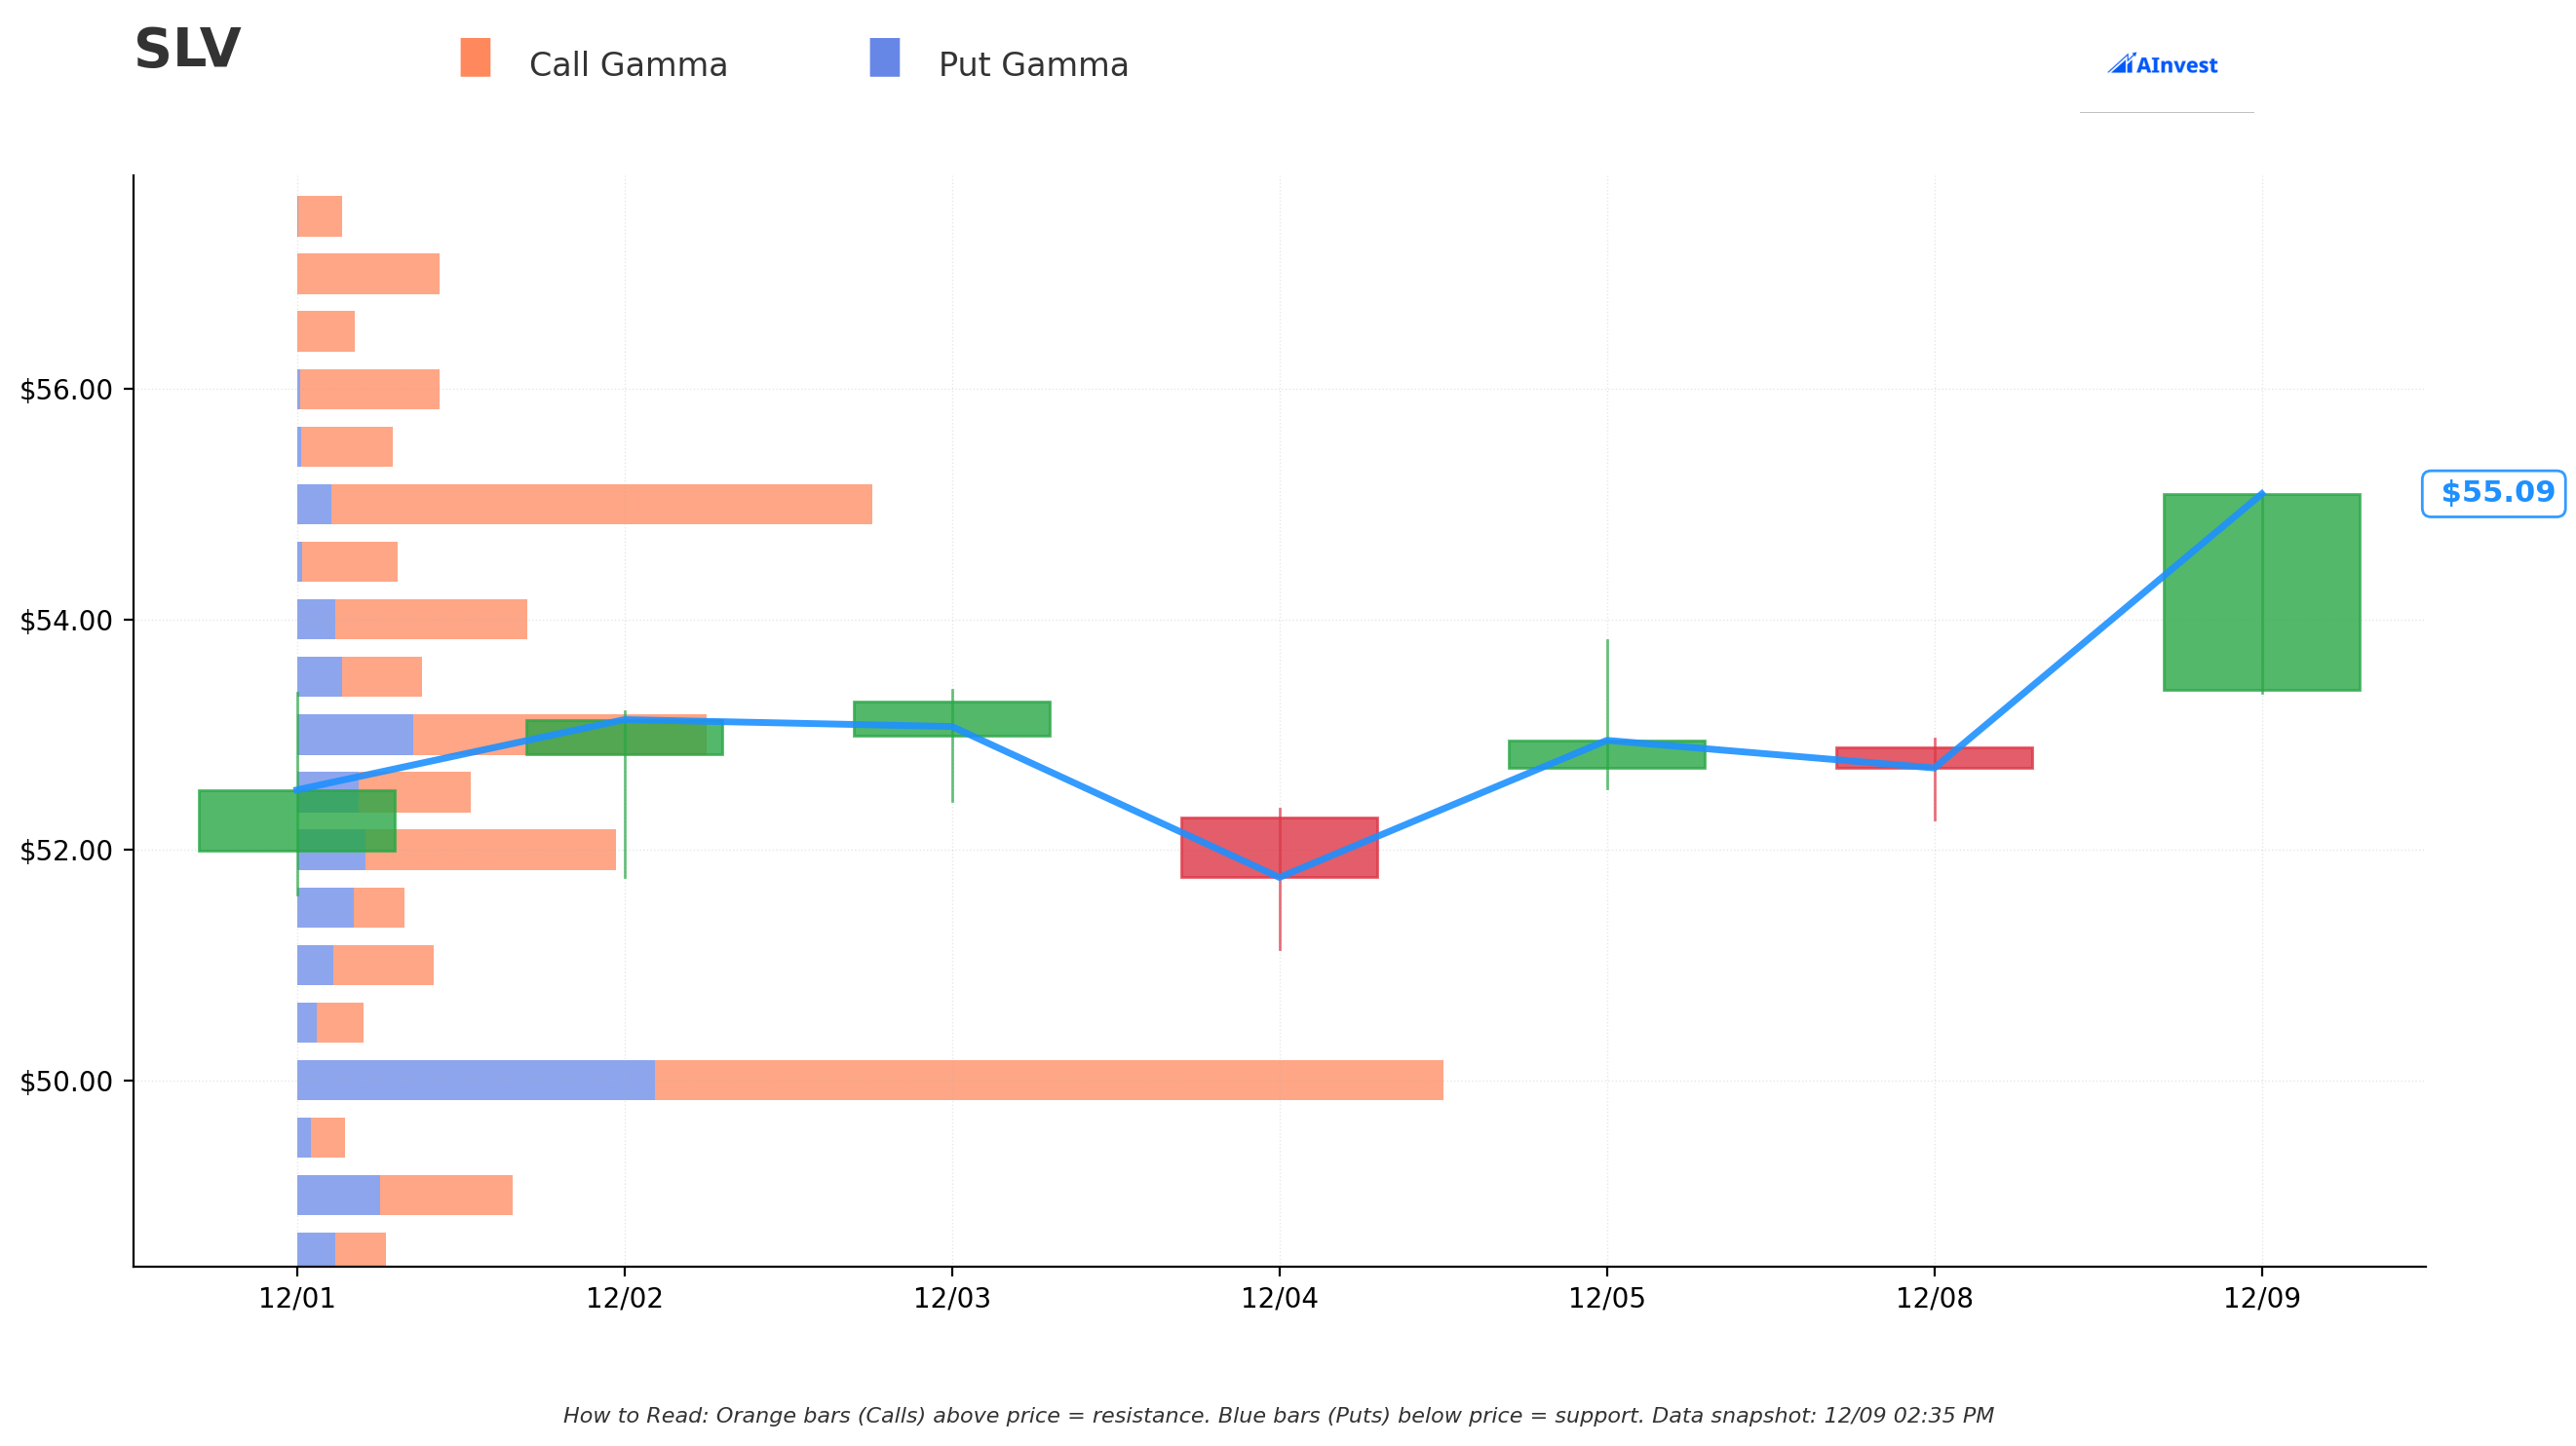
Understanding Gamma Levels: Options dealers have to hedge their positions by buying/selling the underlying asset. Large concentrations of options at specific strikes create "gamma walls" that act as magnets or barriers for price movement. Blue bars show put gamma (support), orange bars show call gamma (resistance).
Current Price Action:
- 📍 Current Price: $55.06
- 🎯 Immediate Support: $55.00 (Net GEX: $57.7M)
- 🚧 Major Resistance: $60.00 (Net GEX: $47.4M)
Support Levels (Where Dealers Buy):
-
🔵 $55 Strike - Strongest support with $57.7M net gamma
- Call GEX: $61.5M | Put GEX: $3.9M
- Just 0.1% below current price - acting as immediate floor
-
🔵 $50 Strike - Critical long-term support with $49.0M net gamma
- Call GEX: $89.8M | Put GEX: $40.8M
- 9.2% below current price
- This is exactly where our whale positioned their March strangle!
-
🔵 $54 Strike - Secondary support at $17.5M net gamma
- 1.9% below current price
-
🔵 $53 Strike - Tertiary support at $20.1M net gamma
- 3.7% below current price
Resistance Levels (Where Dealers Sell):
-
🟠 $60 Strike - Major resistance with $47.4M net gamma
- Call GEX: $48.5M | Put GEX: $1.0M
- 9.0% above current price
- This is the first major wall preventing the next leg up
-
🟠 $65 Strike - Secondary ceiling at $9.0M net gamma
- 18.1% above current price
- Break above $60 and this becomes the next target
What This Means for Traders: The gamma profile is decisively bullish with $620.8M in total call gamma vs. just $227.9M in put gamma. The $50-$55 zone has massive support, while $60 represents the key battle zone. If we break $60 with conviction, there's limited resistance until $65.
Notice how the $50 strike has huge two-way gamma ($89.8M calls + $40.8M puts) - this is exactly where institutional money positioned their March strangle, suggesting they expect price to orbit this level over the coming months.
📊 Implied Move Analysis
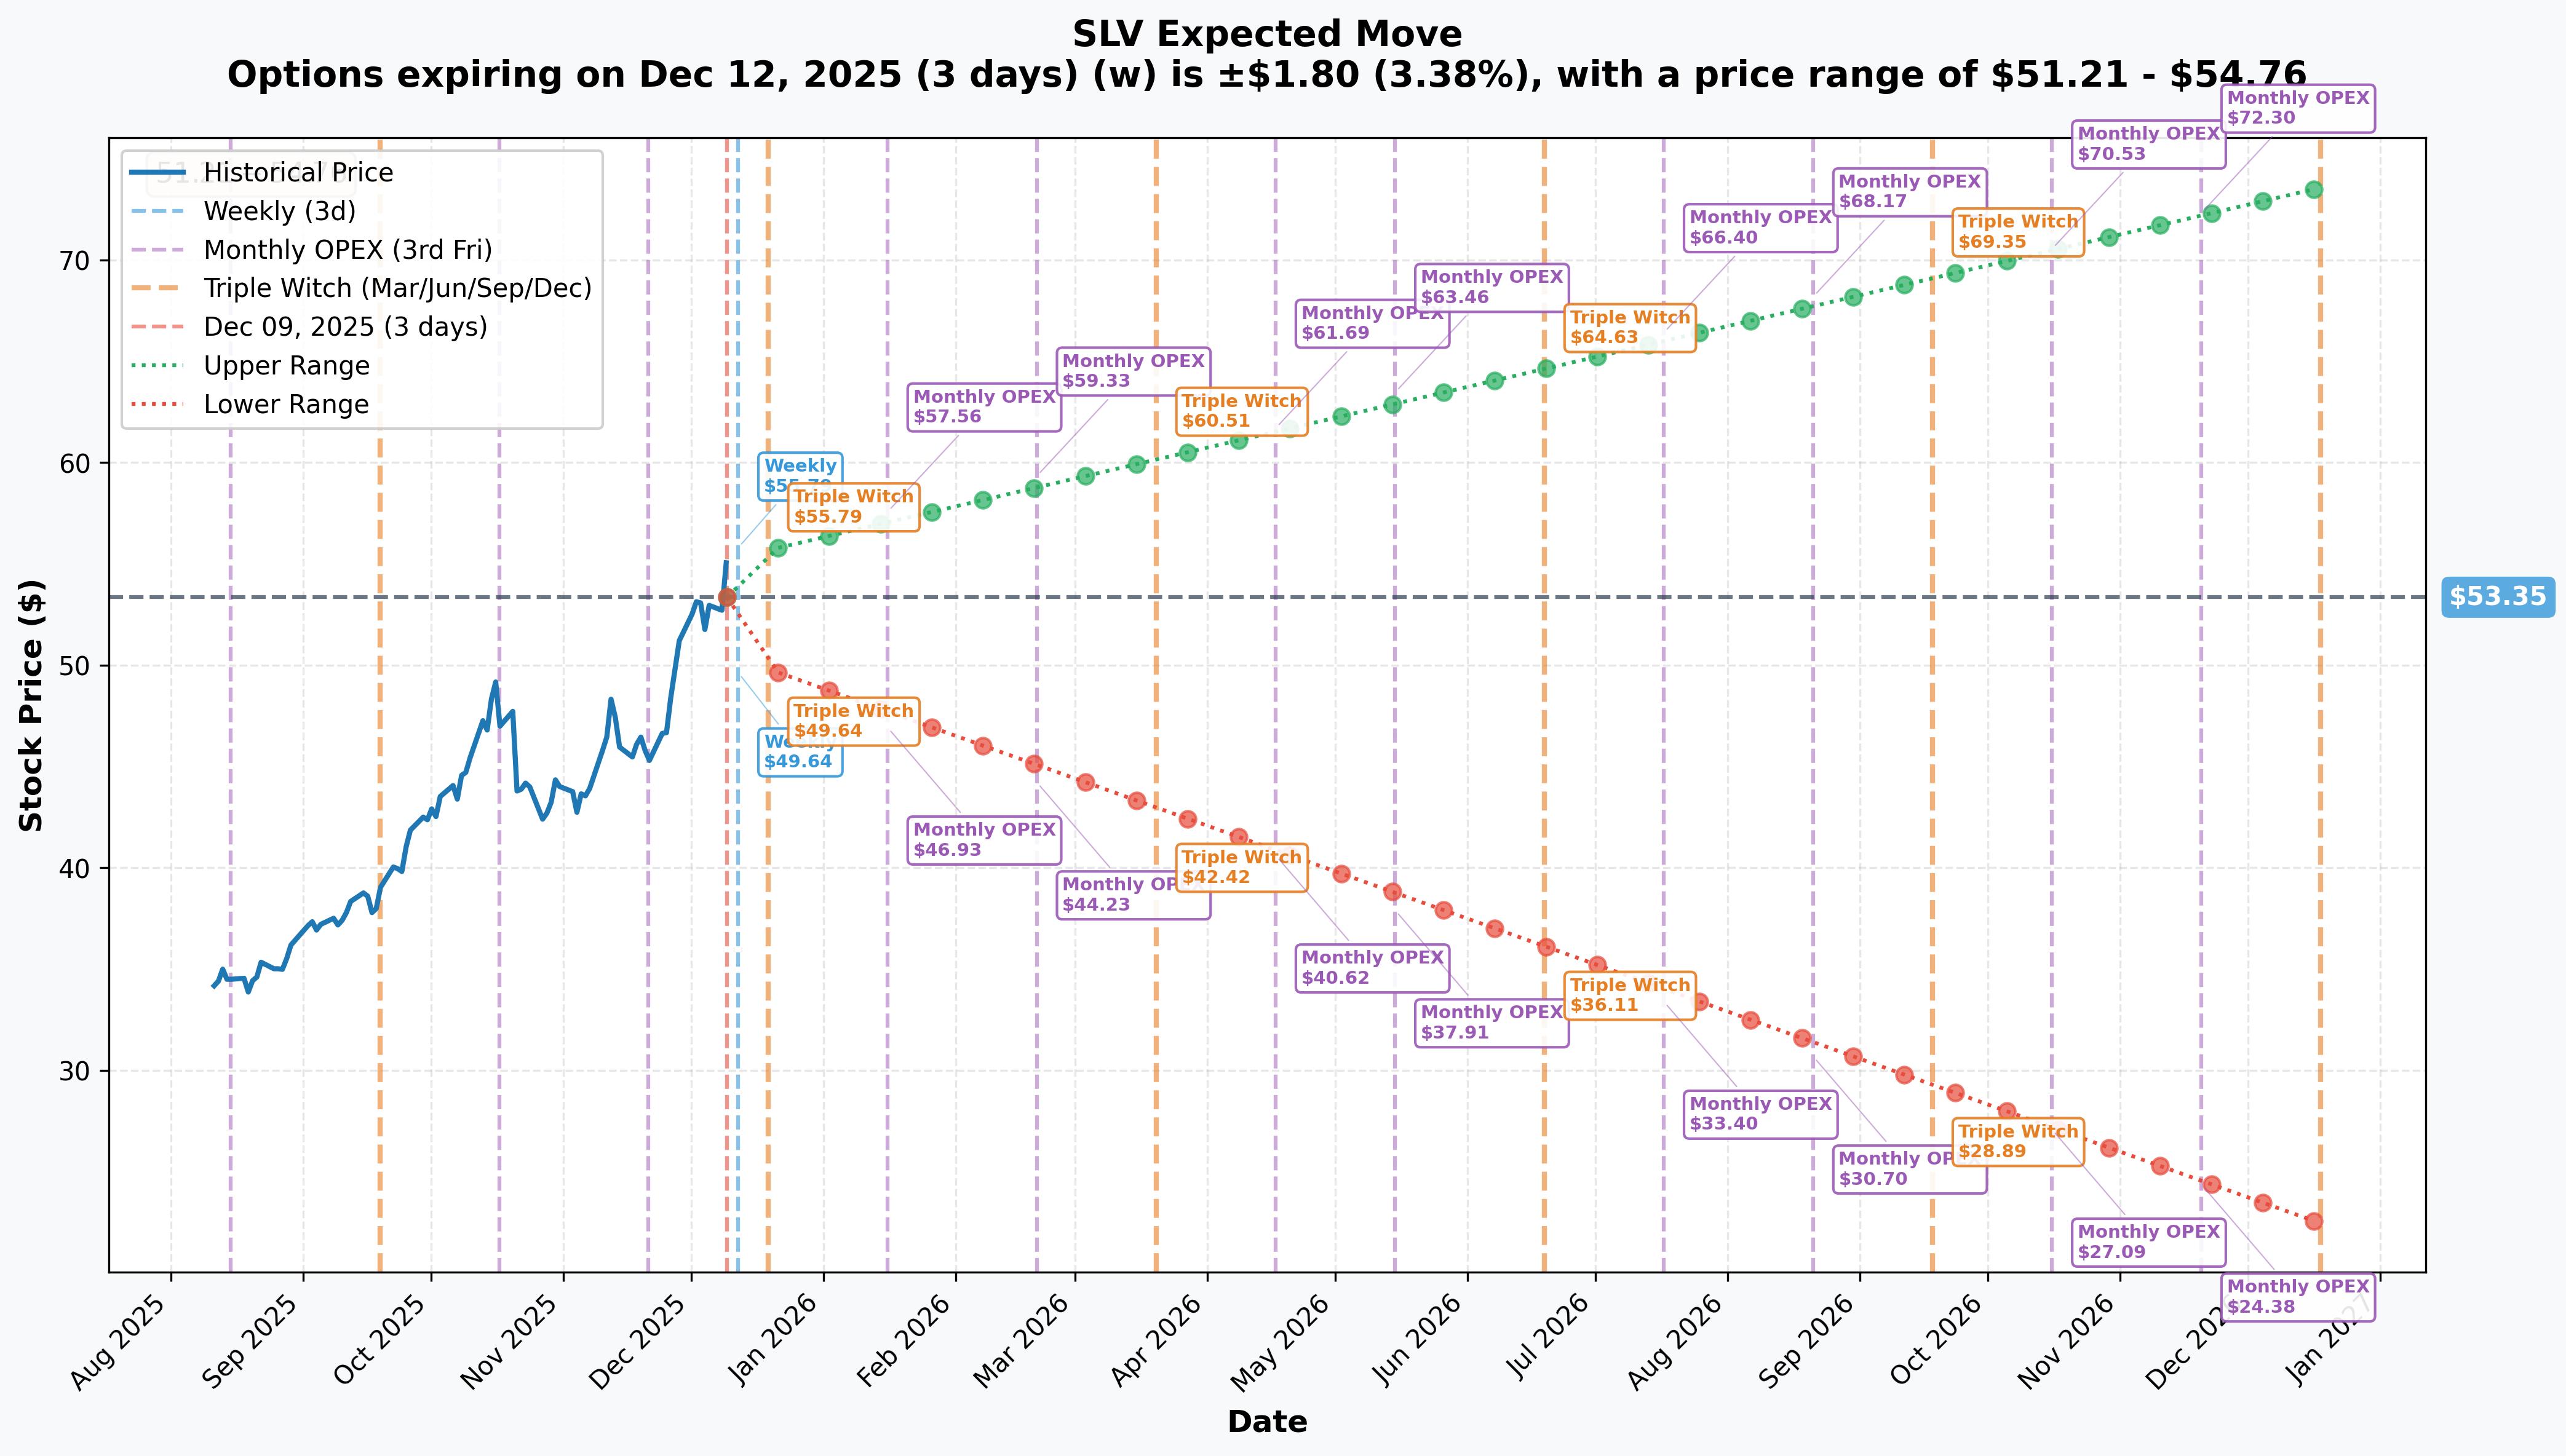
Understanding Implied Moves: The options market is pricing in expected trading ranges based on actual volatility bets. These aren't guesses - they're based on real money being wagered on price movement.
Key Timeframes:
📅 Weekly (December 12, 2025 - 3 days out):
- 📈 Implied Move: 3.38% ($1.80)
- 🎯 Range: $51.21 - $54.76
- ✅ Reliability: High
- Translation: Options market expects $1.80 of movement in either direction by Friday
📅 Monthly OPEX (December 19, 2025 - 10 days out):
- 📈 Implied Move: 5.15% ($2.75)
- 🎯 Range: $49.79 - $55.69
- ✅ Reliability: High
- This is the expiration for the $33M buy-to-close call position!
- Market pricing in potential $6 range ($49.79-$55.69) by December 19
📅 January OPEX (2026-01-16 - 38 days out):
- 📈 Implied Move: 9.69% ($5.17)
- 🎯 Range: $46.93 - $57.56
- ✅ Reliability: High
- This matches the $50 call/put custom spread expiration
📅 March OPEX (2026-03-20 - 101 days out):
- 📈 Implied Move: 13.31% ($7.10)
- 🎯 Range: $42.42 - $60.51
- ✅ Reliability: High
- This is where the massive $50 strangle expires!
- Notice the upper range of $60.51 aligns perfectly with our gamma resistance at $60
What The Market Is Telling Us:
- Near-term (Dec 12): Expect choppy 3.4% moves around Fed decision
- Mid-term (Jan 16): Market pricing 10% potential swing through January OPEX
- Long-term (Mar 20): 13% implied move suggests range of $42-$61
The $50 strike sits right in the middle of every timeframe's projected range, validating why institutional money chose this level for their strangle strategy.
🎪 Catalysts
🔥 Already Happened (Recent)
Historic Price Action:
- ✅ December 9, 2025: Silver hit new all-time high of $60.33, up 3.79% in single day
- ✅ December 5, 2025: Silver reached record $59.32 as Fed rate cut expectations jumped to 90%
- ✅ November 28, 2025: Price spiked to $56.53, triggering 10-hour CME Comex trading halt
- ✅ Late November: Historic peak of $57.16 per troy ounce, marking 90% YoY increase
- ✅ October 17, 2025: All-time high of $54.47
Record ETF Inflows:
- ✅ 2025 Year-to-Date: Inflows into silver ETPs reached $4.8 billion, crushing 2024's full-year total of $0.9 billion
- ✅ Early December: ETF holdings surged by roughly 200 tons in single session, pushing inventories to highest since 2022
- ✅ November 2025: Investors added 15.7 million ounces, largest monthly inflow since July
- ✅ H1 2025: Silver-backed ETPs saw net inflows of 95 million oz., taking global holdings to 1.13 billion oz.
Supply Deficit Intensification:
- ✅ 2025 Deficit: Global supply of 1,030 million oz. vs. demand of 1,148 million oz., creating 187 million oz. shortfall
- ✅ Fifth Consecutive Year: Cumulative deficit since 2021 reaches nearly 800 million ounces
- ✅ October 2025: Silver lease rates exceeded 30%, signaling unprecedented physical market tightness
Industrial Demand Acceleration:
- ✅ December 9, 2025: Silver Institute releases report showing photovoltaic demand jumped 25% in 2024 to 230 million oz.
- ✅ 2024 Record: Industrial applications hit new record of 680.5 million oz., up 4%
🚀 Coming Up (Future Catalysts)
This Week - THE BIG ONE:
- 🔥 December 9-10, 2025: FOMC meeting underway
- Markets pricing 88-90% probability of 25bp rate cut, up from 66% in November
- Expected to feature most significant internal Fed disagreements since 1992
- Lower rates = more attractive for non-yielding assets like silver
December 2025:
- 📅 December 12: Weekly options expiration - implied 3.4% move
- 📅 December 19: Monthly OPEX - $33M call position expiration, implied 5.2% move
Q1 2026:
- 📅 January 16, 2026: Monthly OPEX - $50 call/put custom spread expires
- 📅 February 20, 2026: Monthly OPEX
- 📅 March 20, 2026: Triple Witch OPEX - Massive $50 strangle expiration ($21.9M premium collected)
Upcoming Supply/Demand Dynamics:
- 📊 Global silver production expected to increase only 2.0% in 2025 to 944 million oz.
- 📊 Over 2025-2030 period, production projected to decline at -0.9% CAGR to 901 million oz. by 2030
- 📊 Silver demand for PV applications could exceed 300 million oz. annually by 2030
2026 Analyst Forecasts:
- 💰 Bank of America: $65 per ounce high, $56.25 average for 2026
- 💰 Larry Lepard (Equity Management): $75 by mid-2026, $80-$90 by year-end
- 💰 Metals Focus: Could breach $60 by late 2026 if supply deficits persist
Potential Bearish Catalyst:
- ⚠️ Solar manufacturers reducing silver use for first time - 2025 demand may drop 7% to 194 million oz.
- ⚠️ Chinese manufacturer AIKO pioneering copper substitution which is 100x cheaper
- However, replacing silver is "not a drop-in process" requiring major workflow changes
🎲 Price Targets & Probabilities
Bull Case: $60-$65 by March 2026 (Probability: 45%)
The Thesis: Silver breaks through the $60 gamma resistance wall and runs toward Bank of America's $65 target by Q1 2026.
What Needs to Happen:
- ✅ Fed delivers 25bp cut this week and signals more cuts coming in Q1 2026
- ✅ Dollar Index stays pinned below 99, maintaining weak-dollar tailwind
- ✅ ETF inflows continue at current pace (currently running 5x ahead of 2024)
- ✅ Physical market tightness persists with lease rates staying elevated
- ✅ Industrial demand stays strong, particularly from solar/AI sectors
Key Price Levels:
- 🎯 $60 - Break this gamma wall and momentum accelerates
- 🎯 $65 - BoA's 2026 high target
- 🎯 $70 - Longforecast.com's February 2026 target
SLV Price Targets: $56-$61 (tracking silver's move)
Base Case: $50-$55 Range Through March 2026 (Probability: 40%)
The Thesis: Silver consolidates in the $50-$55 zone, which is exactly where institutional money positioned their strangle. This is the "sweet spot" scenario.
What Needs to Happen:
- 📊 Fed cuts 25bp but takes hawkish tone on future cuts
- 📊 Economic data mixed - no clear recession signal but growth slowing
- 📊 Silver alternates between $50 support (loaded with $89.8M call gamma + $40.8M put gamma) and $55 resistance
- 📊 Supply deficit continues but doesn't accelerate
- 📊 Solar thrifting starts to show minor demand impact
Why This Makes Sense: The $50 strike has the second-highest total gamma on the board ($130.6M total GEX), making it a natural magnet for price. The fact that institutional money sold both calls and puts here suggests they expect silver to hover near this level, allowing them to collect the full $21.9M premium.
SLV Trading Range: $47-$51
Bear Case: $42-$48 Retracement (Probability: 15%)
The Thesis: Fed turns hawkish, dollar strengthens, and profit-taking accelerates after 100% YTD gains.
What Needs to Happen:
- 📉 Fed cuts 25bp but signals pause in January 2026
- 📉 Dollar Index breaks above 99, strengthening significantly
- 📉 China economic data disappoints, hitting industrial demand expectations
- 📉 Solar copper substitution gains traction faster than expected
- 📉 Profit-taking after historic 100%+ gains triggers cascade
Support Levels:
- 🛡️ $50 - First major support (massive gamma wall)
- 🛡️ $48 - Secondary support level
- 🛡️ $42.42 - March implied move lower bound
SLV Downside Targets: $39-$45
💡 Trading Ideas
🛡️ Conservative: The "Income on Dips" Strategy
Setup: Sell SLV cash-secured puts at support levels to get paid while waiting to buy the dip.
Trade:
- Sell SLV March 20, 2026 $48 puts
- Premium: ~$2.00-$2.50 per share ($200-$250 per contract)
- Collateral Required: $4,800 per contract (cash-secured)
- Break-Even: $45.50-$46.00
Why This Works:
- You're getting paid $250 to potentially buy SLV at $48, which is 12.8% below current price
- The $48 strike sits just above our gamma support and within the March implied move range ($42.42-$60.51)
- If SLV stays above $48, you keep the premium and roll forward
- If assigned, you own SLV at an effective cost of $46, a solid entry given the structural supply deficit
Best For: Traders who want to own silver long-term but prefer to get paid while waiting for better entry
Risk: You could miss the rally if silver breaks to $60+, but you keep the premium
⚖️ Balanced: The "Follow the Whale" Call Spread
Setup: Mirror the institutional positioning with a bullish call spread into January OPEX.
Trade:
- Buy SLV January 16, 2026 $52 calls
- Sell SLV January 16, 2026 $58 calls
- Net Debit: ~$2.50-$3.00 ($250-$300 per spread)
- Max Profit: $3.00-$3.50 ($300-$350 per spread)
- Break-Even: $54.50-$55.00
Why This Works:
- You're positioned for the continued rally toward $60 resistance
- Risk is limited to $250-$300 per spread (2% of SLV price)
- Max profit at $58 (5.4% above current) gives you 100-140% return on risk
- Expiration in 38 days gives you time through Fed decision, year-end flows, and January OPEX
- Aligns with the institutional $50 call buying we saw in the flow
Position Sizing: Risk 1-2% of portfolio ($2,500-$5,000 = 10-20 spreads)
Exit Plan:
- Take profits at 50% max gain ($1.50-$1.75) if we hit $56-$57 early
- Exit by January 9 regardless to avoid theta decay in final week
Risk: If silver consolidates at $50-$52, spread expires worthless. Max loss is limited to initial debit.
🚀 Aggressive: The "Volatility Explosion" Straddle
Setup: Buy a straddle ahead of the Fed decision, betting on a big move in either direction.
Trade:
- Buy SLV December 19, 2025 $54 call
- Buy SLV December 19, 2025 $54 put
- Total Debit: ~$4.00-$4.50 ($400-$450 per straddle)
- Break-Even Points: $49.50-$50.00 (down) or $58.00-$58.50 (up)
Why This Works:
- Options market pricing 5.15% implied move ($2.75) by December 19
- Fed decision this week will be most contentious since 1992
- With silver at all-time highs, any surprise (hawkish or dovish) could trigger $5+ move
- The December 19 expiration captures Fed decision + Powell presser + any follow-through
- You profit if SLV moves beyond the implied range in either direction
What You Need: SLV needs to move to $49 (down 11%) or $59 (up 7%) by December 19 for this to be profitable. Given the 3.79% single-day move we just saw on December 9, this is absolutely possible.
Best For: Traders who believe the Fed decision will cause outsized volatility beyond what's priced in
Risk Management:
- This is a pure volatility bet - you lose if SLV stays range-bound
- Max loss is $450 per straddle if SLV finishes at $54 on December 19
- Consider exiting at 50% loss ($225) if it's clear the big move isn't coming
Profit Scenarios:
- SLV at $60 on Dec 19: Straddle worth ~$6.00, profit = $150-$200 per straddle (33-44% gain)
- SLV at $48 on Dec 19: Straddle worth ~$6.00, profit = $150-$200 per straddle (33-44% gain)
- SLV at $54 on Dec 19: Straddle worth $0, loss = $450 (100% loss)
⚠️ Risk Factors
1. Federal Reserve Policy Reversal
The Risk: If inflation re-accelerates or the Fed takes a more hawkish stance, rising real yields and a strengthening dollar could hammer silver.
What Could Happen:
- If real interest rates rise (hawkish Fed), non-yielding assets like silver become less attractive
- A stronger U.S. Dollar through renewed rate hikes could pull prices back under $45
- Strong dollar tends to keep silver prices at bay
Current Status: Dollar Index pinned below 99, real yields compressed from 2.1% to 1.4% - both supportive. But this could change quickly with hawkish Fed surprise.
2. Global Economic Recession
The Risk: Silver gets hit with a double whammy: industrial demand (59% of consumption) collapses while investment demand shifts to cash.
What Could Happen:
- If global economy slows more than expected, industrial silver demand would likely soften
- If US or China sees a hard landing, solar/electronics orders could plummet
- Ongoing concerns about Chinese economy have weighed on silver
Bear Case Scenario: Meaningful pullback toward $25-$35 if ETF outflows accelerate and industrial demand craters.
3. Solar Silver Substitution & Thrifting
The Risk: The solar industry (largest industrial use) successfully reduces silver consumption, undermining a key demand pillar.
What's Happening:
- Global solar manufacturers set to reduce silver use for first time in years
- Silver demand for solar modules may drop to 194 million oz. in 2025, down 7% from 2024
- Chinese manufacturer AIKO announced using copper for interconnections - copper is 100x cheaper
- AIKO states: "copper processes will inevitably become the standard for BC solar cells"
Counterpoint:
- Replacing silver is "not a drop-in process" requiring major design changes
- Some new solar technologies actually increase silver loading - TOPCon uses 1.5x more, SHJ uses 2x more than PERC cells
- Process complexity and equipment costs slow adoption
Timeline Risk: If substitution accelerates in 2026-2027, it could significantly reduce the 230 million oz. annual PV demand.
4. Geopolitical & Trade Tensions
The Risk: Trade wars, tariffs, or supply chain disruptions create violent volatility.
Historical Context:
- 84% tariff on Chinese goods triggered silver drop from $35 to below $30 earlier in 2025
- U.S. relies on Canada and Mexico for roughly 70% of silver imports
- Silver more volatile than gold due to smaller market size
What This Means: Expect 5-10% single-day moves in either direction on major geopolitical headlines. This cuts both ways - can create opportunity or losses.
5. Profit-Taking After Historic Rally
The Risk: After a 100%+ YTD gain, technical traders and momentum funds start booking profits.
Technical Warning Signs:
- Silver already at all-time highs - no resistance levels to guide next moves
- Parabolic moves often lead to equally sharp corrections
- Retail FOMO typically marks near-term tops
What To Watch: If we see multiple consecutive days of ETF outflows after this historic inflow streak, it could signal the start of a correction.
6. SLV-Specific Structural Risks
Expense Ratio Drag:
- SLV's 0.50% expense ratio is higher than competitors like SIVR (0.30%)
- Amount of silver represented by shares decreases over time due to fees
- Without price increases to compensate, share price will decline
Tracking Issues: During extreme volatility, physical ETFs can trade at premiums/discounts to NAV. The London-COMEX $2.00 price differential we saw in October shows how market dislocations can impact ETF pricing.
🎯 The Bottom Line
Real talk: We just witnessed $64.2 million in sophisticated silver positioning centered around the $50 strike through March 2026. This isn't retail FOMO - this is institutional money rolling profits from a winning December bet into a strategic long-term setup.
What The Smart Money Is Telling Us:
The trade structure reveals three key insights:
-
Near-term profit-taking is happening - The $33M buy-to-close of December $40 calls shows someone locking in gains after silver's historic run to $60.33
-
$50 is the pivotal level - Selling both calls and puts at $50 for March means they expect price to orbit this level. This aligns perfectly with our gamma analysis showing $50 as the second-strongest support ($130.6M total GEX)
-
Volatility is expected to compress - Selling premium through strangles works when you expect the asset to trade in a range. After a 100% YTD rally, some consolidation makes sense
For Different Types of Traders:
If You Own SLV:
- ✅ Hold core position - structural supply deficit (800M oz. cumulative since 2021) supports higher prices
- ✅ Consider selling calls at $58-$60 to collect premium if you want income
- ✅ Set stop at $50 if you're nervous about profit-taking
- ⏰ Mark calendar for Fed decision this week - expect 3-5% volatility
If You're Watching:
- 👀 Wait for dip to $50-$52 zone (strong gamma support) for entries
- 👀 Watch Fed decision December 9-10 - hawkish surprise could create buying opportunity
- 👀 Monitor ETF flow data - streak of inflows breaking would be first warning sign
- 🎯 Target entry: $50 or lower, which gives you the same level institutional money chose
If You're Bearish:
- 📉 Wait for break below $50 on high volume before shorting
- 📉 Consider buying puts only if Fed turns aggressively hawkish
- 📉 Remember: 5th consecutive year of supply deficit means structural tailwinds remain
- ⚠️ Fighting a trend this strong requires perfect timing - high risk
The Bigger Picture:
Silver isn't done. Here's why the bull case remains intact for 2026:
- 💰 Bank of America forecasts $65 by 2026
- 💰 Larry Lepard sees $75-$90
- 📊 Global production declining at -0.9% CAGR through 2030 while demand grows
- 📊 PV demand could hit 300M oz. by 2030 even with thrifting
- 📊 Industrial demand now 59% of total, up from 50% a decade ago
Final Thought:
This $64M positioning is not a bet against silver - it's a strategic management of an already winning position. They're taking profits on December calls while maintaining long exposure through January and March. The $50 strangle collects $21.9M in premium, which only works if silver stays relatively stable.
Translation: After a 100% moonshot, expect some consolidation. But the structural story (supply deficit + industrial demand + Fed easing) remains intact. Use any dip toward $50 as a gift, not a reason to panic.
And remember: Goldman Sachs warns silver is riskier than gold due to volatility. Size your positions accordingly.
⚠️ Disclaimer:
This analysis is for educational and informational purposes only and should not be construed as investment advice. Options trading involves substantial risk of loss and is not suitable for all investors. The data presented reflects option flow from December 9, 2025, and market conditions can change rapidly. Past performance (including the 100%+ YTD return) is not indicative of future results. Always conduct your own due diligence, understand the risks involved, and never invest more than you can afford to lose. The author may hold positions in securities discussed. All data sourced from publicly available market information as of December 9, 2025.
🔗 Useful Links:
- SLV on Ainvest
- SLV December 19, 2025 $40 Call Chart
- iShares Silver Trust Official Page
- Silver Institute Supply-Demand Reports
Analysis completed December 9, 2025 | Market data as of 4:00 PM ET