💎 SLV Monster $17.5M Spread Unwind - Smart Money Taking Profits at Peak Silver! 🛡️
📅 December 17, 2025 | 🔥 Unusual Activity Detected
🎯 The Quick Take
Someone just unwound a MASSIVE $17.5 MILLION options position on SLV (iShares Silver Trust) at 14:17:23 today! This sophisticated trader closed out a custom spread - selling 14,000 puts for $12M while buying back 18,000 calls for $5.5M - locking in profits after silver's historic +113% YTD rally. With SLV trading at $60.30 near all-time highs following an unprecedented run from $26 to $58+, smart money is taking chips off the table. Translation: Institutions are cashing in after silver's best year in decades!
📊 ETF Overview
iShares Silver Trust (SLV) is the world's largest silver-backed ETF, providing direct exposure to physical silver bullion:
- Assets Under Management: $27.05 Billion (up from $23B at year start)
- ETF Category: Commodities - Precious Metals
- Current Price: $60.30 (near 52-week high of $58.56)
- Expense Ratio: 0.50%
- Primary Holdings: Physical silver bullion held by JPMorgan Chase Bank (custodian)
- Tax Treatment: Taxed as collectible (max 28% long-term capital gains rate)
How it works: SLV uses a physically-backed methodology, directly holding silver bullion rather than futures contracts. This eliminates contango/backwardation issues common in futures-based commodity ETFs, providing investors with more realistic pricing of the actual metal.
💰 The Option Flow Breakdown
The Tape (December 17, 2025 @ 14:17:23):
| Time | Symbol | Buy/Sell | Call/Put | Expiration | Premium | Strike | Volume | OI | Size | Spot | Option Price | Option Symbol |
|---|---|---|---|---|---|---|---|---|---|---|---|---|
| 14:17:23 | SLV | SELL | PUT | 2026-03-20 | $12.0M | $65 | 14K | 39K | 14,000 | $60.30 | $0.86 | SLV_20260320P65 |
| 14:17:23 | SLV | BUY | CALL | 2026-03-20 | $5.5M | $65 | 18K | 48K | 18,000 | $60.30 | $0.31 | SLV_20260320C65 |
🤓 What This Actually Means
This is a profit-taking spread unwind after a monster rally! Here's what went down:
- 💸 Net cash collected: $6.5M ($12M puts sold - $5.5M calls bought back)
- 🎯 Same strike, same expiration: Both legs at $65 strike, March 20, 2026 expiration (93 days out)
- 📊 Custom spread structure: This trader likely established this position MONTHS ago when silver was much lower
- ⏰ Strategic timing: Closing RIGHT at silver's peak near all-time highs after 113% YTD rally
- 🏦 Institutional sophistication: This is a complex multi-leg spread - not retail YOLO trading
What's really happening here: This trader originally constructed a bullish spread when SLV was trading significantly lower (likely in the $40-50 range months ago). Now, with silver up 113% YTD and SLV at $60.30, they're closing out BOTH sides of the spread to lock in their massive gains. The fact they're taking profits rather than letting this ride tells us smart money thinks silver might be near-term overbought.
Think of it like this: They made their money on the epic silver rally driven by supply deficits and solar demand. Now they're cashing out at the top rather than getting greedy. The 14,000 put contracts at $65 strike they sold collected $12M in premium, while buying back the 18,000 calls at $65 cost them $5.5M. Net result: $6.5M+ profit locked in from the spread, PLUS whatever gains they made on the underlying silver position.
Unusual Score: 🔥 HIGHLY UNUSUAL (Sell side: 0.94 Z-score classified as TYPICAL | Buy side: 3.14 Z-score classified as EXTREMELY UNUSUAL) - The call buying side is incredibly rare, happening only twice in recent history based on similar trades. Combined premium of $17.5M represents approximately 12.2x average SLV option size. This happens maybe a few times per year for SLV!
📈 Technical Setup / Chart Check-Up
YTD Performance Chart
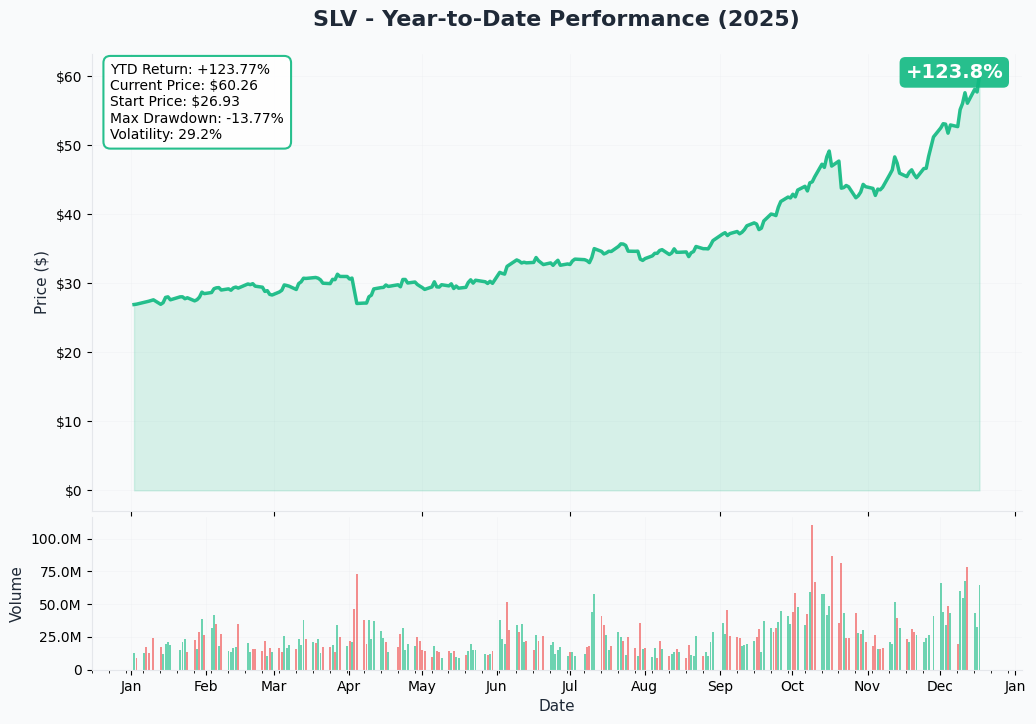
SLV is absolutely on FIRE - up +113.06% YTD with current price of $60.30 (started the year at $28.30). The chart tells an extraordinary precious metals bull market story - a relentless climb from $26 lows in early 2025 to near-record highs of $58.50+.
Key observations:
- 🚀 Historic rally: Silver posted its best year in decades, vastly outperforming gold (+31.3%)
- 📈 Acceleration phase: Vertical move from $48 in October to $60+ in December as supply deficit narrative intensified
- 🎢 Minimal pullbacks: Very few meaningful corrections - classic bull market "buy every dip" behavior
- 📊 Volume explosion: Record ETF inflows of $2.62B annually as institutions pile in
- ⚠️ Overbought extremes: RSI likely pegged at 70+ after doubling in 12 months - consolidation or pullback risk
The chart shows clean higher highs and higher lows throughout 2025, confirming the structural bull market driven by fifth consecutive year of supply deficits and explosive industrial demand from solar panels. However, the vertical nature of the recent move from $48 to $60 suggests the rally may need to pause and digest gains before the next leg higher.
Gamma-Based Support & Resistance Analysis
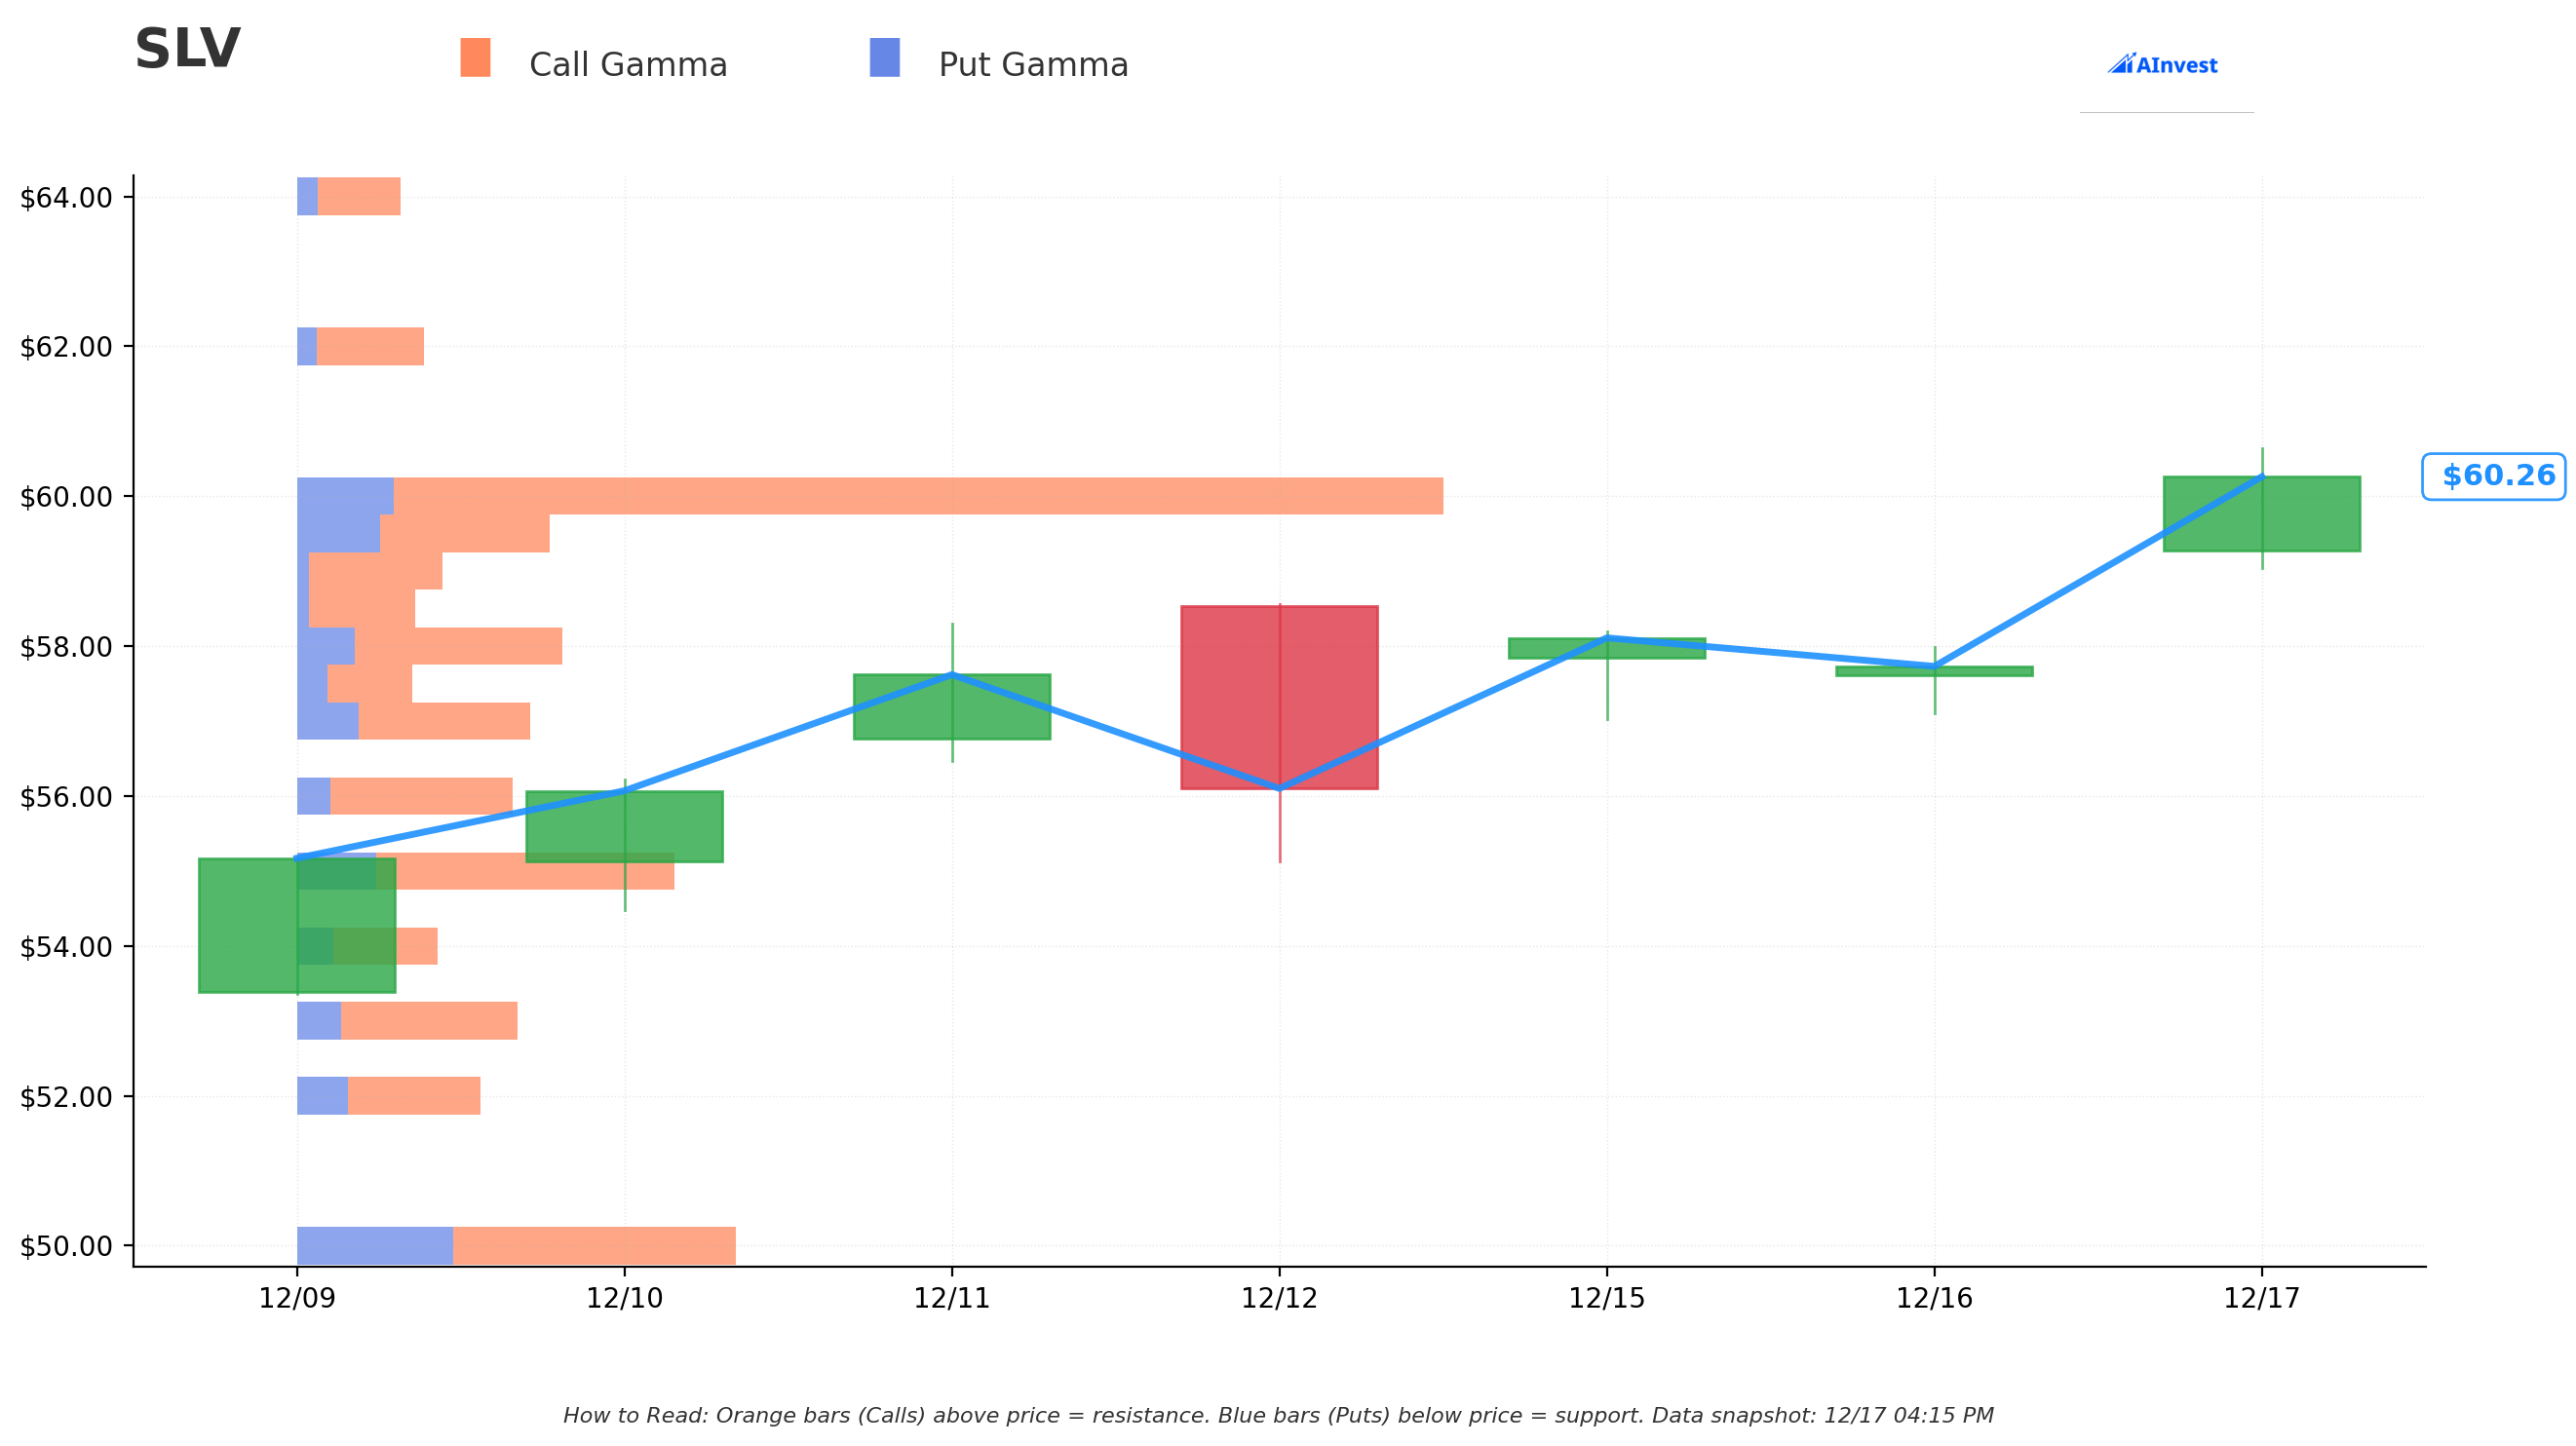
Current Price: $60.30
The gamma exposure map reveals critical price magnets and barriers for near-term silver trading:
🔵 Support Levels (Put Gamma Below Price):
- $60.00 - Immediate support with 143.6B total gamma exposure (STRONGEST nearby floor! Net GEX: +119.3B)
- $59.50 - Secondary support at 31.7B gamma (dealers will defend aggressively)
- $58.00 - Major structural floor with 33.3B gamma (3.8% below current, key technical level)
- $57.00 - Intermediate support at 29.2B gamma (5.5% below)
- $56.00 - Deep support zone with 27.0B gamma
- $55.00 - Major support cluster at 47.3B gamma (8.8% below current - CRITICAL FLOOR)
- $53.00 - Extended support with 27.7B gamma
- $50.00 - Disaster scenario floor at 55.0B gamma (17% drop required)
🟠 Resistance Levels (Call Gamma Above Price):
- $65.00 - Major ceiling zone with 51.1B gamma (7.8% overhead - EXACTLY where this spread was struck!)
- $70.00 - Extended upside target at 41.6B gamma (16% rally required)
What this means for traders: SLV has MASSIVE gamma support directly underneath current prices at the $60 level (143.6B - the single largest level on the entire board!). This creates a strong floor that dealers will defend by buying dips aggressively. The next major support cluster sits at $55 with 47.3B gamma - this is the LINE IN THE SAND. Any break below $55 would be a significant technical breakdown.
On the upside, the $65 level shows substantial resistance with 51.1B gamma. Notice anything? The spread trader closed BOTH legs at exactly $65 strike - they positioned right at the major resistance level, recognizing this would be a difficult ceiling to break through. Smart money knows that wall of call gamma at $65 means natural selling pressure as market makers hedge.
Net GEX Bias: BULLISH (663.4B call gamma vs 196.0B put gamma) - Overall positioning remains overwhelmingly bullish with 3.4x more call gamma than put gamma. This suggests the market expects silver to stay elevated or move higher, but the concentration of resistance at $65 creates a near-term ceiling.
Implied Move Analysis
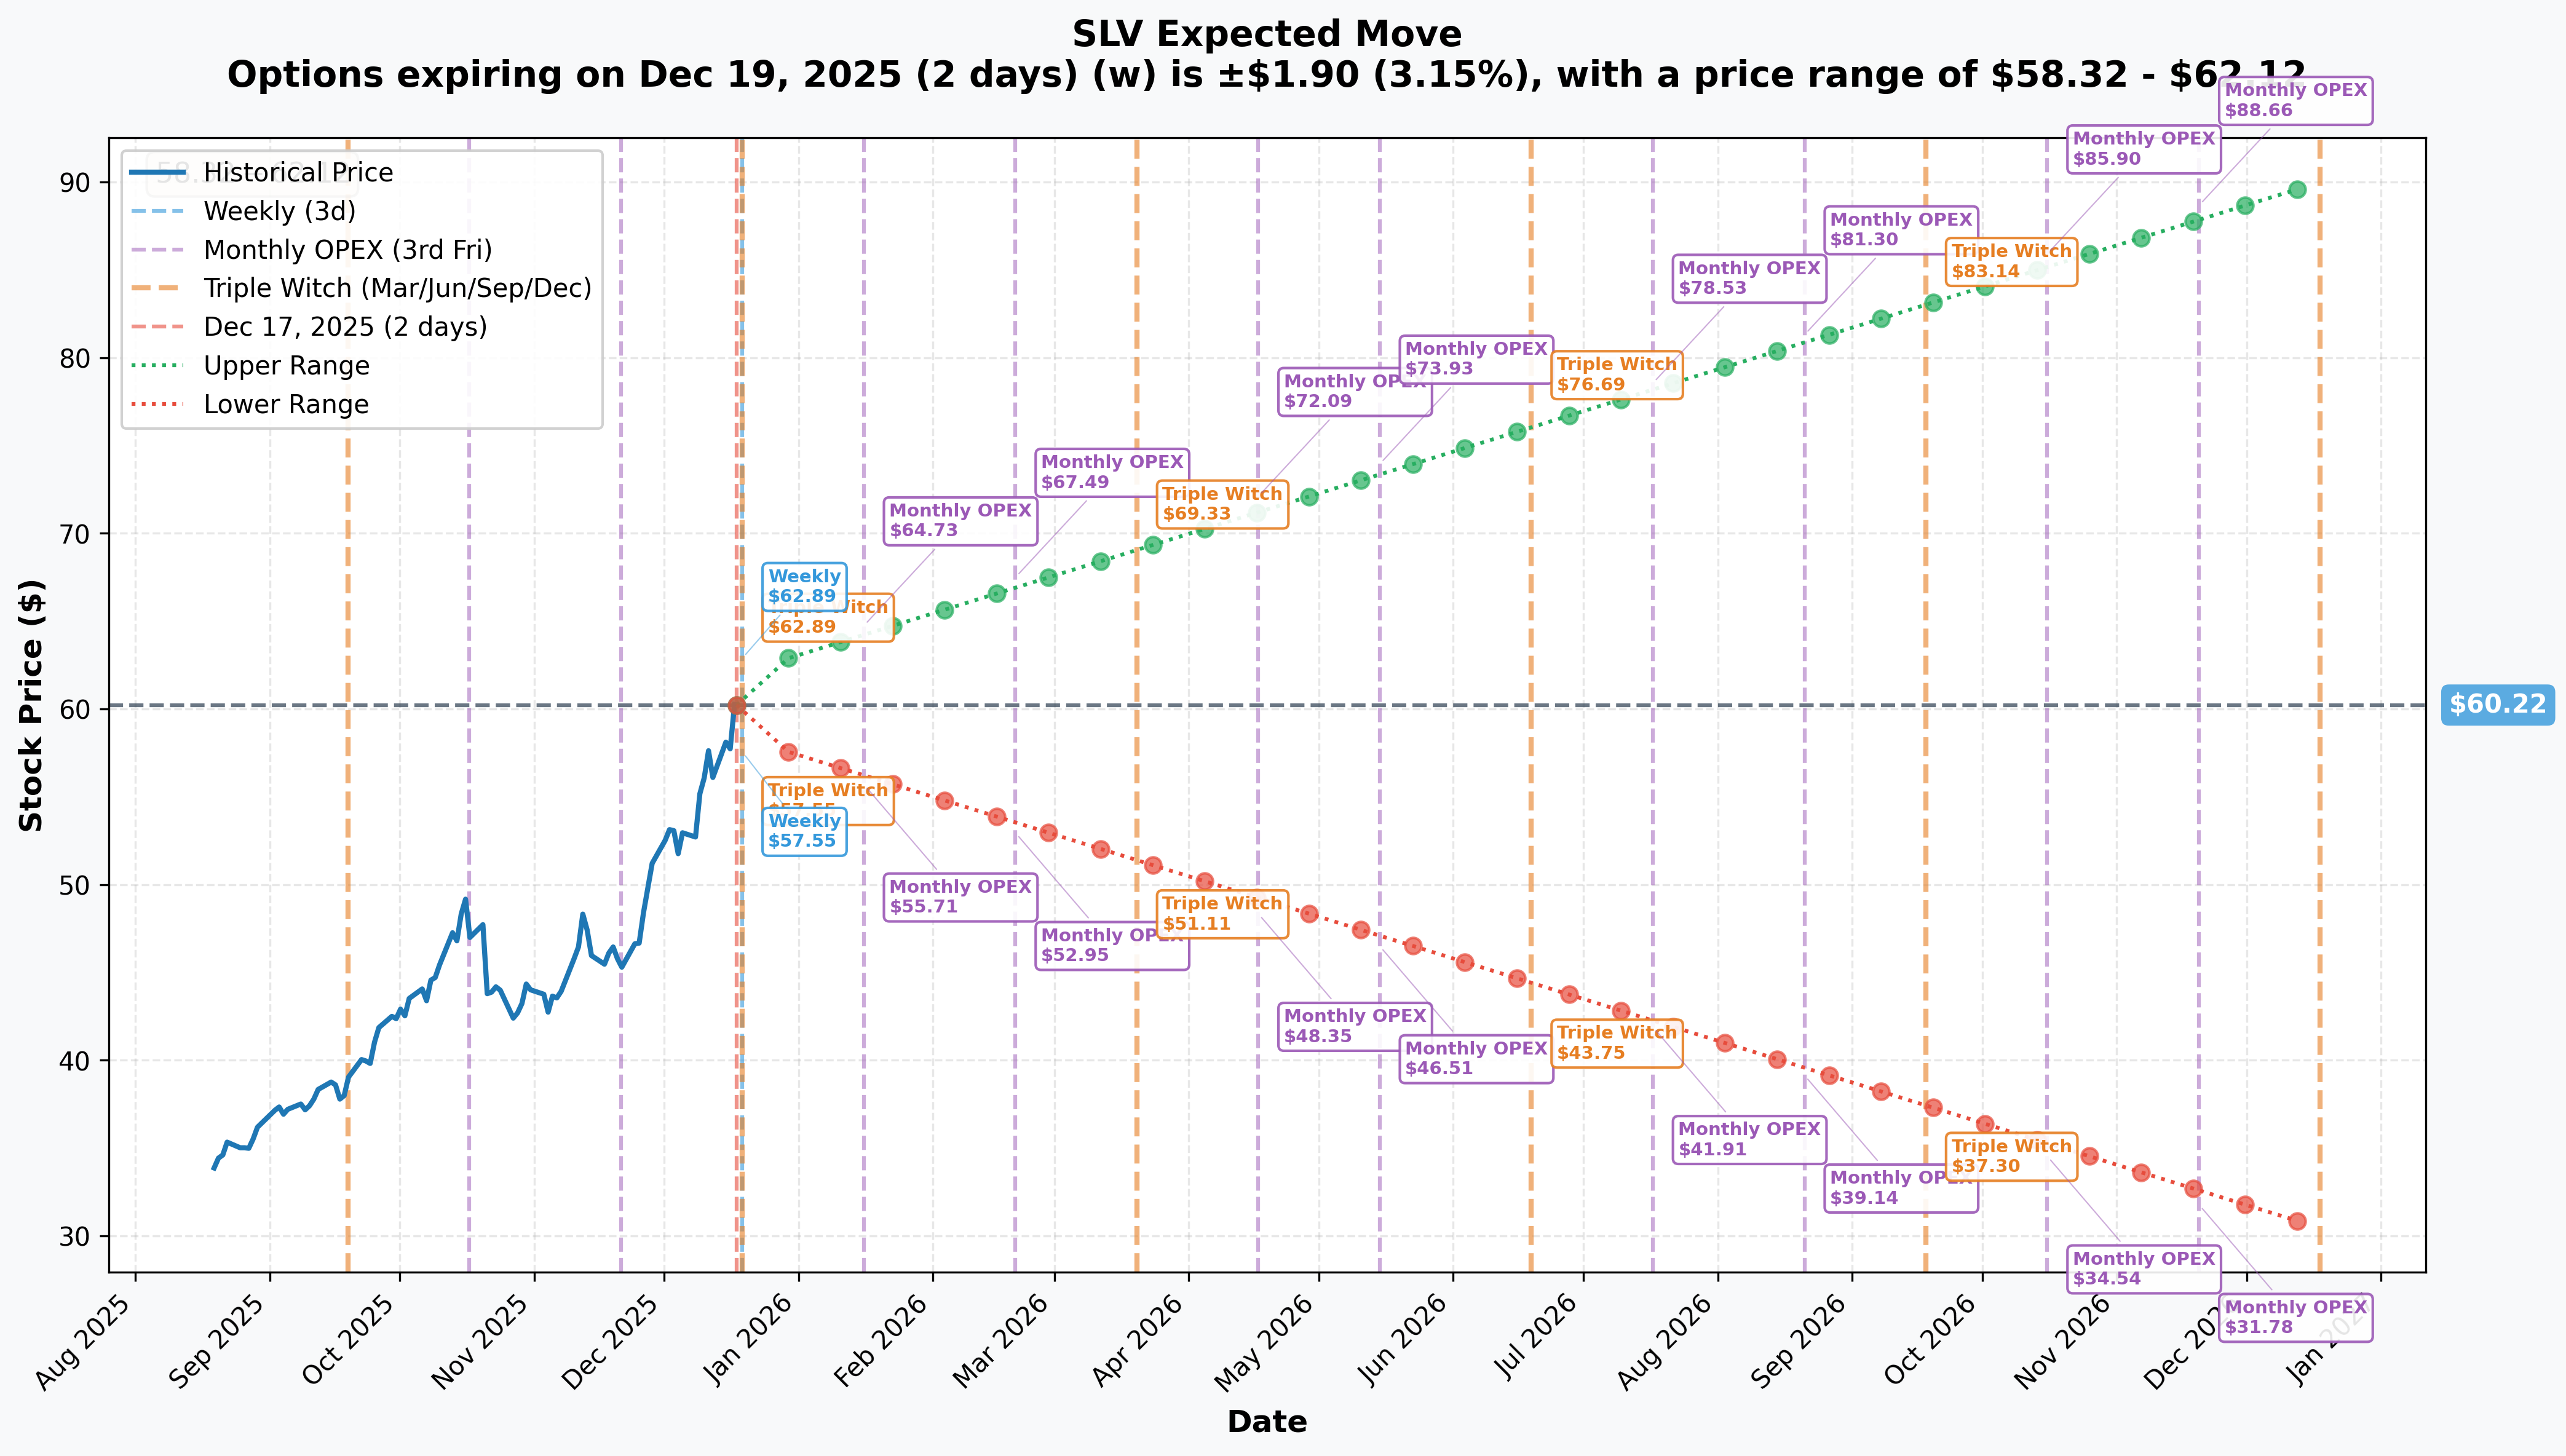
Options market pricing for upcoming expirations:
- 📅 Weekly (Dec 19 - 2 days): ±$1.90 (±3.15%) → Range: $58.32 - $62.12
- 📅 Monthly OPEX (Dec 19 - 2 days - TRIPLE WITCH!): ±$1.90 (±3.15%) → Range: $58.32 - $62.12
- 📅 Quarterly Triple Witch (Dec 19 - 2 days): ±$1.90 (±3.15%) → Range: $58.32 - $62.12
- 📅 January OPEX (Jan 16 - 30 days): ±$4.51 (±7.49%) → Range: $55.71 - $64.73
- 📅 February OPEX (Feb 20 - 65 days): ±$7.27 (±12.07%) → Range: $52.95 - $67.49
- 📅 March OPEX (Mar 20 - 93 days - THIS SPREAD'S EXPIRATION!): ±$9.11 (±15.13%) → Range: $51.11 - $69.33
- 📅 Yearly LEAPS (Dec 18, 2026 - 366 days): ±$29.82 (±49.51%) → Range: $30.40 - $90.04
Translation for regular folks: Options traders are pricing in a 3.15% move ($1.90) by Friday's triple witch expiration - relatively muted given silver's recent volatility. However, the real action is in longer-dated options. By March 20th (when this spread expires), the market expects a potential 15% move - meaning SLV could trade anywhere from $51 to $69. That's a HUGE range reflecting genuine uncertainty about whether the rally continues or mean-reverts.
The yearly LEAPS show the most interesting data: options traders think silver could be as high as $90 or as low as $30 by December 2026. The upper bound of $90 would represent a 50% gain from current levels and aligns with bullish analyst targets of $65-100 per ounce. The lower bound of $30 suggests traders are pricing in significant downside risk if demand destruction from "thrifting" technology accelerates or the supply deficit narrative breaks down.
Key insight: The March expiration implied move (±15%) captures potential volatility from Fed policy shifts, tariff announcements, solar demand updates, and China/India import dynamics. The spread trader recognized this uncertainty and chose to exit rather than risk giving back gains in a 15% swing either direction.
🎪 Catalysts
🔥 Past Catalysts (Already Happened - What Drove the 113% Rally)
Historic Silver Price Rally to $57+ (November 2025) 📈
Silver prices reached a historic peak of $57.16 per troy ounce in late November 2025, marking a 90% increase year-over-year and the highest level in decades. This surge represented silver's strongest performance relative to gold in years, with silver gaining approximately 71% in 2025 compared to gold's 54% advance. The gold-silver ratio compressed dramatically from above 100 earlier in the year to approximately 68 by December, approaching the post-1971 historical average of 66.
Record ETF Inflows - $2.6B Annually 💰
SLV and the broader silver ETF complex experienced unprecedented fund flows in 2025. The ETF recorded 5-day net flows of $337.12 million, 1-month net flows of $1.75 billion, 3-month net flows of $1.78 billion, and 1-year net flows of $2.62 billion. These massive inflows pushed total AUM from approximately $23 billion to over $27 billion. Silver-backed exchange-traded funds globally recorded inflows of approximately 95 million ounces in the first half of 2025 alone, already exceeding the entire 2024 total and bringing total global silver ETF holdings to roughly 844 million ounces—an 18% increase.
Federal Reserve Rate Cuts (Late 2024) 🏦
The Federal Reserve's monetary policy provided powerful tailwinds for silver and the broader precious metals complex. The Fed slashed interest rates twice in late 2024, bringing the benchmark rate down to 4.5%-4.75%. A lower interest rate environment raised demand for silver, as precious metals do not pay interest, making them more appealing than alternative investments like bonds when yields fall. When real yields fall—either because inflation rises or because central banks ease—owning non-yielding assets like silver becomes more attractive.
Fifth Consecutive Year of Supply Deficit (2024-2025) 🏭
The silver market recorded its fourth consecutive annual deficit in 2024, amounting to a substantial 148.9 million ounces, with 2025 on track to mark the fifth straight year of shortages. The cumulative deficit between 2021 and 2024 reached a staggering 678 million ounces, equivalent to ten months of total global mine supply. The Silver Institute projects a 2025 supply deficit of 115-120 million ounces, with some estimates ranging as high as 117.7 million ounces. Silver inventories on the London Bullion Market Association (LBMA) and COMEX fell by 50% over 2023-2024 to just 321 million ounces, the lowest levels since 2010.
Explosive Solar Photovoltaic Demand 🌞
Global silver demand reached 1.2 billion ounces in 2024, marking the second-highest level on record and driven primarily by industrial fabrication at 700 million ounces. The solar energy sector emerged as the single most significant demand catalyst. Solar PV-specific demand accounted for 17% of total silver demand in 2024, compared to just 5.6% in 2015. Silver demand for photovoltaic applications jumped over 25% in 2024, reaching an estimated 230 million ounces, with advanced "TOPCon" solar technologies requiring up to 50% more silver per panel than traditional cells. China's photovoltaic sector alone consumed over 170 million ounces of silver in 2024, a record high in industrial usage.
🚀 Upcoming Catalysts (Next 6 Months)
Continued Supply Deficits Through 2025-2027 📊
The silver market is forecast to record another significant deficit in 2025, marking the fifth consecutive year of shortages. The Silver Institute projects a structural supply gap of approximately 95 million ounces in 2025, with other estimates suggesting 117 million ounces (3,660 tonnes) shortfall. For 2026, the deficit is expected to retract to 30.5 million ounces but will continue exerting upward price pressure. The Silver Institute projects a multi-year cumulative supply deficit exceeding 140 million ounces between 2025 and 2027.
Total global silver supply is forecast to grow by 3% in 2025 to an 11-year high of 1.05 billion ounces, with mine production expected to reach a seven-year high of 844 million ounces (rising 2% from 2024). However, this supply increase will be insufficient to offset demand growth. The deficit is projected to persist and even widen through 2025-2030, putting sustained upward pressure on prices.
Accelerating Solar Demand - Exponential Growth 🌍
Global silver demand is expected to remain broadly stable at 1.20 billion ounces in 2025, but the composition shifts heavily toward industrial applications. Silver industrial fabrication is forecast to grow by 3% in 2025, with volumes on track to surpass 700 million ounces for the first time.
Global silver consumption by the PV sector is projected to reach 7,560 metric tons by 2025, doubling from 2022 levels. Its share of total global silver demand is expected to surge from 20% in 2022 to 55% by 2025, representing a fundamental restructuring of the silver market. Between 2025 and 2027, silver demand from the solar sector alone could potentially exceed 230 million ounces by 2026.
Trump Tariff Uncertainty & Safe-Haven Demand 🇺🇸
President-elect Donald Trump's proposed blanket trade tariffs on all imports to the U.S., including precious metals, represent a significant near-term catalyst for volatility. The silver market faces unique exposure to tariff policy given U.S. heavy reliance on imported silver, with Mexico being a major supplier. Mexico leads the world in silver production, creating interesting market dynamics.
Experts anticipate that Trump's tariffs would create a one-time jump in prices, causing inflation to rise temporarily as the market adjusts. However, if tariffs drive inflation, the Federal Reserve may adjust policy to prevent economic overheating, which could involve raising interest rates to cool inflationary pressures—a dynamic that would reduce precious metals' appeal. The tariff catalyst presents a double-edged dynamic: immediate supply disruptions and inflation fears could drive prices higher, while subsequent Federal Reserve tightening in response to inflation might create headwinds.
China & India Import Dynamics (Major Swing Factors) 🏭
China's Industrial Appetite: China is the world's largest industrial consumer of silver, accounting for nearly 25% of global demand. In 2025, China's ongoing economic recovery and policy incentives for renewable energy have further boosted silver imports. The government's strong support for solar cell and EV battery production has tightened global silver supply chains. China's photovoltaic sector alone consumed over 170 million ounces of silver in 2024, and this is expected to grow in 2025-2026 as solar capacity expansion continues.
India's Investment Demand: The first eight months of 2025 saw India import 2,580 metric tons of silver, down from 5,695 tons in the same period of 2024, but industry projections suggest full-year 2025 imports will reach 5,500-6,000 metric tons. Silver has outperformed gold in India during 2025 with a 49% price increase compared to gold's 44%, driving silver ETF inflows that have tripled compared to historical averages. Silver imports to India rose to $1.48 billion in H1 2025, expanding at an extraordinary 162% CAGR since 2017.
⚠️ Risk Catalysts (Negative)
"Thrifting" Technology - Demand Destruction Risk 🔬
Despite record global solar installations, a critical counter-catalyst has emerged: aggressive "thrifting" by solar panel manufacturers as technological advances help reduce the amount of silver needed per panel. PV-specific demand remained relatively flat in 2024 despite installation growth due to this efficiency improvement trend.
Philip Newman of Metals Focus warned that the reported deficits won't last forever and that higher prices could face resistance through thrifting and demand substitution. "We don't see these deficits as the new normal," Newman stated. "At $30 an ounce, margins will be pressured so solar panel manufacturers in China or India will begin looking for substitute components, creating demand destruction."
Federal Reserve Policy Reversal Risk 📈
While current Fed policy with rates at 4.5%-4.75% supports precious metals, any hawkish pivot in response to persistent inflation (potentially tariff-induced) could create significant headwinds. If the Federal Reserve raises interest rates to combat inflation, rising real yields would reduce precious metals' relative attractiveness versus fixed income alternatives. The December 17 market action with silver falling to $30.30 ahead of the Fed's interest rate decision illustrated this sensitivity.
🎲 Price Targets & Probabilities
Using gamma levels, implied move data, and upcoming catalysts, here are the scenarios through March 20th expiration (when this spread expires):
📈 Bull Case (30% probability)
Target: $70-$75
How we get there:
- 🚀 Silver prices rally to analyst targets of $65-75 per ounce driven by supply deficit intensification
- 📊 2025 deficit comes in at upper end of estimates (117M+ ounces), with inventories falling further
- 🌞 Solar panel demand exceeds projections, reaching 300M+ ounces in 2025 despite thrifting efforts
- 🇨🇳 China accelerates solar capacity expansion 50%+ year-over-year, consuming 200M+ ounces
- 🇮🇳 India silver imports surge to 6,500+ metric tons as investment demand explodes
- 💰 Fed maintains dovish stance or cuts rates further, keeping real yields negative
- 🌐 Trump tariffs on Mexico silver create supply squeeze and inflation hedge demand
- 📈 Break above $65 gamma resistance triggers technical rally to $70 as next target
- 🏭 Mine production disappoints, coming in flat to down vs. expectations
Key metrics needed:
- Sustained supply deficit >100M ounces
- Solar demand growth >20% YoY
- Gold-silver ratio compression to 60-65 range
- Continued ETF inflows $500M+ monthly
Probability assessment: Only 30% because it requires CONTINUED perfect execution of the structural bull thesis after a 113% YTD rally. Silver at $60 already prices in much of the deficit narrative. Would need several positive surprises to justify another 15-25% rally from here.
🎯 Base Case (50% probability)
Target: $52-$62 range (CONSOLIDATION)
Most likely scenario:
- ⚖️ Silver consolidates gains between $52-62 through Q1 2026
- 📊 Supply deficit materializes as expected (~95-117M ounces) but doesn't widen dramatically
- 🌞 Solar demand grows steadily but thrifting technology partially offsets installation growth
- 🇨🇳 China and India demand solid but not spectacular - normal seasonal patterns
- 🏦 Fed holds rates steady at 4.5%-4.75%, neither cutting aggressively nor hiking
- 💤 Volatility compression after the historic rally - market digests gains
- 🔄 Trading between gamma support ($55-58) and resistance ($65) for 8-12 weeks
- 🎯 Market waits for 2026 solar installation data and mine production reports
- 📈 Gold continues grinding higher, keeping silver supported via ratio dynamics
- ⚠️ Trump tariff uncertainty creates occasional spikes but no sustained breakout
This is the spread trader's target scenario: Silver consolidates in a healthy range, proving the rally was justified but not extending dramatically. They locked in profits from the $40-60 run and aren't interested in riding choppy sideways action for 3 months. The $17.5M they collected represents MASSIVE gains on the original spread position.
Why 50% probability: After a 113% rally, consolidation is the natural next step. Fundamentals remain strong (deficits, solar demand, low inventories) but valuations rich. Most rational outcome is a digestion period where silver proves it can hold $50-60 levels before attempting $70+. The implied move (±15% by March) supports this wide-range consolidation thesis.
📉 Bear Case (20% probability)
Target: $45-$52 (HEALTHY CORRECTION)
What could go wrong:
- 😰 Thrifting technology accelerates dramatically, reducing silver content per solar panel 30-40%
- 📉 "At $30 an ounce margins pressured" warning proves prophetic - manufacturers aggressively substitute
- 🏦 Fed pivots hawkish, raising rates in response to tariff-driven inflation
- 📈 Real yields spike to 2-3%, making bonds attractive vs. non-yielding silver
- 🇨🇳 China economic slowdown reduces solar installation targets 20%+
- 🏭 Mine production surprises to upside, growing 5%+ vs. expectations and narrowing deficit
- 💸 Profit-taking cascade after 113% YTD gain - "sell in strength" mentality
- 🔨 Break below $55 gamma support triggers technical selling to $50, then $45
- 📊 Gold corrects 10-15%, dragging silver down via ratio dynamics
- 🌐 Trump tariff uncertainty resolved with minimal impact - "buy the rumor, sell the fact"
Critical support levels:
- 🛡️ $55: Major gamma floor (47.3B) - MUST HOLD or momentum shifts bearish
- 🛡️ $50: Psychological level + deep support (55.0B gamma) - likely heavy buying
- 🛡️ $45: Extended floor - would represent 25% correction from peak (healthy in context of 113% rally)
Probability assessment: Only 20% because it requires the structural bull thesis to BREAK, not just pause. The supply deficit is real, solar demand is real, inventories are genuinely depleted. A correction to $45-50 would likely trigger massive buying from long-term investors recognizing value. However, the spread trader clearly thought this scenario had >20% odds given their decision to exit completely rather than trim.
Why they exited: At $60 after a 113% rally, risk/reward no longer favorable. A 15% pullback to $51 would give back $9/share of gains, while upside to $70 only offers $10/share. With uncertainties around thrifting, Fed policy, and tariffs, the smart play is taking profits NOW and waiting for better re-entry points if the bull thesis remains intact.
💡 Trading Ideas
🛡️ Conservative: Cash-Secured Put Selling at Major Support
Play: Sell cash-secured puts at the $55 strike, collecting premium while positioning for potential pullback entry
Structure: Sell March 20 $55 puts (same expiration as the spread that just closed)
Why this works:
- 🎯 $55 strike sits at MAJOR gamma support (47.3B) - the critical technical floor
- 💰 Collect premium ($1.50-2.00/contract estimated) for taking on obligation to buy at $55
- 📊 If assigned, you're buying SLV 8.8% below current price after a 113% rally - decent value entry
- 🛡️ Defined risk: Maximum obligation is $5,500 per contract (less premium collected)
- ⏰ March 20 expiration (93 days) gives time for volatility to settle and thesis to play out
- ✅ Win-win: Either keep premium if SLV stays above $55, or acquire SLV position at discount with cash
Entry criteria:
- ⏰ Wait for any short-term pullback to $57-59 range to sell puts (better premium)
- 🎯 Only sell if you're COMFORTABLE owning SLV at $55 (don't sell puts you don't want assigned!)
- 📊 Ensure you have cash to cover assignment ($5,500 per contract)
Expected outcome:
- 💚 Best case: SLV stays above $55, keep $150-200 premium per contract (3-4% return on capital in 3 months)
- 📈 Neutral case: Assigned at $55, own SLV with $53.00-53.50 effective cost basis (premium reduces basis)
- 😰 Worst case: Assigned and SLV continues falling to $45-50 (unrealized loss, but fundamentals suggest $55 should hold)
Position sizing: Sell 1 put for every $5,500 in cash you're willing to allocate to SLV. Start with 1-2 contracts maximum (avoid over-concentration).
Risk level: Low-Moderate (obligation to buy at $55) | Skill level: Intermediate
Probability of profit: 70% (SLV holding above $55 support through March seems likely given structural bull thesis)
⚖️ Balanced: Vertical Put Spread (Copy The Pros' Exit Strategy)
Play: Buy put spread positioning for healthy 10-15% correction from current levels
Structure: Buy $60 puts, Sell $55 puts (March 20 expiration - SAME as the $17.5M spread)
Why this works:
- 🎢 Defined risk spread ($5 wide = $500 max risk per spread)
- 🎯 Targets the $55-60 consolidation range suggested by gamma support levels
- 🤝 Positions for "profit-taking correction" scenario after 113% rally - not a structural bear bet
- ⏰ 93 days to expiration allows time for near-term pullback to materialize
- 📊 Protects against 8-15% correction without requiring catastrophic silver collapse
- 💡 Mimics institutional thinking: They closed at $60-65, suggesting that's the range they think is toppy
Estimated P&L:
- 💰 Pay ~$2.00-2.50 net debit per spread (adjust based on current IV)
- 📈 Max profit: $2.50-3.00 if SLV below $55 at March expiration (50-60% ROI)
- 📉 Max loss: $2.00-2.50 if SLV above $60 (defined and limited)
- 🎯 Breakeven: ~$57.50-58.00
- 📊 Risk/Reward: ~1:1 to 1:1.2 which is acceptable for defined-risk bearish positioning
Entry timing:
- ⏰ Enter NOW or on any further strength above $60 (spread gets cheaper as SLV rises)
- 🎯 Skip if SLV already below $57 (spread too close to at-the-money, poor risk/reward)
- 📊 Ideal entry: SLV at $59-62 range
Position sizing: Risk only 3-5% of portfolio (this is directional speculation based on profit-taking thesis)
Management:
- ✅ Take profits at 40-50% of max gain (don't be greedy - if spread moves to $1.00+ profit, consider closing)
- ⏰ If SLV rallies to $65+, consider closing for small loss and re-evaluating (thesis invalidated)
- 📊 Hold through expiration if SLV trading $56-59 range (capture full value)
Risk level: Moderate (defined risk, bearish directional) | Skill level: Intermediate
Probability of profit: 40-45% (requires SLV to pull back below $58 - possible but not guaranteed)
🚀 Aggressive: Long Straddle Betting on Tariff Volatility (ADVANCED!)
Play: Buy straddle betting on MASSIVE volatility from Trump tariff announcements and Fed policy shifts
Structure: Buy $60 calls + Buy $60 puts (March 20 expiration)
Why this could work:
- 💥 Implied move only 15% but silver could EXPLODE either direction on tariffs/Fed
- 🎰 Trump tariff announcement could spike silver 20%+ (supply disruption + inflation hedge)
- 📉 OR Fed hawkish pivot could crash silver 15-20% (rising real yields)
- ⚡ Multiple binary events in next 90 days: Fed meetings, Trump inauguration policies, Q1 solar data
- 🌐 Mexico tariff on silver could create one-time price spike similar to copper reactions
- 📊 At-the-money straddle captures movement in EITHER direction
Why this could blow up (SERIOUS RISKS):
- 💸 EXPENSIVE: Straddle costs ~$7-9 ($700-900 per straddle)
- ⏰ TIME DECAY KILLER: Theta burns -$30-50/day eating your premium
- 😱 VOLATILITY CRUSH RISK: If SLV just consolidates $55-65 you lose entire premium
- 📊 Need HUGE move: Requires 12-15% move either way to breakeven
- 🎢 Silver could trade $57-63 range (within implied move) and you lose 60-80%
- ⚠️ Even if you're RIGHT on direction, timing matters - slow grind vs. explosive gap
Estimated P&L:
- 💰 Cost: ~$7.00-9.00 per straddle (premium varies with IV)
- 📈 Profit scenario: SLV moves to $70 or $50 (15-17% move) = $3-5 gain (40-60% ROI)
- 🚀 Home run: SLV moves to $75 or $45 (20-25% move) = $10-15 gain (130-200% ROI!)
- 📉 Loss scenario: SLV ends $55-65 range = lose $4-7 (50-90% loss)
- 💀 Total loss: SLV flat at $60 = lose entire $7-9 (100% loss)
Breakeven points:
- 📈 Upside breakeven: ~$67-69 (need 12-15% rally)
- 📉 Downside breakeven: ~$51-53 (need 12-15% drop)
CRITICAL WARNING - DO NOT attempt unless you:
- ✅ Fully understand you're betting AGAINST the options market's probability assessment
- ✅ Can afford to lose ENTIRE premium (very real possibility!)
- ✅ Have traded straddles before and understand volatility dynamics
- ✅ Can actively monitor news for tariff/Fed announcements and take profits FAST
- ✅ Accept that consolidation (most likely scenario) means 100% loss
- ⏰ Plan to close position if up 30-50% rather than holding for max gain
- 📊 Set stop-loss at -50% to prevent total wipeout if thesis clearly wrong
Alternative structure for less pain: Instead of at-the-money $60 straddle, consider $65 call + $55 put (strangle) for ~$4-5 cost. Gives you wider breakevens but costs less premium upfront.
Risk level: EXTREME (can lose 100% of premium) | Skill level: Advanced only
Probability of profit: ~35% (lower than implied 50% because requires EXPLOSIVE move, not gradual drift)
⚠️ Risk Factors
Don't get caught by these potential landmines:
-
🔬 Thrifting technology threatens demand thesis: Despite record solar installations, "thrifting" by solar panel manufacturers as technological advances reduce silver content per panel represents the BIGGEST medium-term risk. PV-specific demand remained flat in 2024 despite installation growth due to efficiency improvements. Philip Newman of Metals Focus warned: "At $30 an ounce, margins will be pressured so solar panel manufacturers will begin looking for substitute components, creating demand destruction." At current $60 prices, substitution economics become VERY attractive. If successful, this undermines the entire structural deficit narrative.
-
🏦 Fed policy reversal could crush precious metals: While current Fed policy with rates at 4.5%-4.75% supports silver, any hawkish pivot would create headwinds. If the Fed raises rates to combat tariff-driven inflation, rising real yields would reduce precious metals' attractiveness vs. bonds. December 17 action with silver falling ahead of Fed decision shows this sensitivity. A return to 5-6% Fed funds rate would likely trigger 20-30% silver correction.
-
💸 After 113% YTD rally, profit-taking risk is EXTREME: SLV trades near all-time highs at $60 after starting the year at $28. This is unprecedented appreciation for an ETF holding physical commodities. Bank of America's $65 target implies only 8% upside, while more aggressive $100 targets suggest 67% gains. Wide range reflects genuine uncertainty. The $17.5M institutional spread closure is a CLEAR signal: smart money prefers locking in triple-digit gains over risking giveback. Retail FOMO buyers entering here are buying what institutions are selling.
-
🌐 Trump tariff uncertainty cuts BOTH ways: Proposed tariffs on Mexican silver imports could create supply disruption and price spike initially, but subsequent Fed tightening to combat tariff-induced inflation could more than offset gains. Net effect highly uncertain and could trigger violent whipsaws. Additionally, U.S. heavy reliance on imported silver makes it vulnerable to trade disruptions - tariffs could backfire spectacularly.
-
🏭 Mine supply could surprise to upside: While current forecasts project mine production growing modestly to 844M ounces in 2025, higher sustained prices incentivize accelerated development. Silver at $60/oz makes previously uneconomic deposits profitable. By 2029, production from top five producers forecast to fall, but this assumes current pipelines and doesn't account for new discoveries. The market has historically demonstrated supply elasticity at elevated prices, though with 3-5 year lag times.
-
🇨🇳 China demand uncertainty - both directions: China accounts for 25% of global silver demand but economic headwinds could reduce industrial consumption. However, policy incentives for solar and EVs have boosted silver imports in 2025. This dual dynamic (weak economy vs. green energy mandates) creates unpredictability. Any material slowdown in China's solar expansion (which consumed 170M+ ounces in 2024) would remove primary demand pillar.
-
📊 Technical: $65 gamma resistance is MASSIVE: The 51.1B call gamma at $65 (where this spread was struck) creates mechanical selling pressure by market makers. Breaking through requires sustained institutional buying to overcome dealer hedging. Current positioning suggests $65 is a HARD ceiling in near term. Previous failed breakout attempts could leave overhead supply.
-
💰 Tax treatment disadvantage vs. equities: As a grantor trust holding physical silver, SLV is taxed as collectible with 28% max long-term capital gains rate vs. 20% for stocks. After 113% YTD gain, many investors now sitting on HUGE embedded tax liabilities. Selling to harvest gains before year-end could create December selling pressure. This tax inefficiency vs. equities matters more at elevated prices.
-
🎢 Extreme volatility creates whipsaw risk: The implied move data shows ±15% potential swing by March (range: $51-69). Silver is NOT a buy-and-hold stable asset - it can move 5-10% in days on NO NEWS. The YTD chart shows clean uptrend, but history shows silver can correct 30-40% FAST when sentiment shifts. Gold-silver ratio compression to 68 could reverse violently if industrial demand disappoints.
-
📉 Valuation: No fundamental anchor for commodities: Unlike stocks with earnings/cash flow, commodities trade purely on supply/demand expectations. Silver at $60 is "expensive" only in historical context - there's no P/E ratio to anchor valuation. If the deficit narrative breaks down or thrifting accelerates, price could reset to $40-45 quickly with no "fair value" support level. The wide range in analyst targets ($65-100) reflects this uncertainty.
🎯 The Bottom Line
Real talk: Someone just closed a $17.5 MILLION options spread on SLV after riding silver's historic 113% rally from the $40s to $60. This wasn't a panic exit or bearish bet - this was SMART profit-taking by sophisticated traders who recognize that risk/reward at current levels no longer favors aggressive long positioning.
What this trade tells us:
- 🎯 Institutions are EXITING at $60-65 levels (the spread was struck at exactly $65 - major gamma resistance)
- 💰 They made their money on the epic solar-demand-driven rally and don't need to see $70-80 to call it a win
- ⚖️ The timing (right at yearly highs after 113% YTD gain) shows discipline: take profits in strength, don't wait for reversal
- 📊 Net $6.5M cash collected by closing BOTH sides suggests they believe near-term upside limited vs. downside risk
- ⏰ March 20 expiration would have captured Q1 solar data, Fed meetings, and Trump tariff clarity - they chose NOT to hold for those catalysts
This is NOT a "sell everything and run" signal - it's a "respect the rally but manage risk" signal.
The structural silver bull thesis remains INTACT:
- ✅ Fifth consecutive year of supply deficits (95-117M ounces in 2025)
- ✅ Depleted inventories down 50% to decade lows (321M ounces)
- ✅ Solar demand exploding (230M+ ounces in 2024, growing to 300M+ by 2026)
- ✅ Record ETF inflows ($2.62B annually)
- ✅ Fed maintaining dovish stance with rates at 4.5-4.75%
BUT, valuations are rich and near-term risks are elevated:
- ⚠️ Thrifting technology threatens demand growth
- ⚠️ Fed could pivot hawkish on tariff-driven inflation
- ⚠️ After 113% rally, profit-taking waves are INEVITABLE
- ⚠️ $65 gamma resistance creates mechanical ceiling
If you own SLV:
- ✅ STRONGLY consider trimming 30-50% at $59-62 levels (lock in spectacular gains, reduce risk exposure)
- 📊 Set mental stop at $55 (major gamma support) to protect remaining position
- ⏰ Don't get greedy - you've already WON! Up 113% YTD is life-changing. Protecting profits is smart.
- 🎯 If silver pulls back to $50-52, consider re-entering with trimmed portion (better risk/reward)
- 🛡️ For large positions, consider buying protective $55 puts (costs 3-4% but caps downside)
If you're watching from sidelines:
- ⏰ DO NOT chase at $60+ levels - you're buying what institutions are selling
- 🎯 Wait patiently for pullback to $52-55 range (10-15% correction from peak)
- 📈 That pullback would offer entry with gamma support underneath and room to run if bull thesis intact
- ✅ Confirmation signals to watch: Solar installation data for Q1 2026, China import numbers, Fed policy trajectory
- 🚀 Longer-term (6-12 months), structural deficits through 2027 support $65-75 targets if demand story delivers
If you're bearish:
- 🎯 Wait for any rally above $62 to position for correction (better entry for put spreads)
- 📊 First support at $60 (143.6B gamma), major support at $55 (47.3B gamma wall)
- ⚠️ Put spreads ($60/$55) offer defined-risk way to play 10-15% correction without catastrophic loss risk
- 📉 Watch for break below $55 - that's the trigger for potential cascade to $50, then $45
- ⏰ Don't fight the structural bull thesis - position for CORRECTION not collapse
Mark your calendar - Key dates:
- 📅 December 19 (Friday) - Triple Witch OPEX (2 days away! Potential volatility)
- 📅 January 2026 - Trump inauguration and initial tariff policy announcements
- 📅 January 16 - Monthly OPEX (30 days - watch for positioning changes)
- 📅 February 2026 - Fed meeting (policy direction critical for precious metals)
- 📅 March 20 - Monthly OPEX, expiration window where this $17.5M spread would have expired
- 📅 Q1 2026 - China & India silver import data, solar installation updates
- 📅 Mid-2025 - 2025 supply deficit final tallies and 2026 projections
Final verdict: Silver's long-term bull thesis remains compelling - structural deficits, solar demand explosion, depleted inventories, and dovish Fed policy are all real. Analyst targets of $65-100 per ounce by 2026 are achievable IF execution continues. BUT, at $60 after 113% YTD rally, the risk/reward is NO LONGER favorable for aggressive new positioning. The $17.5M institutional spread closure is a CLEAR signal: smart money is taking profits at the peak.
Be patient. Let silver consolidate $52-58. Look for better entry points after healthy correction. The silver supply deficit will still be here in 3-6 months, and you'll sleep better at night paying $53 instead of $61.
This is a marathon, not a sprint. Protect your capital and don't chase. 💪
Disclaimer: Options trading involves substantial risk of loss and is not suitable for all investors. This analysis is for educational purposes only and not financial advice. Past performance doesn't guarantee future results. The unusual score reflects this specific trade's size relative to recent SLV history - it does not imply the trade will be profitable or that you should follow it. Always do your own research and consider consulting a licensed financial advisor before trading. Commodities can be extremely volatile with 10-20% swings in short periods. SLV is taxed as a collectible with higher tax rates than equities. The trader closing this spread may have complex portfolio needs not applicable to retail traders.
About iShares Silver Trust (SLV): The iShares Silver Trust seeks to reflect generally the performance of the price of silver before payment of the Trust's expenses and liabilities. The Trust holds physical silver bullion (99.9% pure) with JPMorgan Chase Bank as custodian, providing direct exposure to silver prices without the complexities of futures contracts. With $27.05 billion in assets under management, SLV is the world's largest silver-backed ETF and a primary vehicle for institutional and retail investors seeking precious metals exposure.