SLV Options Alert: $7.6M Call Position Closed - Profit-Taking After Silver's Historic Rally
January 13, 2026 | Unusual Activity Detected | Strategy: Close Long Call (BTC)
The Quick Take
Institutional money just cashed out $7.6 million in deep in-the-money call options on the iShares Silver Trust (SLV) after silver's explosive 187% rally over the past year. This "Buy to Close" (BTC) order on 6,500 contracts at the $70 strike represents profit-taking from a position that's now sitting on massive gains. With silver spot prices at all-time highs near $85/oz and the ETF trading around $80, smart money is locking in profits amid elevated volatility following last week's flash crash.
Translation for us regular folks: Someone who bet big on silver months ago is now ringing the cash register. After silver more than doubled in a year, they're not waiting around to see if it can keep climbing. Time to take chips off the table.
Company Overview
| Metric | Value |
|---|---|
| ETF Name | iShares Silver Trust |
| Ticker | SLV |
| Primary Exchange | NYSE Arca |
| Asset Type | Exchange-Traded Vehicle (Commodity Trust) |
| Current Price | $79.29-$80.04 |
| Silver Spot Price | $85.64/oz |
| 52-Week Range | $26.57 - $78.18 |
| YTD Return | +8.53% |
| 1-Year Return | +187% |
| Market Cap | $44.67B |
| Holdings | 90.65 million oz silver |
| Expense Ratio | 0.50% |
What is SLV? The iShares Silver Trust is designed to track the price of silver bullion. Each share represents ownership of physical silver stored in bank vaults. It's the most popular way for investors to get silver exposure without dealing with bars or coins.
Options Tape Breakdown
Whale Alert: Major Profit-Taking!
Trade Metrics Dashboard
| Metric | Value | What It Means |
|---|---|---|
| Total Premium | $7.6M | Institutional-size position closure |
| Contracts | 6,500 | Notional exposure ~$52M in silver |
| Order Type | BTC (Buy to Close) | Closing existing long call position |
| Strategy | Close Long Call | Profit-taking on winning trade |
| Z-Score | 0.43 | Typical activity level |
| Vol/OI Ratio | 1.625x | High turnover on this strike |
The Actual Trade Tape
| Date | Time | Side | Type | Strike | Expiry | Volume | OI | Size | Premium | Spot | Option Symbol |
|---|---|---|---|---|---|---|---|---|---|---|---|
| 2026-01-13 | 11:30:30 | BUY | CALL | $70 | 2026-04-17 | 6,500 | 4,000 | 5,000 | $7.6M | $80.04 | SLV20260417C70 |
What This Actually Means (Strategy Detection: Close Long Call)
What is a "Buy to Close" (BTC)?
When you see a "BUY" order on a call option classified as "Close Long Call," it means:
- Original Trade: Someone previously SOLD to open these calls (either covered calls or naked)
- Today's Trade: They're buying back those calls to close the position
- Why Now: They want to lock in gains or cut losses before expiration
But wait - there's a twist! These are deep in-the-money calls ($70 strike with stock at $80). At $15.25 per contract (option price), the buyer paid roughly $99M in total notional to close 6,500 contracts. This is most likely:
- Scenario A: A covered call writer buying back their short calls before assignment (they want to keep their silver shares)
- Scenario B: Someone closing out a profitable long call position by selling to market makers (and this "BUY" is the dealer's offsetting hedge)
Either way, it signals profit-taking after silver's massive run. The $7.6M premium represents the intrinsic value ($10 ITM) plus time value for the April expiration.
Translation: After silver doubled, big players are cashing out. This isn't bearish - it's rational profit management after an incredible rally.
Technical Setup / Chart Check-Up
YTD Chart
SLV has been on a historic tear, with the ETF tracking silver's surge from around $30/oz in early 2025 to current all-time highs above $85/oz. The January 12 session saw a 6.71% single-day gain, though volatility remains elevated after the January 8 flash crash where silver futures plunged 18% intraday before recovering.
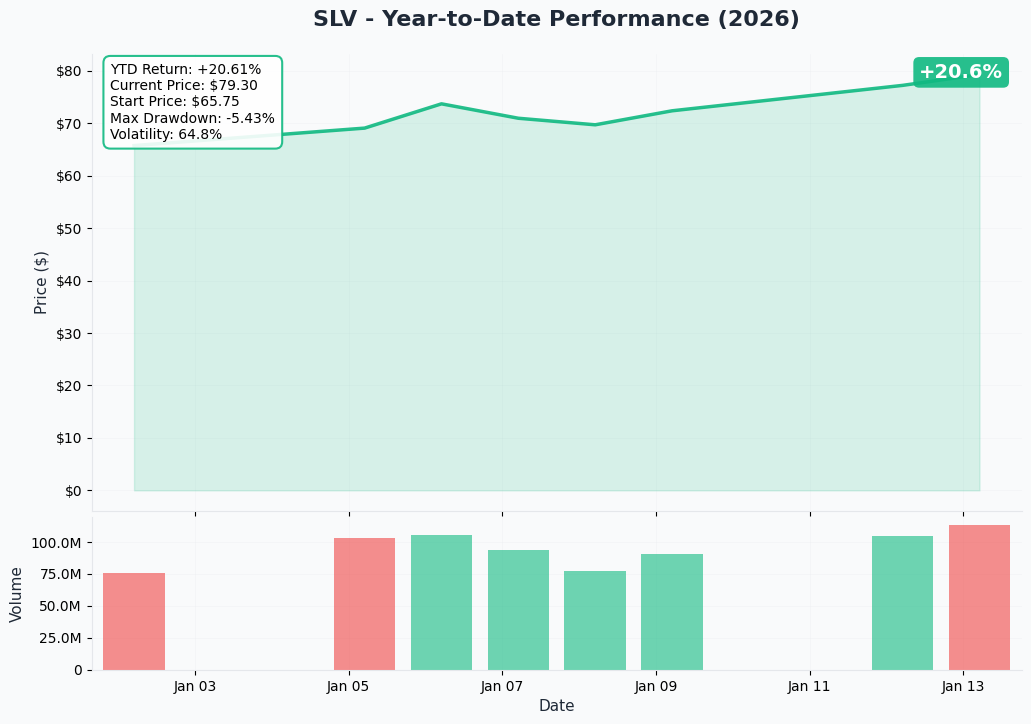
Key Observations:
- SLV trading near all-time highs around $77-$80
- Sharp recovery from January 8 flash crash
- Overbought conditions across multiple timeframes
- Momentum remains bullish but stretched
Gamma-Based Support and Resistance Analysis
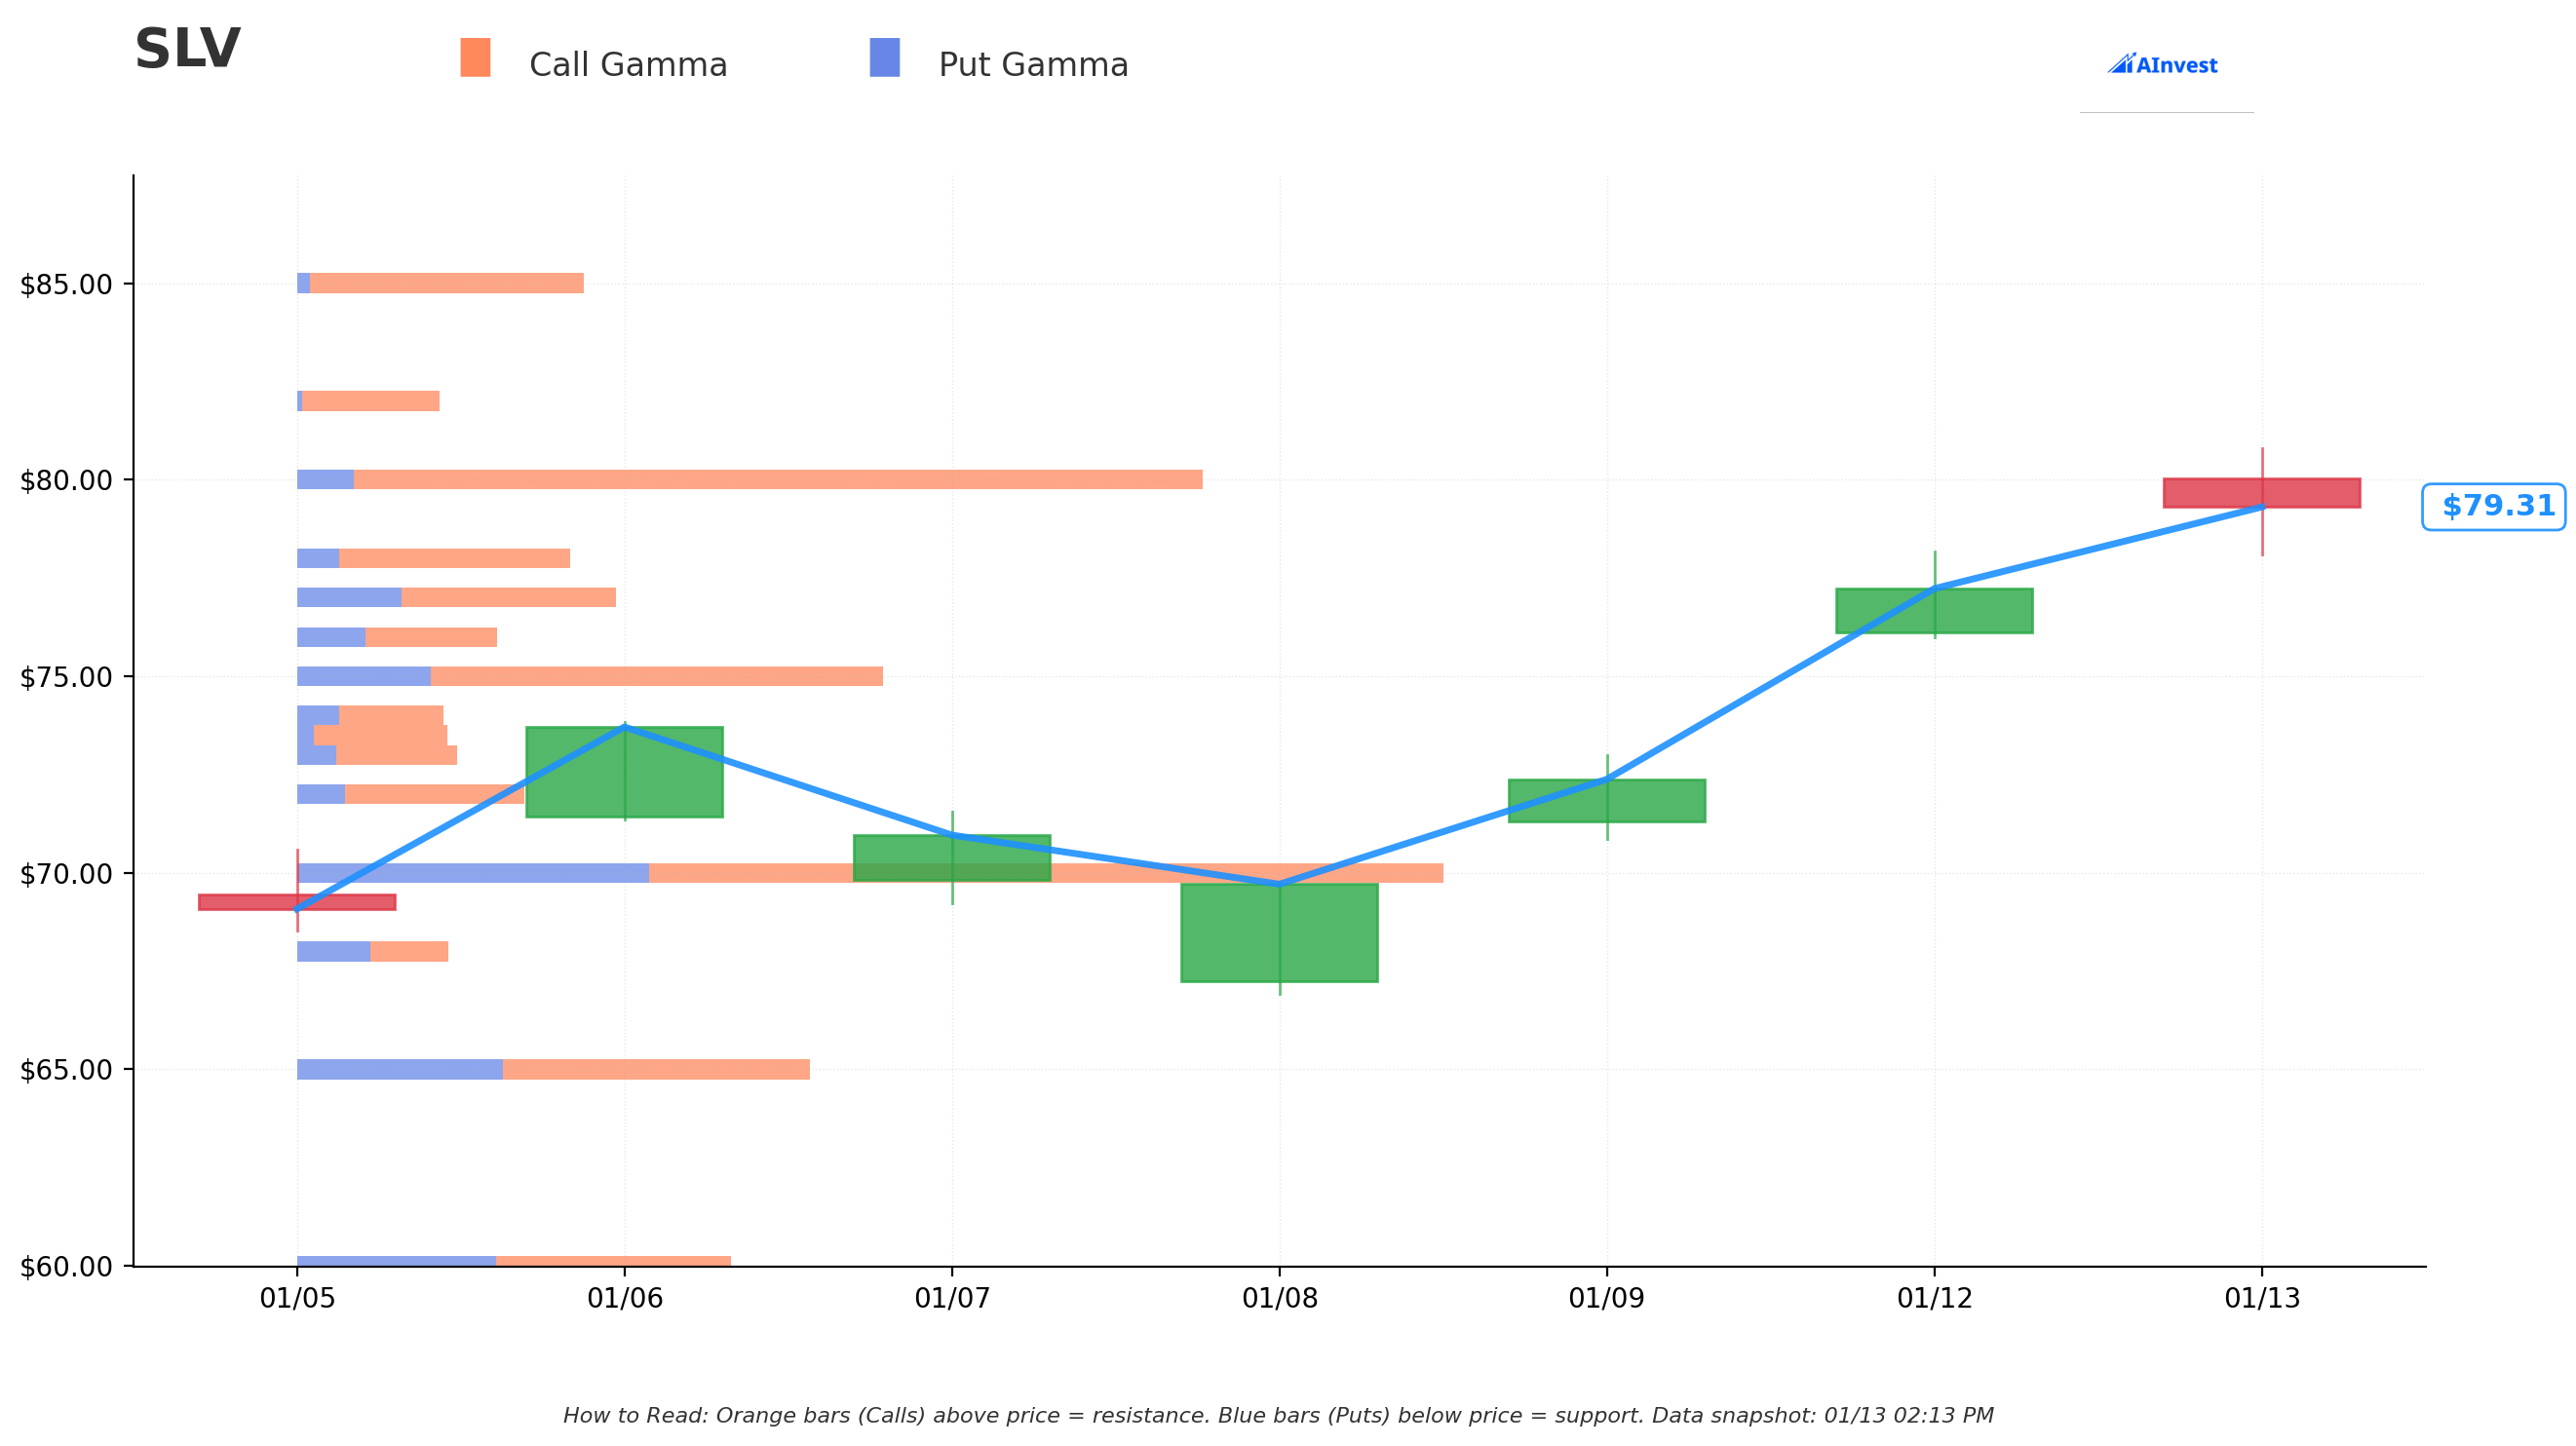
Understanding Gamma Levels:
- Blue bars (Put Gamma) = Support levels where market makers hedge by buying
- Orange bars (Call Gamma) = Resistance levels where market makers hedge by selling
- Bigger bars = Stronger levels where price tends to "stick"
Current Gamma Profile (Net GEX Bias: Bullish)
| Level | Strike | Net GEX | Distance | Significance |
|---|---|---|---|---|
| Strongest Resistance | $80 | 48.6 | +0.9% | Immediate overhead barrier |
| Secondary Resistance | $85 | 16.1 | +7.2% | Next major ceiling |
| Tertiary Resistance | $90 | 14.4 | +13.5% | Aspirational target |
| Strongest Support | $78 | 11.6 | -1.6% | Immediate floor |
| Secondary Support | $75 | 19.5 | -5.4% | Key gamma wall |
| Major Support | $70 | 26.6 | -11.7% | Massive gamma anchor |
What This Means:
- $80 is the battleground: Massive call gamma creates resistance just above current price
- $78 provides a floor: Put gamma creates buying pressure if price dips
- $70 is fortress-level support: The strike where today's trade occurred has enormous gamma
- Net bullish bias: Total call GEX ($443) far exceeds put GEX ($171)
Implied Move-Based Support and Resistance
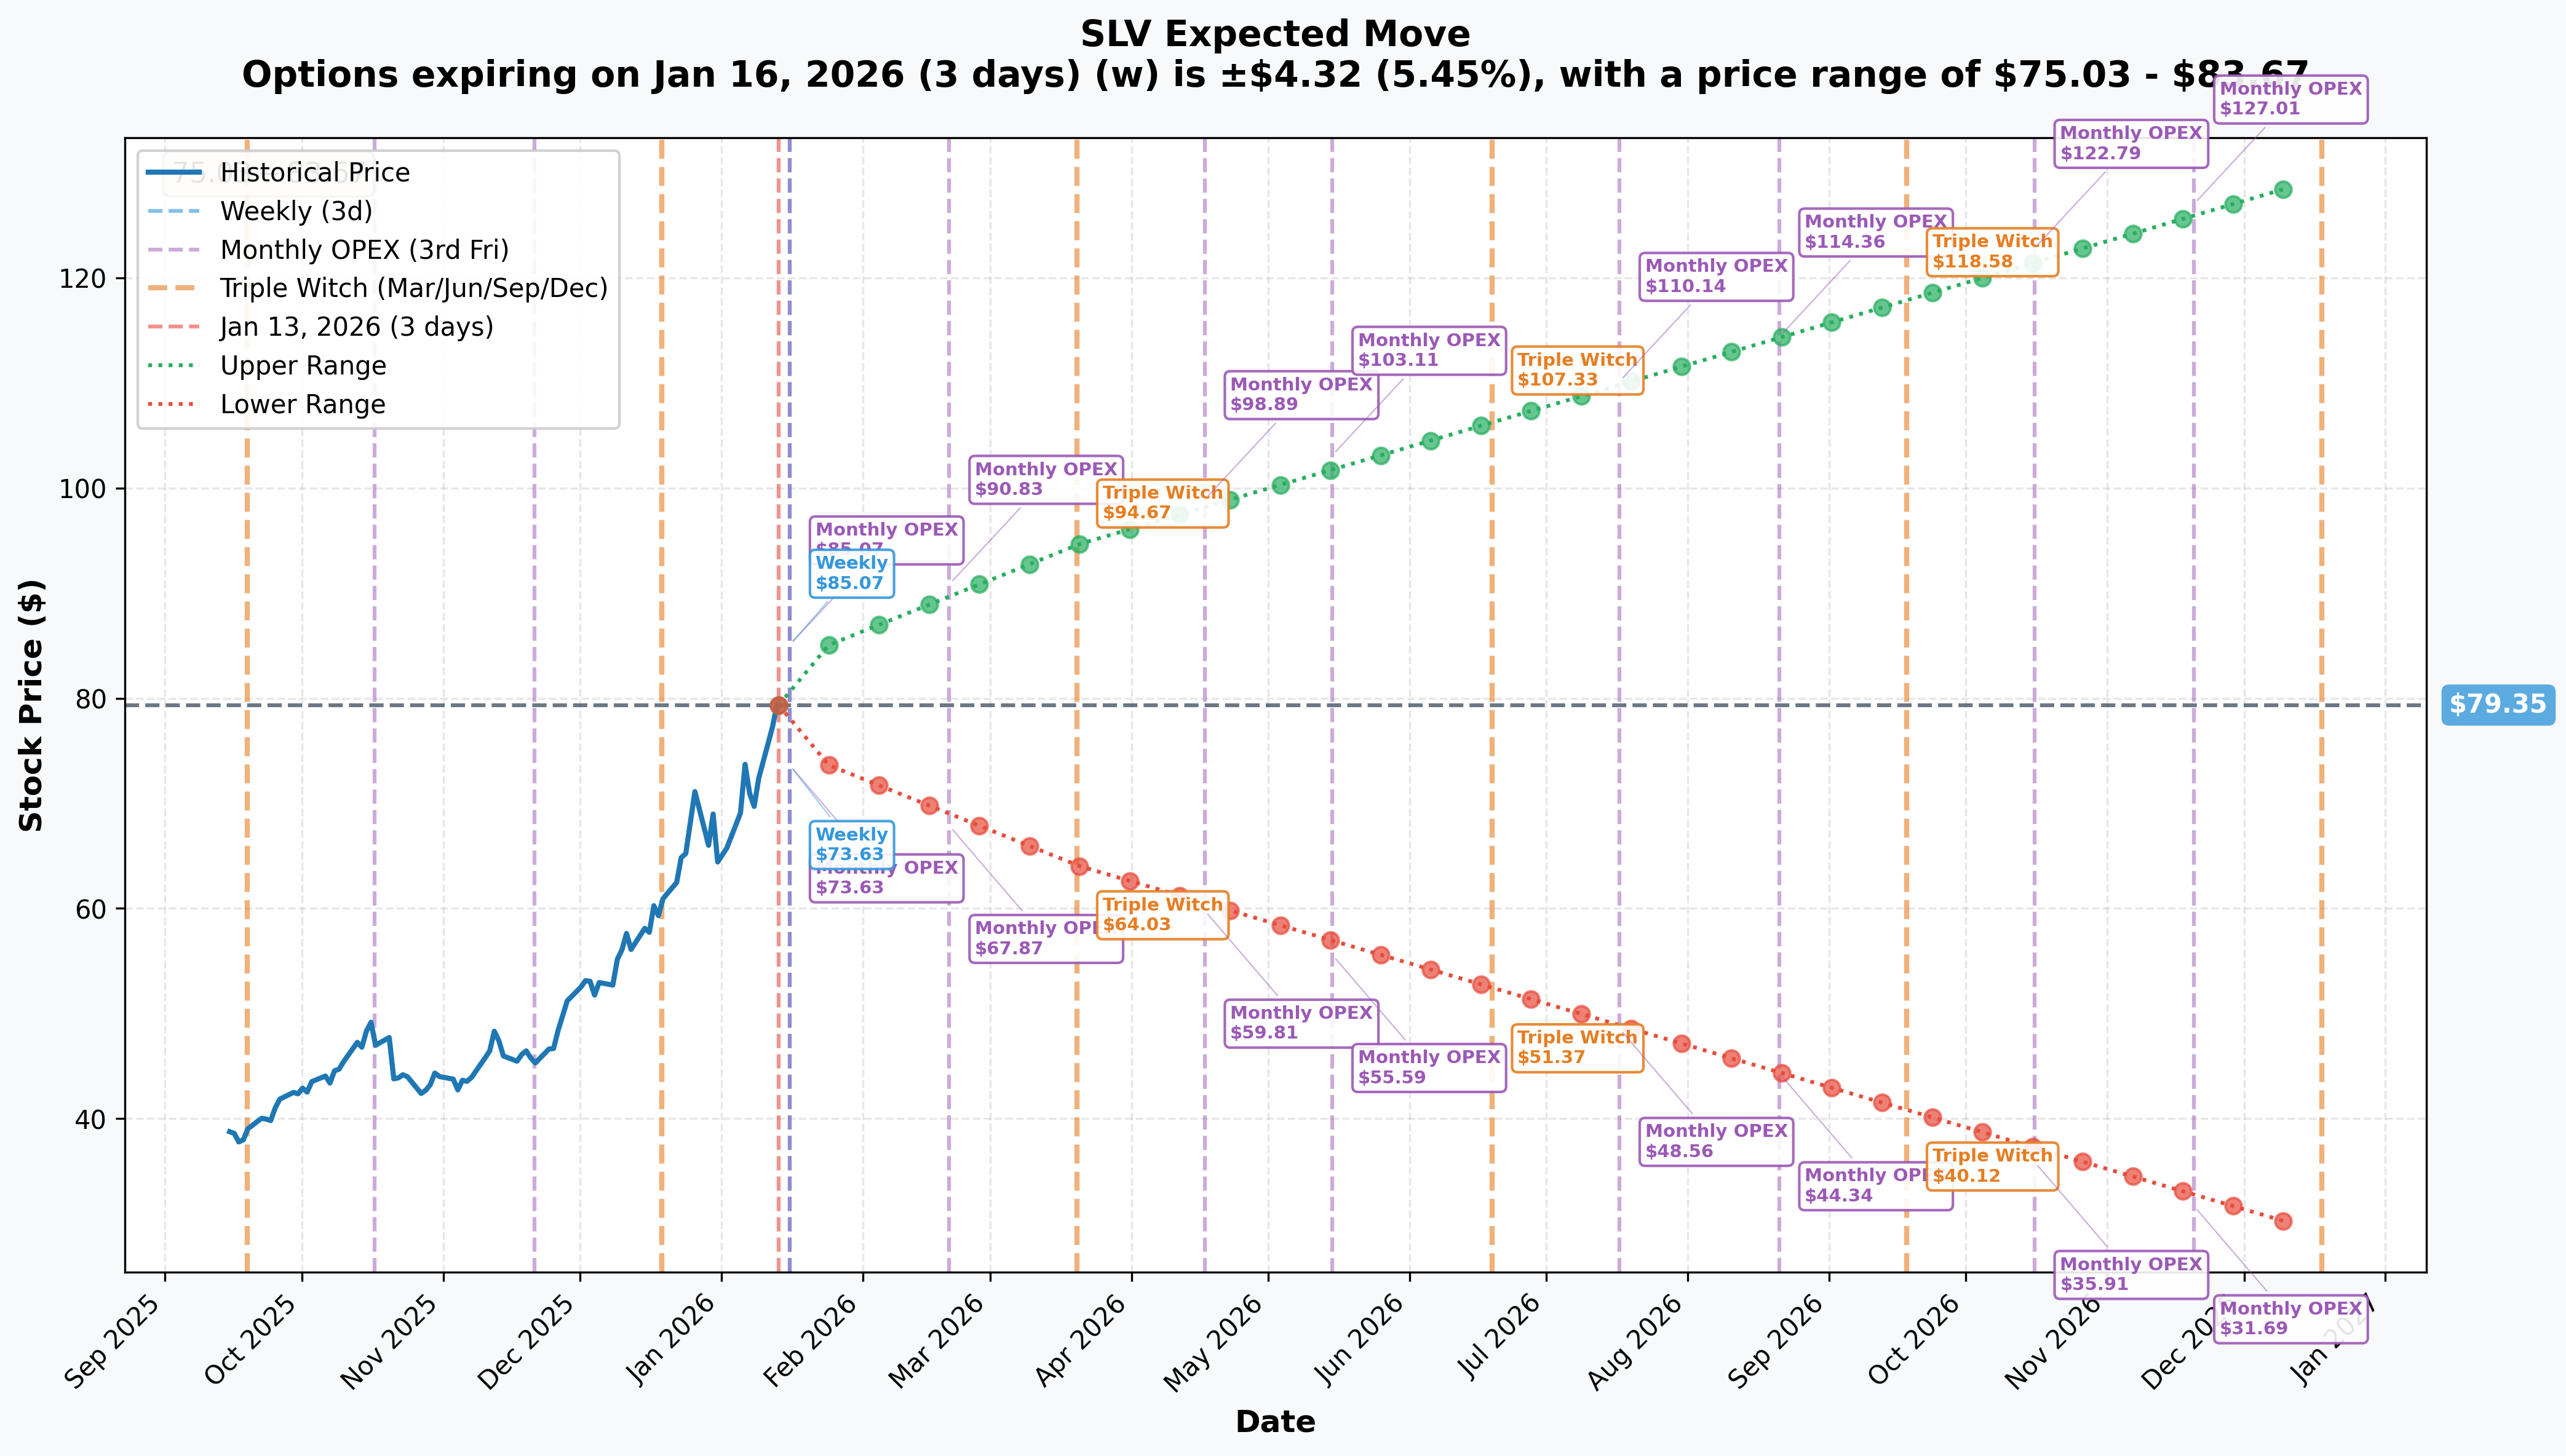
Options Market Expectations:
| Timeframe | Expiry | Days | Implied Move | Upper Range | Lower Range |
|---|---|---|---|---|---|
| Weekly | 2026-01-16 | 3 | +/- 5.45% | $83.67 | $75.03 |
| Monthly OPEX | 2026-01-16 | 3 | +/- 5.45% | $85.07 | $73.63 |
| February | 2026-02-20 | 38 | +/- 14.5%* | $90.83 | $67.87 |
| Triple Witch | 2026-03-20 | 66 | +/- 19.31% | $94.67 | $64.03 |
| April (Trade Exp) | 2026-04-17 | 94 | +/- 24.7%* | $98.89 | $59.81 |
*Estimated based on term structure
Key Insights:
- 5.45% weekly move: Options pricing in potential $4.32 swing by Friday
- 19% quarterly move: March Triple Witch could see SLV between $64-$95
- April expiration (trade's timeframe): Upper target $99, Lower risk $60
- The $70 strike (today's trade) sits at the lower implied move boundary for April
Catalysts
Past Events (Already Happened)
| Date | Event | Impact |
|---|---|---|
| January 12, 2026 | SLV surged 6.71% in single session | Accelerated rally to ATH |
| January 8, 2026 | Silver flash crash (-18% intraday) | Created volatility, but recovered (Financial Content) |
| January 1, 2026 | China silver export restrictions took effect | Major supply shock catalyst (FXStreet) |
| December 2025 | Fed cut rates to 3.50%-3.75% | Supported precious metals (Yahoo Finance) |
| 2025 Full Year | Silver price +147% | Best performance in decades (GoldSilver) |
Upcoming Events (On The Calendar)
| Date | Event | Potential Impact |
|---|---|---|
| January 16, 2026 | Weekly/Monthly OPEX | Gamma unwinding could increase volatility |
| January 29, 2026 | Fed FOMC Meeting | Rate decision impacts precious metals |
| March 19, 2026 | Fed FOMC Meeting | Key policy update |
| March 20, 2026 | Triple Witch Expiration | Major gamma event |
| April 17, 2026 | This Trade's Expiration | Resolution of the $7.6M position |
| May 2026 | Fed Chair Powell term expires | Successor choice could move markets (AInvest) |
| June 2026 | Potential first 2026 rate cut | Bullish for silver if confirmed |
| Q2 2026 | EU building solar mandate | Increased industrial silver demand (Silver Institute) |
Price Targets and Probabilities
Based on Gamma Levels + Implied Move + Catalyst Analysis
| Scenario | Price Target | Probability | Rationale |
|---|---|---|---|
| Bull Case | $90-$95 | 30% | Break above $80 gamma, China restrictions tighten, Fed cuts sooner |
| Base Case | $75-$85 | 50% | Range-bound between major gamma levels, normal profit-taking |
| Bear Case | $65-$70 | 20% | Flash crash repeat, Fed hawkish surprise, dollar strength |
Key Price Levels to Watch:
| Level | Significance | Based On |
|---|---|---|
| $80 | Immediate resistance | Strongest call gamma wall |
| $85 | Secondary resistance | Next gamma cluster |
| $90 | Bull target | Implied move upper bound |
| $78 | Immediate support | Strong put gamma |
| $75 | Key support | Major gamma wall + implied move |
| $70 | Major floor | Massive gamma + today's trade strike |
| $64 | Quarterly lower bound | Triple Witch implied move floor |
Trading Ideas
Conservative ("Sleep Well" Strategy)
If you're long SLV and nervous after this rally:
- Play: Write covered calls at $85 strike for February
- Collect: ~$3-4 per share premium
- Outcome: Lock in gains if called away at $85 (+7% from here)
- Downside: Keep premium + shares if stays below $85
- Why This Works: Follows the smart money profit-taking thesis
Balanced ("Follow The Flow" Strategy)
If you want to trade the range:
- Play: Buy $75 put / Sell $85 call (collar) for March
- Cost: Near zero net cost
- Protection: Locked in gains between $75-$85
- Downside: Capped upside above $85
- Why This Works: Gamma profile suggests $75-$85 range likely
Aggressive ("Bet on Pullback" Strategy)
If you think profit-taking continues:
- Play: Buy $75 puts expiring February
- Cost: ~$2.50 per contract
- Target: $70 support (14% downside from current)
- Risk: Lose premium if silver continues higher
- Why This Works: Flash crash showed downside velocity; overbought technicals
Risk Factors
What Could Go Wrong (Both Directions):
| Risk | Direction | Severity |
|---|---|---|
| Fed Hawkish Surprise | Bearish | HIGH - Could trigger 15-25% correction |
| Dollar Strength | Bearish | HIGH - Inverse correlation to silver |
| Flash Crash Repeat | Bearish | HIGH - January 8 showed fragility (Financial Content) |
| Industrial Slowdown | Bearish | HIGH - 60% of silver demand is industrial |
| Technical Overbought | Bearish | MODERATE - RSI stretched on all timeframes |
| China Restrictions Expand | Bullish | MODERATE - Further supply squeeze |
| Solar Demand Surge | Bullish | MODERATE - EU mandates driving consumption |
| Gold Catch-Up Play | Bullish | MODERATE - Gold-silver ratio still elevated |
The Elephant in the Room: Silver has rallied 187% in one year. Historical precedent shows 30-50% corrections are common in precious metals bull markets. ING forecasts an average of just $55/oz for 2026, suggesting significant downside risk from current $85+ levels (ING Think).
The Bottom Line
Here's the deal: Today's $7.6M trade tells a simple story - after the best year for silver in decades, smart money is taking profits. This doesn't mean silver is done rallying, but it does mean the easy money has been made.
The trade itself (closing deep ITM calls at $70 strike) is completely rational:
- The position likely doubled or tripled in value
- Volatility is elevated after last week's flash crash
- Overbought technicals suggest consolidation ahead
- Why risk a pullback when you're sitting on massive gains?
Your Action Checklist:
If You Already Own SLV:
- Consider writing covered calls to monetize volatility
- Set stops below $75 (major gamma support)
- Take partial profits on 20-30% of position
- Mark calendar for January 29 Fed meeting
If You're Watching From Sidelines:
- Wait for pullback to $75 gamma support before entry
- Don't chase all-time highs after 187% rally
- Consider put spreads if expecting mean reversion
- Watch $80 for breakout confirmation
Key Dates:
- January 16: Weekly/Monthly OPEX (volatility event)
- January 29: Fed FOMC decision
- April 17: This trade's expiration date
Quick Reference Card
| Metric | Value |
|---|---|
| Ticker | SLV |
| Strategy Detected | Close Long Call (BTC) |
| Premium | $7.6M |
| Contracts | 6,500 |
| Strike | $70 |
| Expiration | 2026-04-17 |
| Current Price | $79.29-$80.04 |
| Key Support | $78, $75, $70 |
| Key Resistance | $80, $85, $90 |
| Implied Move (Weekly) | +/- 5.45% |
| Implied Move (April) | +/- 24.7% |
| Net Gamma Bias | Bullish |
| Analyst Targets | $85-$175/oz (silver spot) |
Tags
Time Horizon: #Monthly #Quarterly Strategy Type: #ProfitTaking #PositionClosure Risk Level: #HighVolatility Trader Types: #SwingTrade #Premium #Investor Asset Class: #Commodities #PreciousMetals #Silver
Disclaimer: This analysis is for educational purposes only and does not constitute investment advice. Options trading involves substantial risk of loss. Silver and silver ETFs are highly volatile investments. The $7.6M trade analyzed here represents institutional positioning that may not be suitable for retail accounts. Past performance is not indicative of future results. Always do your own research and consider consulting a financial advisor before trading.