🪙 SLV $7.5M Long Put - Smart Money Betting on Silver Pullback After Historic Rally!
📅 January 22, 2026 | 🔥 Unusual Activity Detected
🎯 The Quick Take
Someone just dropped $7.5 MILLION on SLV puts this morning - buying 5,000 contracts of $86 strike puts expiring September 18th! With silver up a staggering 148% over the past year and now trading at all-time highs above $86 after China's game-changing export restrictions, this trader is paying up for 8 months of downside protection. Translation: After a vertical rally that has silver at its highest price EVER, institutional money is buying insurance!
📊 ETF Overview
iShares Silver Trust (SLV) is the dominant silver ETF giving investors direct exposure to physical silver bullion:
- AUM: $49.73 Billion (10x larger than nearest competitor)
- Industry: Commodity Contracts Brokers & Dealers (Physical Silver)
- Current Price: $86.85
- Trust Holdings: 516,760,830 ounces of silver (16,073 tonnes)
- Expense Ratio: 0.50%
- 52-Week Range: $26.57 - $84.78 (current price is ALL-TIME HIGH territory!)
- YTD Performance 2026: +27% (on top of 2025's massive gains)
- 1-Year Performance: +148%
💰 The Option Flow Breakdown
The Tape (January 22, 2026 @ 10:35:37):
| Date | Time | Symbol | Buy/Sell | Type | Expiration | Strike | Volume | Premium | Order Type | Z-Score | Classification |
|---|---|---|---|---|---|---|---|---|---|---|---|
| 2026-01-22 | 10:35:37 | SLV | BUY | PUT $86 | 2026-09-18 | $86 | 5,000 | $7.5M | BTO | 100.99 | EXTREMELY_UNUSUAL |
🤓 What This Actually Means
This is a long-dated protective position on silver exposure! Here's the breakdown:
- 💸 Massive premium paid: $7.5M ($15.00 per contract x 5,000 contracts)
- 🛡️ At-the-money strike: $86 is essentially current price - pure downside protection
- ⏰ Long duration: 239 days to September expiration captures full year of potential volatility
- 📊 Size matters: 5,000 contracts represents 500,000 shares worth ~$43.4M of silver exposure
- 🏦 Institutional hedge: This is sophisticated portfolio protection after a 148% rally
What's really happening here: This trader likely accumulated a MASSIVE long position in silver (either through SLV shares, COMEX futures, or physical holdings) during the 2024-2025 rally from ~$25 to $86. Now, with silver breaking above $90/oz for the first time in history on the back of China's January 1st export restrictions, they're paying $15 per share for 8 months of downside protection. If SLV drops below $86 (currently at $86.85), these puts pay off dollar-for-dollar. This is portfolio insurance on a position that's likely worth hundreds of millions.
Unusual Score: 🔥 EXTREMELY UNUSUAL (Z-Score: 100.99, Vol/OI Ratio: 26.46x) - This level of activity happens maybe a few times per year. The volume signal confirms this is an OPEN position, meaning fresh capital entering the options market, not someone closing an existing trade.
📈 Technical Setup / Chart Check-Up
YTD Performance Chart
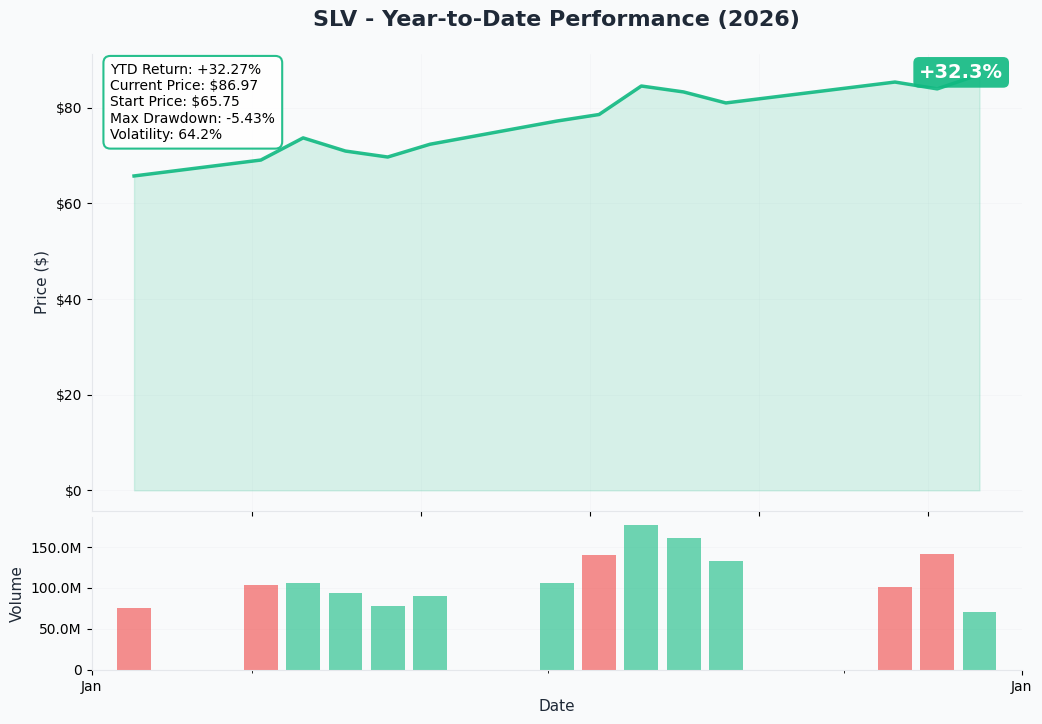
SLV is in absolute parabolic territory - the chart shows a vertical rally that started in late 2024 and accelerated dramatically in January 2026 after China implemented sweeping export restrictions on refined silver. The ETF has more than doubled in the past 12 months, with silver posting its strongest weekly gain since 1998 (up 18%) in mid-January alone.
Key observations:
- 🚀 Parabolic move: Vertical rally from $35 range to $85+ in under 12 months
- 📈 All-time high breakout: Silver broke above its 1980 Hunt Brothers squeeze high in real terms
- 🎢 Extended from all moving averages: RSI approaching 87 (extreme overbought)
- 📊 Volume explosion: 95 million ounces of ETF inflows in 2025 alone
- ⚠️ Overbought territory: Weekly RSI at levels last seen during the 2020 pandemic rally
Gamma-Based Support & Resistance Analysis
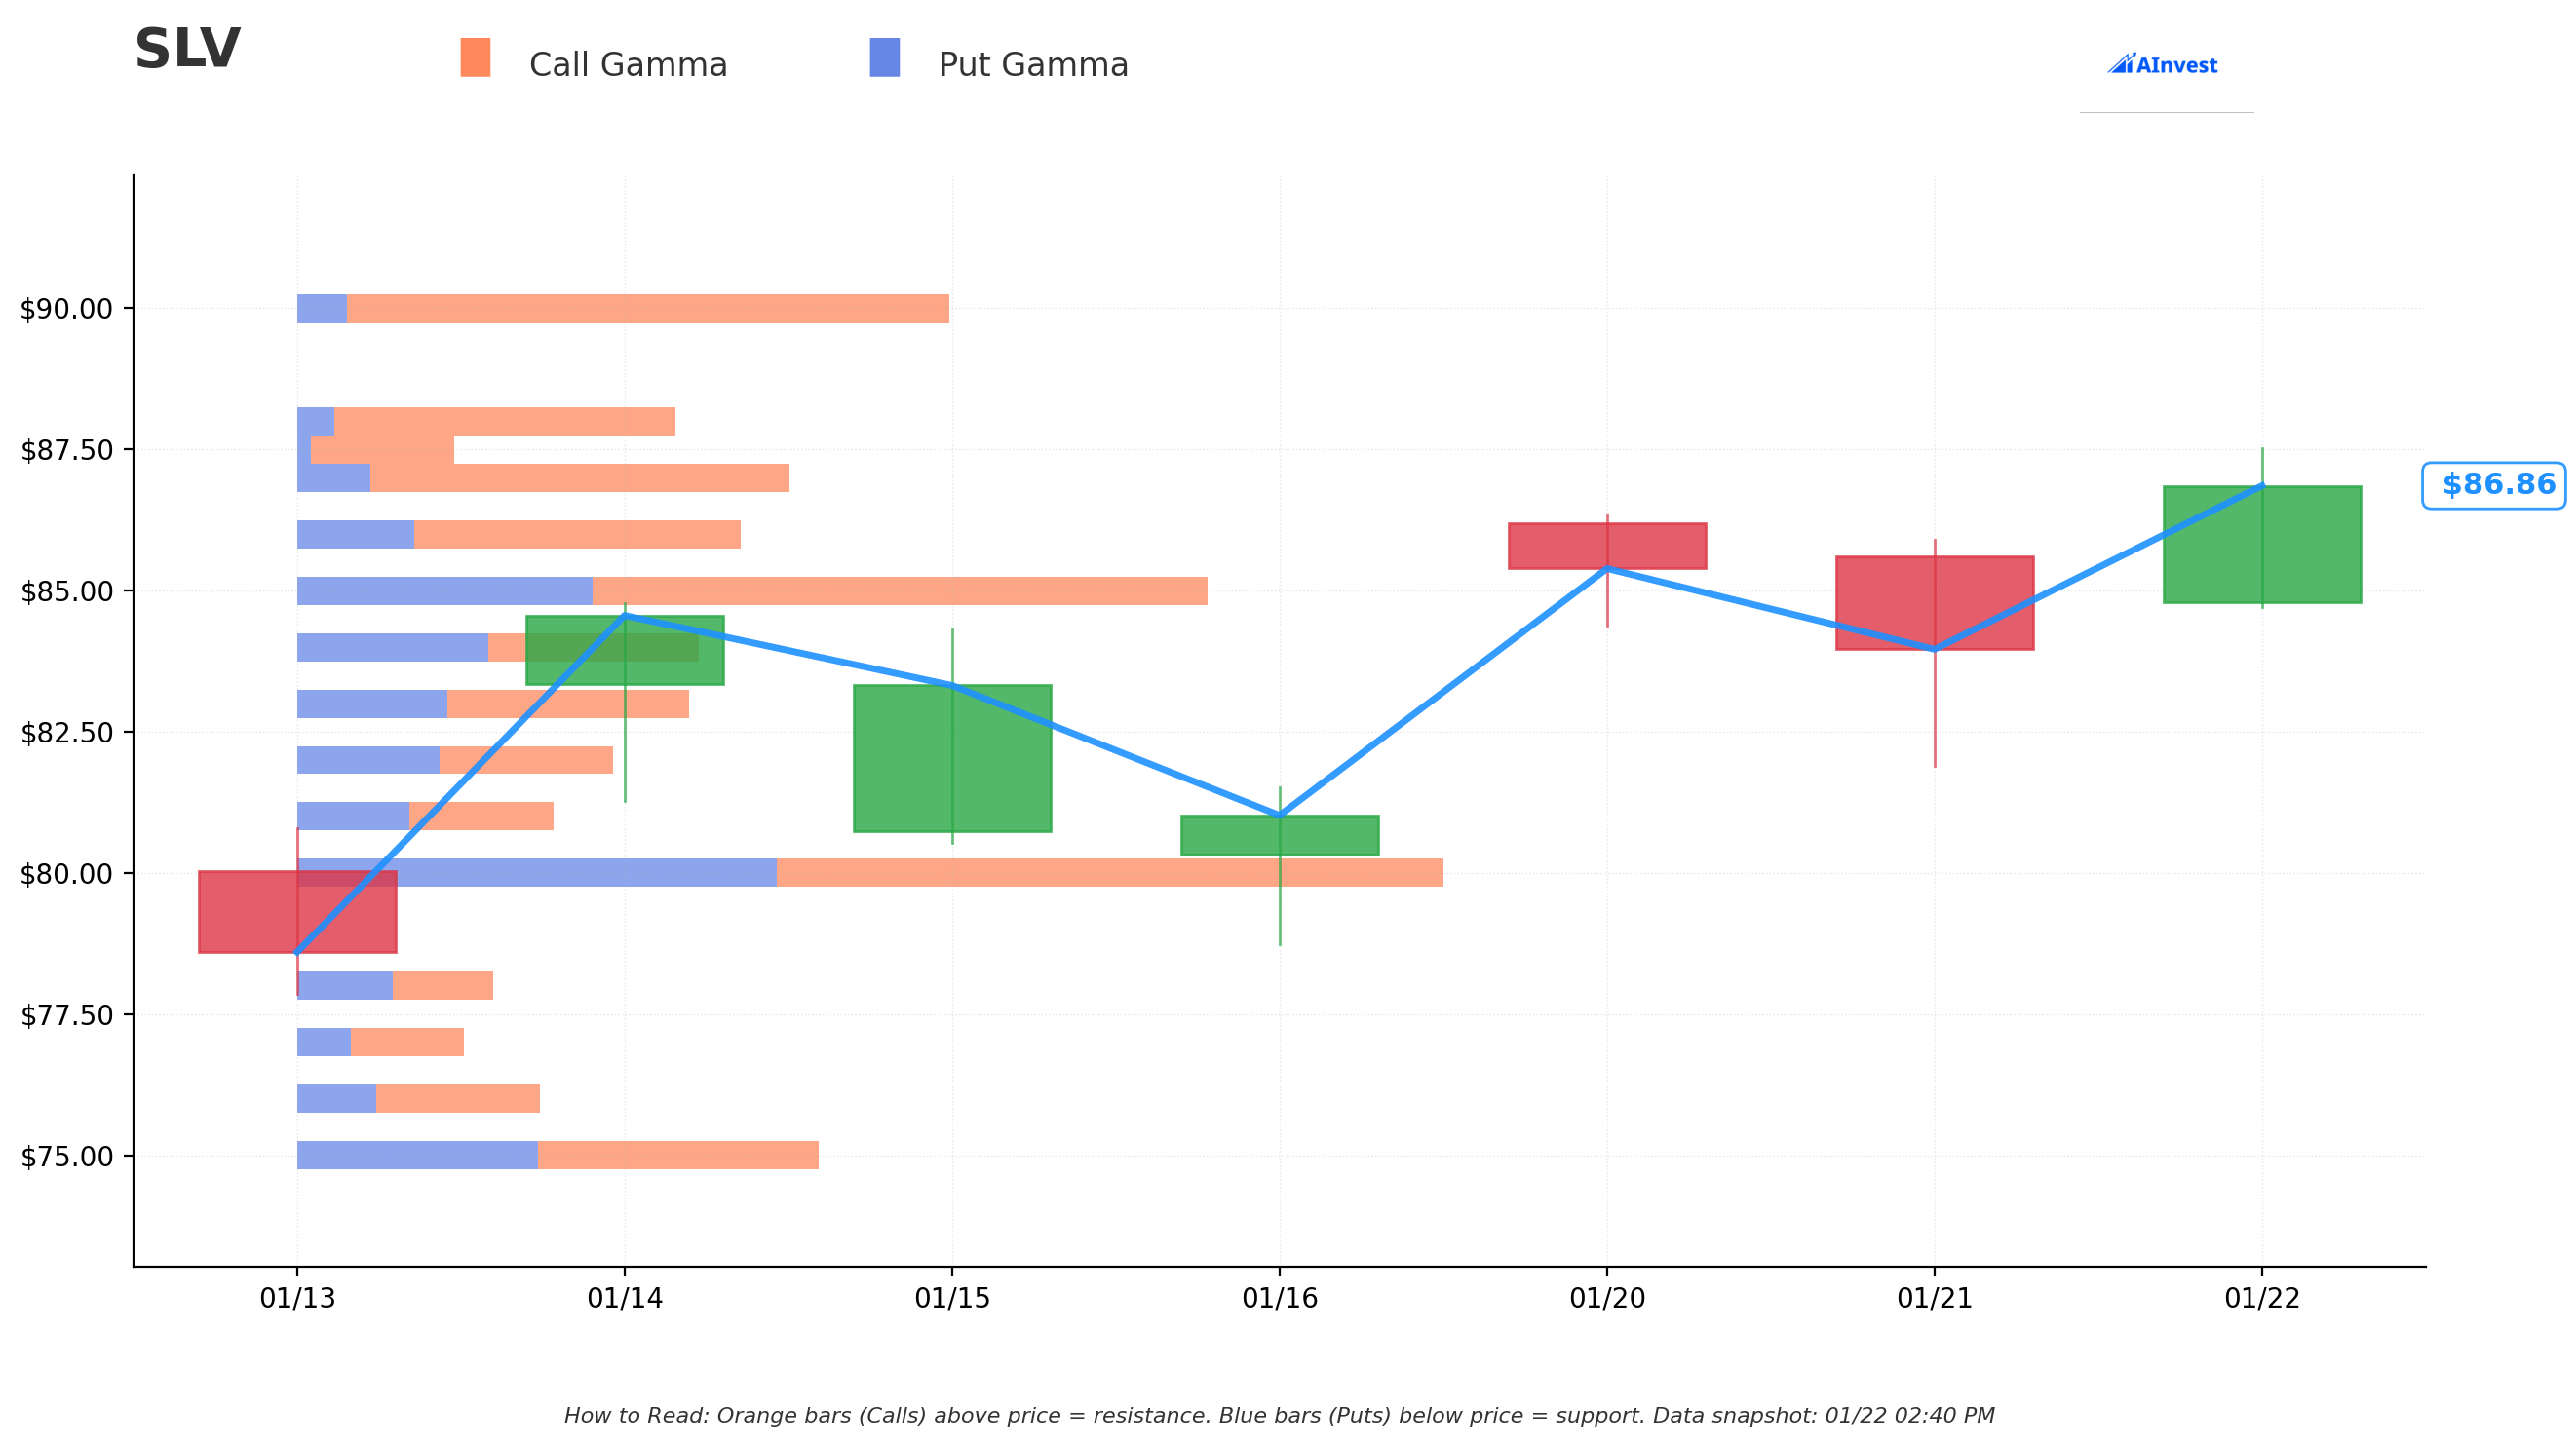
Current Price: $86.85
The gamma exposure map reveals critical price magnets and barriers that will govern near-term price action:
🔵 Support Levels (Put Gamma Below Price):
- $86.00 - Immediate support with 26.9B total gamma (THIS IS THE PUT STRIKE - not coincidental!)
- $85.00 - Strong secondary support at 55.4B gamma (strongest nearby floor!)
- $84.00 - Additional support at 24.3B gamma
- $80.00 - Major structural floor with 69.2B gamma (highest total gamma - this is the LINE IN THE SAND)
- $75.00 - Extended support at 31.5B gamma
- $70.00 - Deep support at 48.7B gamma
🟠 Resistance Levels (Call Gamma Above Price):
- $87.00 - Immediate ceiling with 49.7B gamma and 40.8B NET call gamma (STRONGEST RESISTANCE)
- $88.00 - Secondary resistance at 23.1B gamma
- $90.00 - Psychological round number with 39.7B gamma (critical breakout level)
What this means for traders: SLV is currently sitting RIGHT between massive $86 support (the exact put strike) and crushing $87 resistance (40.8B net call gamma). The gamma data shows market makers holding enormous call positions at $87-$90 which creates natural selling pressure as price approaches. The $85 level with 55.4B total gamma and the $80 level with 69.2B gamma are the critical supports - break below those and momentum could accelerate significantly lower.
Notice anything? The put buyer struck EXACTLY at $86 where there's immediate gamma support. They're positioned right at the current price level, expecting that any weakness will be defended initially but preparing for a scenario where support fails and price flushes toward $80-$85. Smart positioning.
Net GEX Bias: Bullish (544.1B call gamma vs 263.8B put gamma) - Overall positioning remains bullish, but the put buyer is betting on a reversal after this extreme rally.
Implied Move Analysis
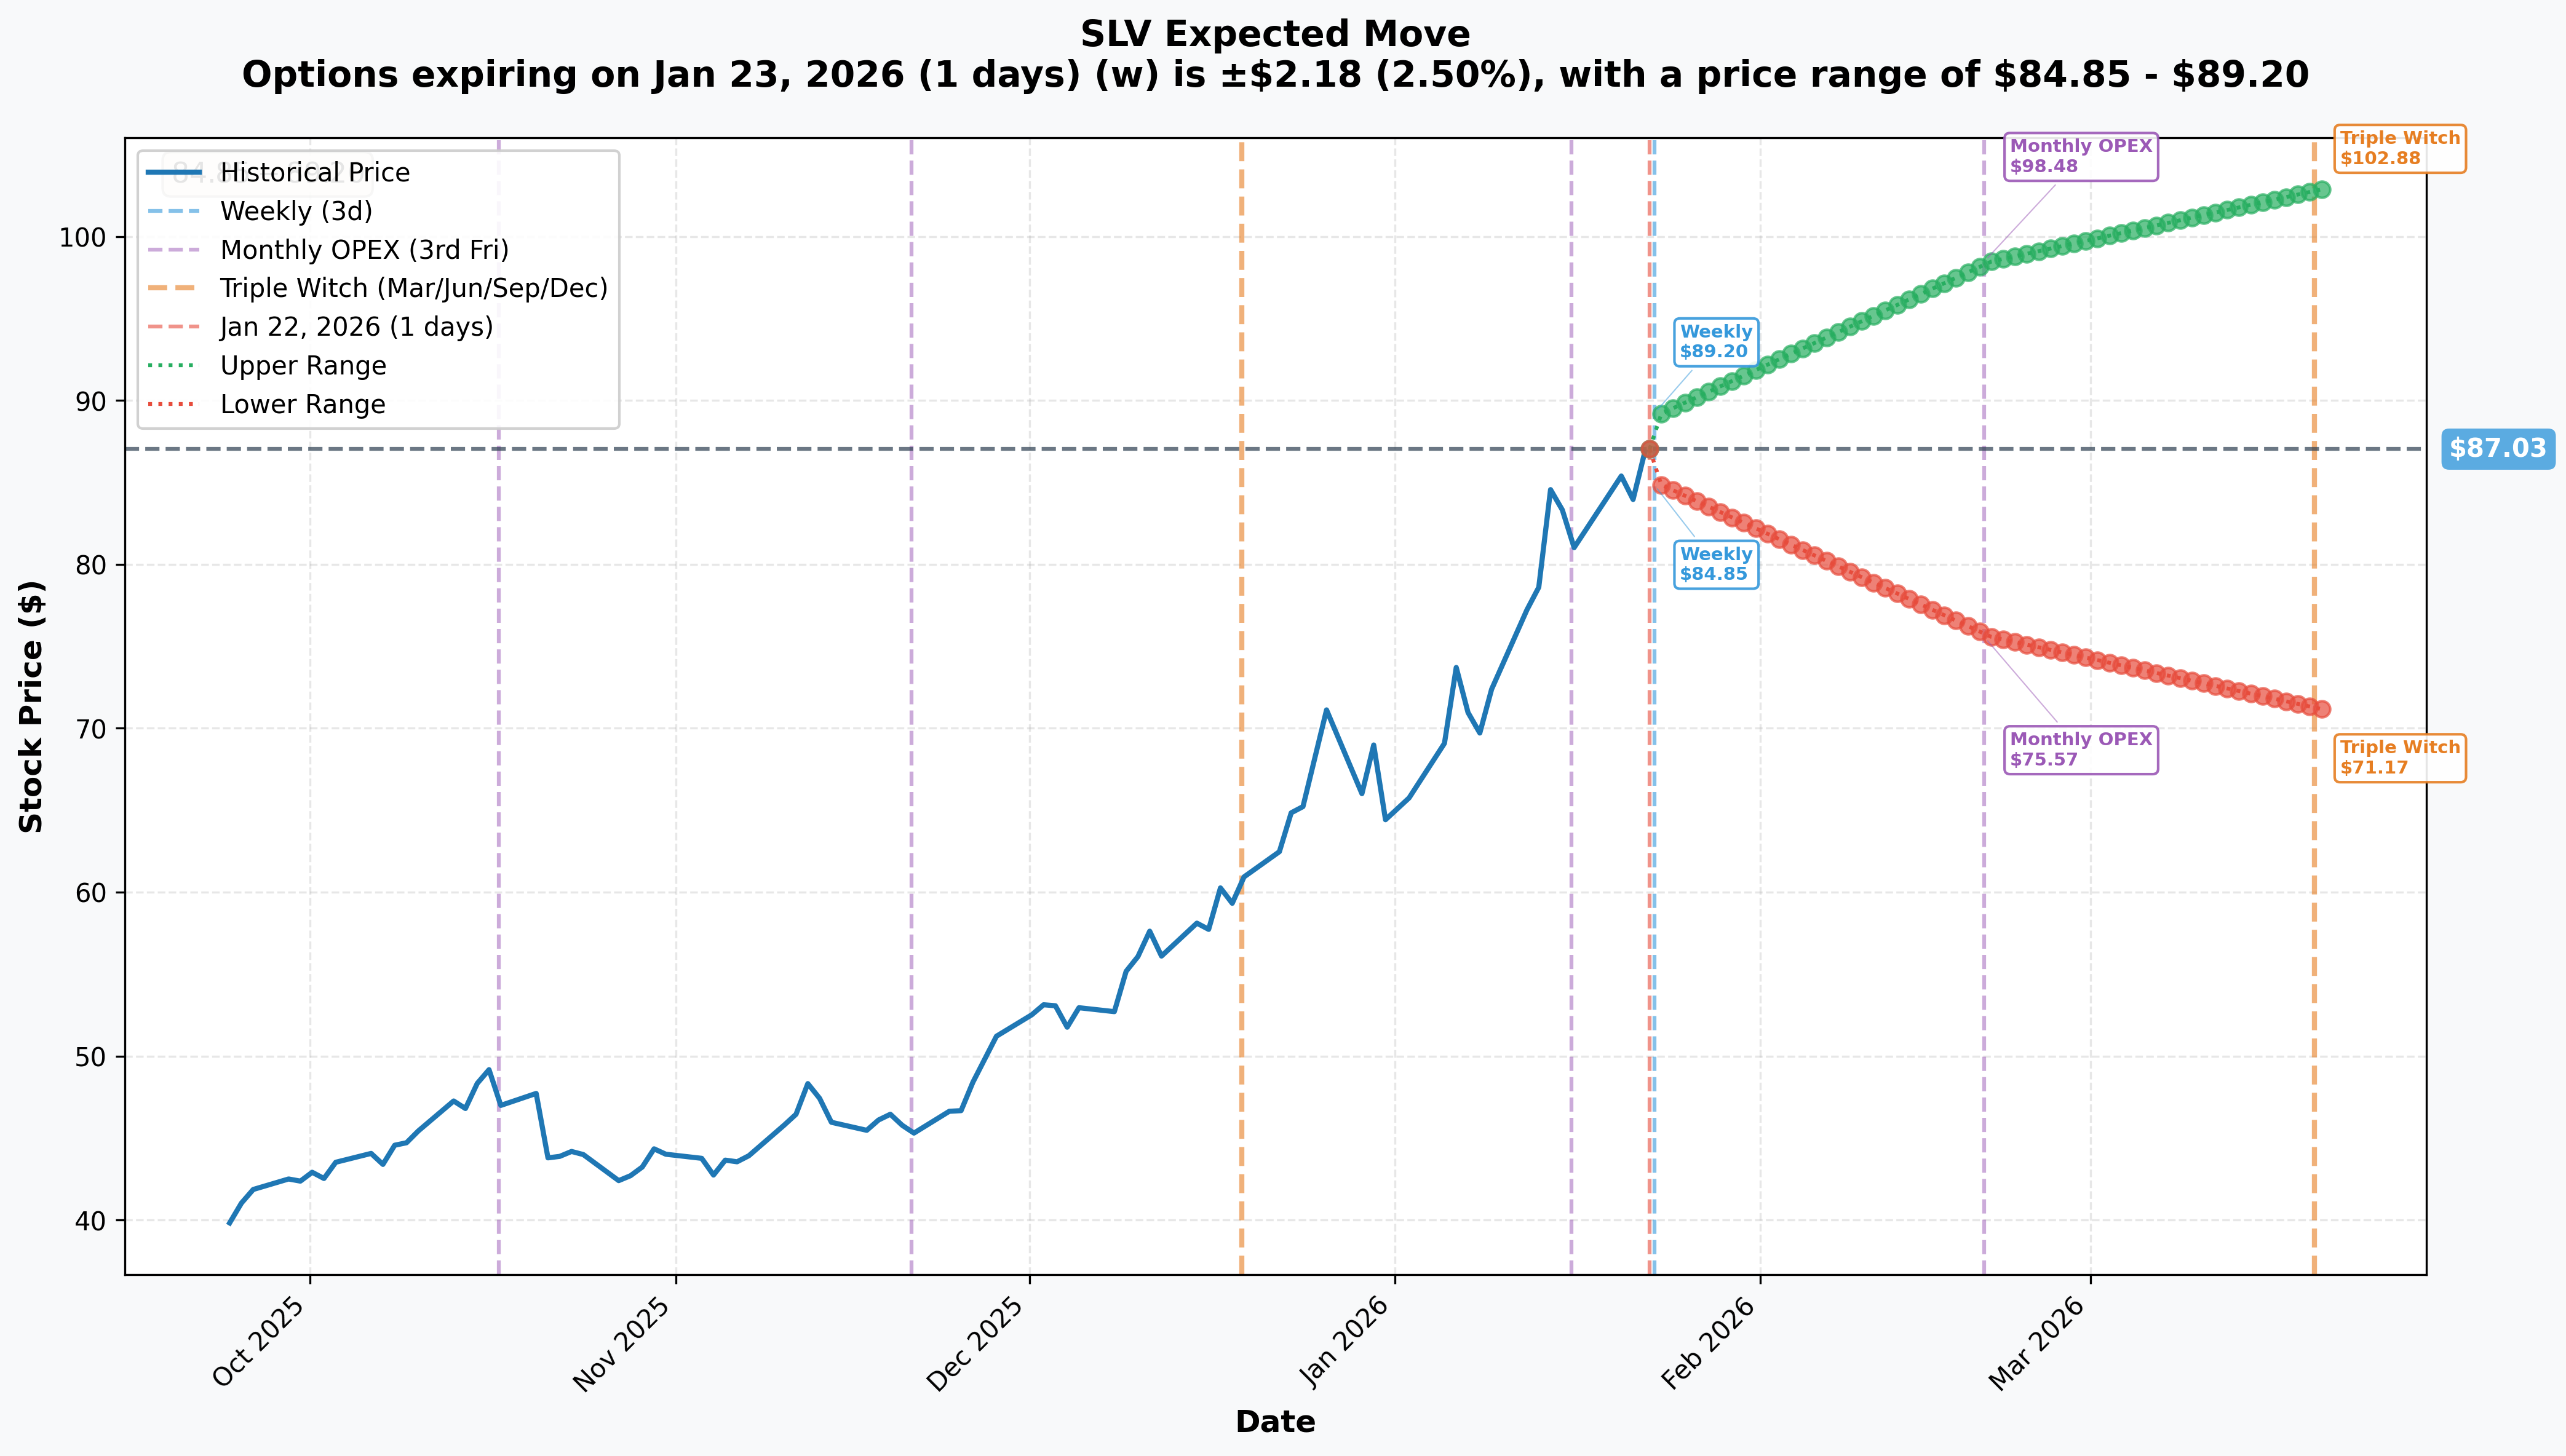
Options market pricing for upcoming expirations:
| Expiration | Days | Type | Implied Move % | Implied Move $ | Upper Range | Lower Range |
|---|---|---|---|---|---|---|
| 2026-01-23 | 1 | Weekly | 2.50% | $2.18 | $89.20 | $84.85 |
| 2026-02-20 | 29 | Monthly OPEX | 13.16% | $11.45 | $98.48 | $75.57 |
| 2026-03-20 | 57 | Triple Witch | 18.22% | $15.85 | $102.88 | $71.17 |
Translation for regular folks: Options traders are pricing in MASSIVE volatility for silver! A 13% move ($11.45) through February OPEX and an 18% move ($15.85) by March triple witch shows the market expects serious fireworks. The market thinks there's a real possibility SLV could trade anywhere from $71 to $103 over the next 2 months - that's a $32 range on an $87 stock!
The September 18th expiration (when this $7.5M trade expires) will likely see even wider implied ranges. The put buyer is protecting against a potential 15-25% drawdown over the next 8 months as the dust settles from silver's historic rally.
Key insight: The sharp increase in implied volatility reflects massive uncertainty. After a 148% rally, the options market is pricing in the possibility of either continued explosive upside OR a significant correction. Smart money is paying up for protection into this uncertain environment.
🎪 Catalysts
🔥 Recent Catalysts (Already Happened)
China Silver Export Restrictions (January 1, 2026) - THE GAME CHANGER
Starting January 1, 2026, China implemented sweeping new export restrictions on refined silver that represent the most significant supply-side shock in decades:
- 🚫 Only 44 state-approved firms with annual production capacity of at least 80 tons can now export silver
- 🌍 China controls 60-70% of global refined silver supply
- 🏭 Policy blocks hundreds of smaller/mid-sized exporters who previously served as key global suppliers
- 🚨 Elon Musk publicly raised alarm: "This is not good. Silver is needed in many industrial processes"
- ⚡ China has elevated silver to "strategic material" status, similar to rare earth elements
Silver Price Breakthrough to All-Time Highs
Silver reached unprecedented price levels throughout Q4 2025 and into January 2026:
- October 2025: Hit $54.24 per ounce before correcting
- December 2025: Spot prices briefly surpassed $80/oz for first time ever
- January 2026: Silver broke above $90/oz, reaching $92.39
Gold-Silver Ratio Compression
The gold-silver ratio has dramatically compressed from extreme levels:
- April 2025: Ratio climbed above 100:1 (more than two standard deviations above average)
- January 2026: Ratio compressed to approximately 50:1, a 14-year low
- This compression signals silver catching up to gold's gains after years of underperformance
🚀 Upcoming Catalysts (Next 6 Months)
Federal Reserve Leadership Transition (May 2026)
Chair Jerome Powell's term expires in May 2026, creating significant monetary policy uncertainty:
- 📉 More dovish successor could accelerate precious metals rally
- 📈 Hawkish appointment could temporarily cool momentum
- 💵 Current Fed funds rate at 3.50%-3.75% after consecutive 2025 cuts
- 🎯 At least two additional rate cuts priced in for 2026
Industrial Demand Acceleration
Solar Panel Demand:
- Solar industry consumed 197.6 million ounces in 2024 (19% of total global demand, up from 5% in 2014)
- Silver consumption projected to surpass 200 million ounces annually by end of 2026
- By 2030, solar demand projected to reach 29-41% of total silver supply
Electric Vehicle Demand:
- EVs consume 67-79% more silver than ICE vehicles (approximately 25-50 grams per EV)
- 2025 automotive silver demand approaching 90 million ounces
- EVs projected to overtake ICE vehicles as primary source of automotive silver demand by 2027
Price Target Milestones from Major Analysts:
| Institution | Price Target | Timeframe | Source |
|---|---|---|---|
| Citigroup | $100/oz | March 2026 | |
| Bank of America | $56/oz avg, $65/oz peak | 2026 | |
| GoldSilver (Alan Hibbard) | $175+/oz | 2026 | |
| LBMA Survey Average | $79.50/oz | 2026 | |
| Oregon Group (Aggressive) | $150/oz | 2026 |
🎲 Price Targets & Probabilities
Using gamma levels, implied move data, and upcoming catalysts, here are the scenarios through September 18th expiration:
📈 Bull Case (30% probability)
Target: $100-$120
How we get there:
- 💪 China's export restrictions remain in place and potentially tighten further
- 🚀 Supply deficit deepens beyond the 63-95 million ounces expected for 2025
- 🤖 Industrial demand from solar/EVs accelerates faster than expected
- 📈 Fed cuts rates more aggressively, weakening USD and boosting precious metals
- 🌐 Gold-silver ratio compresses further toward historical 30-40:1 levels
- 📊 ETF inflows continue at 2025's record pace, absorbing available supply
- 🎯 Citigroup's $100/oz target proves conservative
Key metrics needed:
- Supply deficit accelerating (over 100M oz shortfall)
- China restrictions maintained or expanded
- Solar/EV demand surprising to upside
- Fed cutting rates by 100bps+ in 2026
Probability assessment: 30% because structural supply deficit and industrial demand are REAL, but vertical rallies rarely sustain without corrections. Much of the bullish thesis is already priced in after 148% gains.
🎯 Base Case (45% probability)
Target: $75-$90 range (VOLATILE CONSOLIDATION)
Most likely scenario:
- ✅ Silver digests massive gains, consolidates in wide range
- 📱 China export restrictions remain but market adapts to new supply reality
- ⚖️ Fifth year of structural deficit continues but at manageable levels
- 🤖 Industrial demand steady but not explosive
- 🔄 Trading within $75-$90 range for several months as RSI works off overbought conditions
- 📊 ETF flows turn slightly negative on profit-taking (already seeing -$495M in 5-day flows)
- 💤 Volatility slowly decreases from extreme levels
This is the put buyer's insurance scenario: Stock pulls back to test $80-$86 support levels, puts provide cushion during the correction, then rally resumes. The $7.5M is the "cost of sleeping well at night" for a position that has generated hundreds of millions in gains.
Why 45% probability: After 148% rally, consolidation is the most natural next step. Fundamentals remain supportive but technicals are extreme with RSI at 87. Most institutional players will take some profits and wait for pullbacks to re-engage.
📉 Bear Case (25% probability)
Target: $60-$75 (SIGNIFICANT CORRECTION)
What could go wrong:
- 😰 Correction risk after vertical rally - technical overbought conditions normalize violently
- 🚨 China eases export restrictions if geopolitical tensions stabilize
- ⏰ Fed delivers surprise hawkish turn - rate hikes would crush precious metals
- 💸 USD strengthens significantly, pressuring commodity prices
- 📊 Industrial demand softens as high prices accelerate thrifting
- 💰 Massive ETF outflows as investors take profits (-$495M in past 5 days already)
- 🔨 Break below $80 gamma support triggers cascade to $75, then $70, then $65
Critical support levels:
- 🛡️ $85: Immediate support (55.4B gamma) - first defense
- 🛡️ $80: Major gamma floor (69.2B) - MUST HOLD or momentum shifts bearish
- 🛡️ $75: Secondary support (31.5B gamma)
- 🛡️ $70: Extended floor (48.7B gamma) - key Fibonacci retracement zone
- 🛡️ $65.30: Fibonacci 0.50 level
Probability assessment: 25% because it requires multiple negative catalysts to align. Silver's structural supply deficit is REAL, but technicals are screaming overbought and 148% rallies don't sustain forever. The put buyer clearly thinks this scenario has material probability or they wouldn't pay $7.5M for protection.
Put P&L in Bear Case:
- Stock at $75 on Sept 18: Puts worth $11.00, loss = -$4.00/share x 5,000 = -$2M loss (74% retained value)
- Stock at $70 on Sept 18: Puts worth $16.00, profit = $1.00/share x 5,000 = $500K gain (7% ROI)
- Stock at $65 on Sept 18: Puts worth $21.00, profit = $6.00/share x 5,000 = $3M gain (40% ROI)
- Stock at $86 on Sept 18: Puts expire worthless, loss = -$15.00/share x 5,000 = -$7.5M (100% loss)
💡 Trading Ideas
🛡️ Conservative: Wait for Pullback to Load Up
Play: Stay on sidelines until silver corrects to $75-$80 support
Why this works:
- ⏰ After 148% rally, chasing here is dangerous - buy the dip, not the rip
- 💸 Implied volatility extremely elevated - options EXPENSIVE at current levels
- 📊 RSI at 87 is extreme - technical reversion likely
- 🎯 Better entry likely at $75-$80 gamma support zone with 15-20% margin of safety
- 📉 The $7.5M institutional put buy signals smart money is WORRIED - why fight the tape?
- 💰 5-day ETF outflows of $495M show profit-taking already beginning
Action plan:
- 👀 Watch for pullback to $80 gamma support (69.2B gamma wall)
- 🎯 Ideal entry zone: $75-$80 with 20%+ cushion below current highs
- ✅ Confirm support holds before initiating long positions
- 📊 Wait for RSI to normalize below 70 before buying
- ⏰ Patient approach - silver's long-term story remains intact, no need to rush
Risk level: Minimal (cash position) | Skill level: Beginner-friendly
Expected outcome: Avoid potential 15-25% drawdown if correction materializes. Get better entry on any pullback. Maintain optionality.
⚖️ Balanced: Sell Put Spreads at Support
Play: Sell put spreads at gamma support levels to collect premium while defining risk
Structure: Sell $80 puts, Buy $75 puts (March 20 expiration)
Why this works:
- 🎢 High implied volatility means rich premiums for put sellers
- 📊 Defined risk spread ($5 wide = $500 max risk per spread)
- 🎯 Targets gamma support zone at $80 where 69.2B gamma provides floor
- 🛡️ Breakeven around $78 provides cushion below major support
- ⏰ 57 days to expiration captures any near-term volatility
- 💰 Collect ~$1.50-2.00 per spread (30-40% potential return on risk)
Estimated P&L:
- 💰 Collect: ~$1.50-2.00 net credit per spread
- 📈 Max profit: $150-200 if SLV above $80 at March expiration
- 📉 Max loss: $300-350 if SLV below $75 (defined and limited)
- 🎯 Breakeven: ~$78.00-78.50
- 📊 Risk/Reward: 1:2 favorable ratio
Position sizing: Risk only 3-5% of portfolio per spread position
Risk level: Moderate (defined risk, neutral-to-bullish) | Skill level: Intermediate
🚀 Aggressive: Long Puts on Overbought Reversal (ADVANCED ONLY!)
Play: Buy puts betting on mean reversion from extreme overbought conditions
Structure: Buy $85 puts (March 20 expiration)
Why this could work:
- 💥 RSI at 87 is extreme - historically leads to corrections
- 🎰 Betting that 148% rally MUST consolidate at some point
- 📊 Implied move range of $71-$103 by March means market pricing big moves possible
- 🚀 Goldman Sachs expects extreme price swings to persist
- ⚡ Only need 10-15% pullback to profit significantly
- 📈 Technical divergences emerging on daily charts
Why this could blow up (SERIOUS RISKS):
- 💸 FIGHTING THE TREND: Silver in strong uptrend - could go higher first
- ⏰ TIMING IS EVERYTHING: Being early is the same as being wrong
- 😱 STRUCTURAL BULLS: Supply deficit and China restrictions are REAL catalysts
- 📊 PREMIUM EXPENSIVE: High IV means paying up for puts
- 🎢 Could easily lose entire premium if rally continues
Estimated P&L:
- 💰 Cost: ~$6-8 per put contract
- 📈 Profit scenario: SLV drops to $75 by March = puts worth $10+ (25-50% gain)
- 🚀 Home run: SLV drops to $70 = puts worth $15+ (100%+ gain)
- 📉 Loss scenario: SLV stays $85+ = lose 50-100% of premium
- 💀 Total loss: SLV rallies to $95+ = lose entire premium
CRITICAL WARNING - DO NOT attempt unless you:
- ✅ Have traded through volatile commodity markets before
- ✅ Can afford to lose ENTIRE premium (real possibility!)
- ✅ Understand you're betting AGAINST a strong trend
- ✅ Have exit strategy if wrong (stop at 50% loss)
- ✅ Accept that China news or Fed comments could crush this trade overnight
Risk level: HIGH (can lose 100% of premium) | Skill level: Advanced only
Probability of profit: ~35% (lower than 50% because trend remains bullish)
⚠️ Risk Factors
Don't get caught by these potential landmines:
-
🚀 Fighting a powerful trend: Silver is in a STRONG structural uptrend with China export restrictions, supply deficits, and industrial demand all bullish. Shorting or buying puts here could get steamrolled if rally continues. The put buyer paid $7.5M knowing they could lose it ALL if silver keeps running.
-
🇨🇳 China wildcard cuts both ways: While China's export restrictions sparked this rally, policy could ease if geopolitical tensions stabilize. Any hint of relaxation would trigger massive selling. Conversely, TIGHTER restrictions would send silver parabolic.
-
📊 Extreme technicals create binary outcomes: RSI at 87, weekly RSI approaching 2020 levels, and emerging bearish divergences all signal overbought conditions. But overbought can stay overbought - silver could rally another 20% before correcting.
-
💵 Fed policy risk: If the Federal Reserve delivers surprise rate hikes in 2026, precious metals would likely drop significantly. Higher rates increase opportunity cost of holding non-yielding assets like silver. The Fed leadership transition in May 2026 creates additional uncertainty.
-
💰 ETF flows already turning: 5-day net flows of -$494.54M and 1-month net flows of -$297.85M show institutional profit-taking already underway. Continued outflows could accelerate any correction.
-
🏭 Industrial demand elasticity: At current extreme prices, industrial demand is softening moderately (down ~2%) as manufacturers accelerate thrifting efforts. Higher prices = more incentive to find silver substitutes.
-
📉 Valuation stretched after historic rally: Silver is trading at all-time highs after a 148% gain. Much of the bullish narrative is already priced in. Any disappointment relative to extreme expectations could trigger sharp selloffs.
-
🐋 Smart money hedging signals caution: The $7.5M institutional put purchase at current levels signals sophisticated players are protecting gains rather than adding exposure. When funds with massive profits pay up for 8 months of downside protection, it's a caution flag worth noting.
🎯 The Bottom Line
Real talk: Someone just spent $7.5 MILLION on SLV puts protecting against downside in silver after the metal's most explosive rally in decades. This isn't bearish on silver's long-term structural story - it's smart risk management by institutions who've made ENORMOUS money on the 148% rally from $26 to $87 and don't want to give it back.
What this trade tells us:
- 🎯 Sophisticated player expects VOLATILITY over the next 8 months (not necessarily crash, but protecting against 15-25% pullback scenario)
- 💰 They're worried enough about $86 becoming resistance to pay $15/share for insurance
- ⚖️ The at-the-money strike shows they see risk RIGHT HERE at current levels
- 📊 September expiration captures Fed leadership transition, summer seasonality, and full digestion of China news
- ⏰ 239 days of protection suggests they're not calling a top, but want to ride out any near-term volatility
This is NOT a "sell everything" signal - it's a "protect your gains" signal.
If you own silver/SLV:
- ✅ Consider trimming 20-30% at $85-90 levels (lock in generational gains, reduce risk)
- 📊 If holding through potential correction, know your support levels: $85, $80, $75
- ⏰ Don't get greedy - up 148% in 12 months is LIFE-CHANGING. Protecting profits is smart.
- 🎯 If pullback occurs to $75-80 and holds, could re-add shares on confirmation
- 🛡️ Consider buying protective puts if holding large position
If you're watching from sidelines:
- ⏰ DO NOT chase the rally at all-time highs
- 🎯 Post-correction pullback to $75-80 would be EXCELLENT entry (15-20% off highs with gamma support)
- 📈 Looking for confirmation of: China restrictions maintained, supply deficit continuing, Fed staying dovish
- 🚀 Longer-term (1-2 years), structural supply deficit and industrial demand story remain compelling
- ⚠️ Current levels require near-perfect execution of bull thesis - one stumble and we could see $70-75
If you're bearish:
- 🎯 Be PATIENT - fighting 148% momentum is dangerous
- 📊 First support at $85 (55.4B gamma), major support at $80 (69.2B gamma wall)
- ⚠️ Post-pullback put spreads offer defined-risk way to play downside
- 📉 Watch for break below $80 - that's the trigger for cascade to $75, then $70
- ⏰ Timing is EVERYTHING: Wait for technical confirmation before initiating bearish positions
Mark your calendar - Key dates:
- 📅 February 20, 2026 - Monthly OPEX (implied move range: $75.57 - $98.48)
- 📅 March 20, 2026 - Triple Witch (implied move range: $71.17 - $102.88)
- 📅 May 2026 - Fed Chair Powell's term expires
- 📅 September 18, 2026 - Expiration of this $7.5M put trade
- 📅 Ongoing - China export restriction policy monitoring
Final verdict: Silver's long-term structural story remains COMPELLING - China's export restrictions, fifth consecutive year of supply deficits, explosive industrial demand from solar/EVs, and gold-silver ratio normalization are all real tailwinds. BUT, after a 148% rally with RSI at 87 and ETF outflows beginning, the risk/reward is NO LONGER favorable for aggressive new positioning. The $7.5M institutional put buy is a CLEAR signal: smart money is derisking at the peak.
Be patient. Let the overbought conditions normalize. Look for better entry points at $75-80. The silver bull market will still be here in 2-3 months, and you'll sleep better at night buying the dip rather than chasing the rip.
This is a marathon, not a sprint. Protect your capital. 💪
Disclaimer: Options trading involves substantial risk of loss and is not suitable for all investors. This analysis is for educational purposes only and not financial advice. Past performance doesn't guarantee future results. The Z-score of 100.99 reflects this specific trade's unusualness relative to recent SLV history - it does not imply the trade will be profitable or that you should follow it. Always do your own research and consider consulting a licensed financial advisor before trading. Commodities like silver can be extremely volatile and gap significantly on geopolitical news. The put buyer may have complex portfolio hedging needs not applicable to retail traders.
About iShares Silver Trust: The iShares Silver Trust is an exchange-traded fund that provides investors direct exposure to physical silver bullion, with $49.73 billion in assets under management and holdings of over 516 million ounces of silver stored in vaults around the world.