🐋 SLV $16.6M Risk Reversal - Institutional Whale Bets Silver DOUBLES by July!
📅 January 28, 2026 | 🔥 Unusual Activity Detected
🎯 The Quick Take
Someone just put on a $16.6 MILLION risk reversal on SLV at 12:44:34 today! They sold 18,000 puts at the $65 strike ($5.6M collected) and simultaneously bought 18,000 calls at the $210 strike ($11M paid), both expiring July 17th. This is an extremely aggressive bullish bet -- the trader is saying they'd happily BUY silver at $65 (37% below current price) while positioning for SLV to reach $210 (103% above current). Translation: Smart money believes this silver rally is just getting started and could literally double from here by summer.
📊 ETF Overview
iShares Silver Trust (SLV) is the world's largest physical silver ETF, holding over 509 million ounces of silver in trust:
- Net Assets: ~$56.8 Billion
- Industry: Commodity Contracts Brokers & Dealers
- Current Price: $103.43 (near all-time high)
- Primary Business: Tracks the price of physical silver bullion, allowing investors exposure to silver without holding the metal directly
- Exchange: NYSE Arca
- Shares Outstanding: 573.3M
💰 The Option Flow Breakdown
The Tape (January 28, 2026 @ 12:44:34):
| Time | Symbol | Side | Buy/Sell | Type | Expiration | Premium | Strike | Volume | OI | Size | Spot | Option Price |
|---|---|---|---|---|---|---|---|---|---|---|---|---|
| 12:44:34 | SLV | MID | SELL | PUT $65 | 2026-07-17 | $5.6M | $65 | 18K | 1.4K | 18,000 | $103.43 | $3.10 |
| 12:44:34 | SLV | MID | BUY | CALL $210 | 2026-07-17 | $11M | $210 | 19K | 2K | 18,000 | $103.43 | $5.98 |
🤓 What This Actually Means
This is a RISK REVERSAL -- one of the most aggressive bullish structures in the options playbook. Here's the breakdown:
- 💸 Net cost: $5.4M net debit ($11M paid for calls minus $5.6M received from puts)
- 🐋 Selling the $65 put means the trader AGREES to buy 1.8 million shares of SLV at $65/share if silver crashes 37% by July -- that's a $117M commitment! They're so bullish they're willing to catch the falling knife at $65
- 🚀 Buying the $210 call gives them unlimited upside above $210 -- if SLV reaches $250, these calls pay $40/share x 18,000 contracts = $72M profit
- ⏰ 170 days to expiration through July 17th -- captures China export restriction impacts, multiple Fed meetings, and the full H1 2026 silver supply squeeze
- 📊 18,000 contracts = exposure on 1.8 million shares worth ~$186M at current prices
- 🏦 Execution at MID price on both legs with matched timing = sophisticated institutional desk, not retail
What's really happening here: This trader is essentially creating a synthetic long position on silver. By selling the $65 put they're financing the purchase of the $210 call. The put premium ($5.6M) pays for roughly half the call cost ($11M), making the net debit only $5.4M. Think of it this way: they're saying "I'll take on the risk of buying SLV at $65 in a crash scenario because I believe silver could DOUBLE from here." The $65 put strike sits right at where SLV started January -- so they view the entire YTD rally as a floor, not a ceiling.
Unusual Score: 🔥 EXTREME (Z-Score 30.14 on the put leg) - The put volume of 18,000 contracts dwarfs the 1,400 open interest by 12.8x. This kind of volume-to-OI ratio on a simultaneous two-leg structure is something you see maybe a few times a year in SLV options. This is NOT normal hedging -- this is a massive directional conviction trade.
📈 Technical Setup / Chart Check-Up
YTD Performance Chart
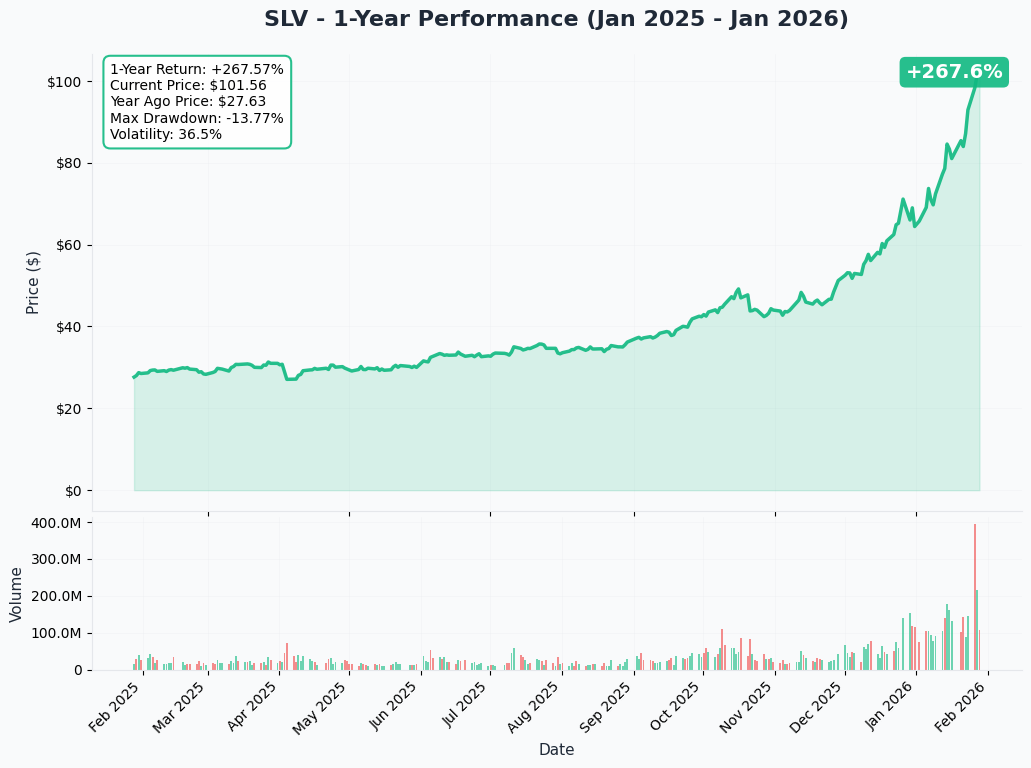
SLV is on an absolute tear -- up roughly +60% YTD with the current price around $103.43. Silver spot has surged to ~$116/oz, its highest level in history. The rally started in early January when China's silver export restrictions took effect, and it hasn't looked back.
Key observations:
- 🚀 Parabolic rally: SLV rocketed from ~$65-69 at the start of January to over $103 in just four weeks
- 📈 Record highs: Trading near all-time highs with silver at levels not seen since the Hunt Brothers squeeze in 1980
- 🎢 Extreme momentum: The strongest weekly gain since 1998 (18% in a single week) driven by the China supply shock
- 📊 Massive volume: $2.3B in net ETF inflows in 2025 followed by continued institutional accumulation into 2026
- ⚠️ Overextended territory: Silver is trading at 3.8x its 60-month moving average -- a level reached only 3 times since 1954
Gamma-Based Support & Resistance Analysis
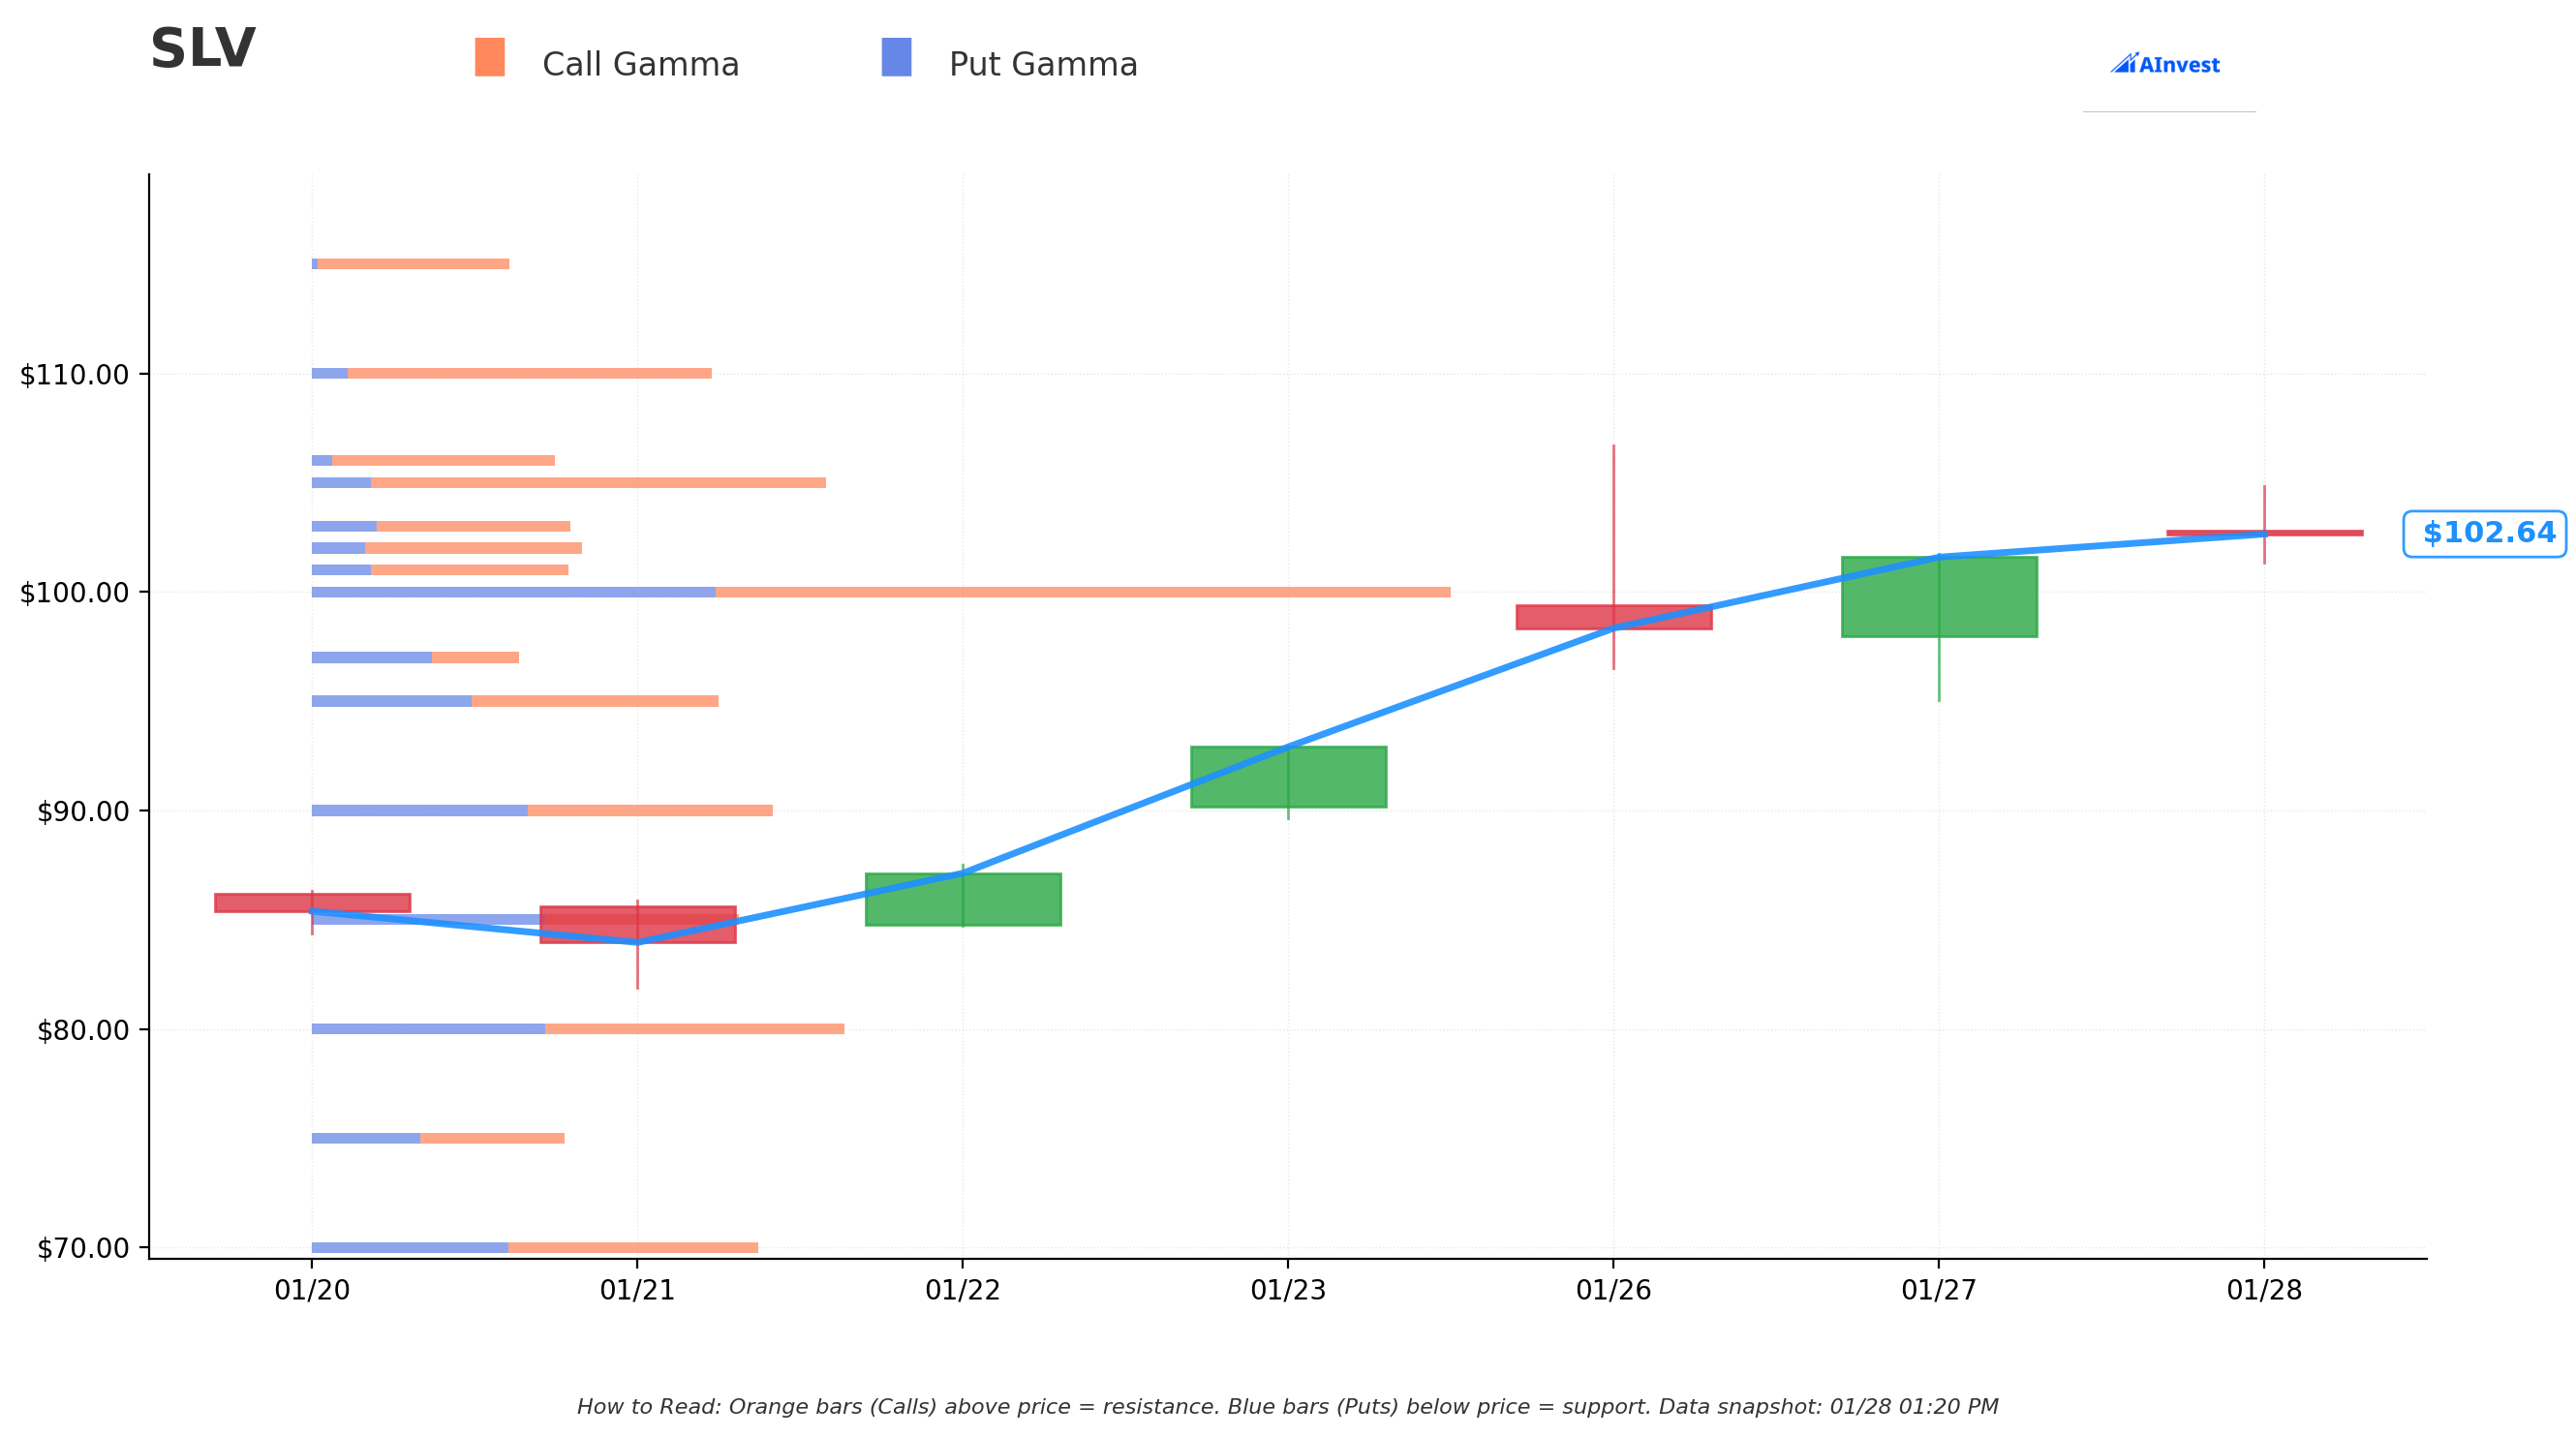
Current Price: $102.88
The gamma exposure map reveals critical price magnets and barriers governing near-term price action:
🔵 Support Levels (Put Gamma Below Price):
- $102 - Immediate support with 15.1B total gamma exposure (nearest floor, less than 1% below)
- $101 - Secondary support at 14.4B gamma (1.8% below current)
- $100 - MAJOR structural floor with 64.5B gamma (STRONGEST LEVEL ON THE BOARD -- this is the LINE IN THE SAND)
- $95 - Extended support at 23.0B gamma (7.7% below current)
- $90 - Deep support at 26.2B gamma (12.5% below -- where heavy put/call gamma collide)
- $85 - Disaster floor at 24.3B gamma (net gamma turns negative here -- bearish acceleration below this)
🟠 Resistance Levels (Call Gamma Above Price):
- $103 - Immediate ceiling with 14.5B gamma (just 0.1% above -- RIGHT at the price)
- $105 - STRONG resistance at 29.5B gamma (2.1% overhead -- dealers will sell into rallies here)
- $106 - Secondary resistance at 14.0B gamma (3% above)
- $110 - Major ceiling zone with 22.7B gamma (6.9% above current)
What this means for traders: SLV is sandwiched between massive $100 support (64.5B gamma -- by far the largest level) and strong $105 resistance (29.5B gamma). The $100 level is THE critical floor -- if silver holds above this psychologically important round number, the rally can continue. A break above $105 opens the door to $110 and beyond. But notice: the gamma concentrations thin out dramatically above $110, meaning price moves could accelerate in either direction once we leave this $100-$110 range.
Notice anything? The risk reversal trader put their downside strike at $65 -- way below even the deepest gamma support. They're not worried about normal pullbacks to $90 or $85. They're only concerned about a TOTAL collapse back to January 1st levels, and they'd happily buy more at that price. Meanwhile, their upside call at $210 is so far above the gamma map that it tells you they expect a move that would break all current technical frameworks.
Net GEX Bias: Bullish (439.1B call gamma vs 234.2B put gamma) - Overall positioning heavily favors upside continuation.
Implied Move Analysis
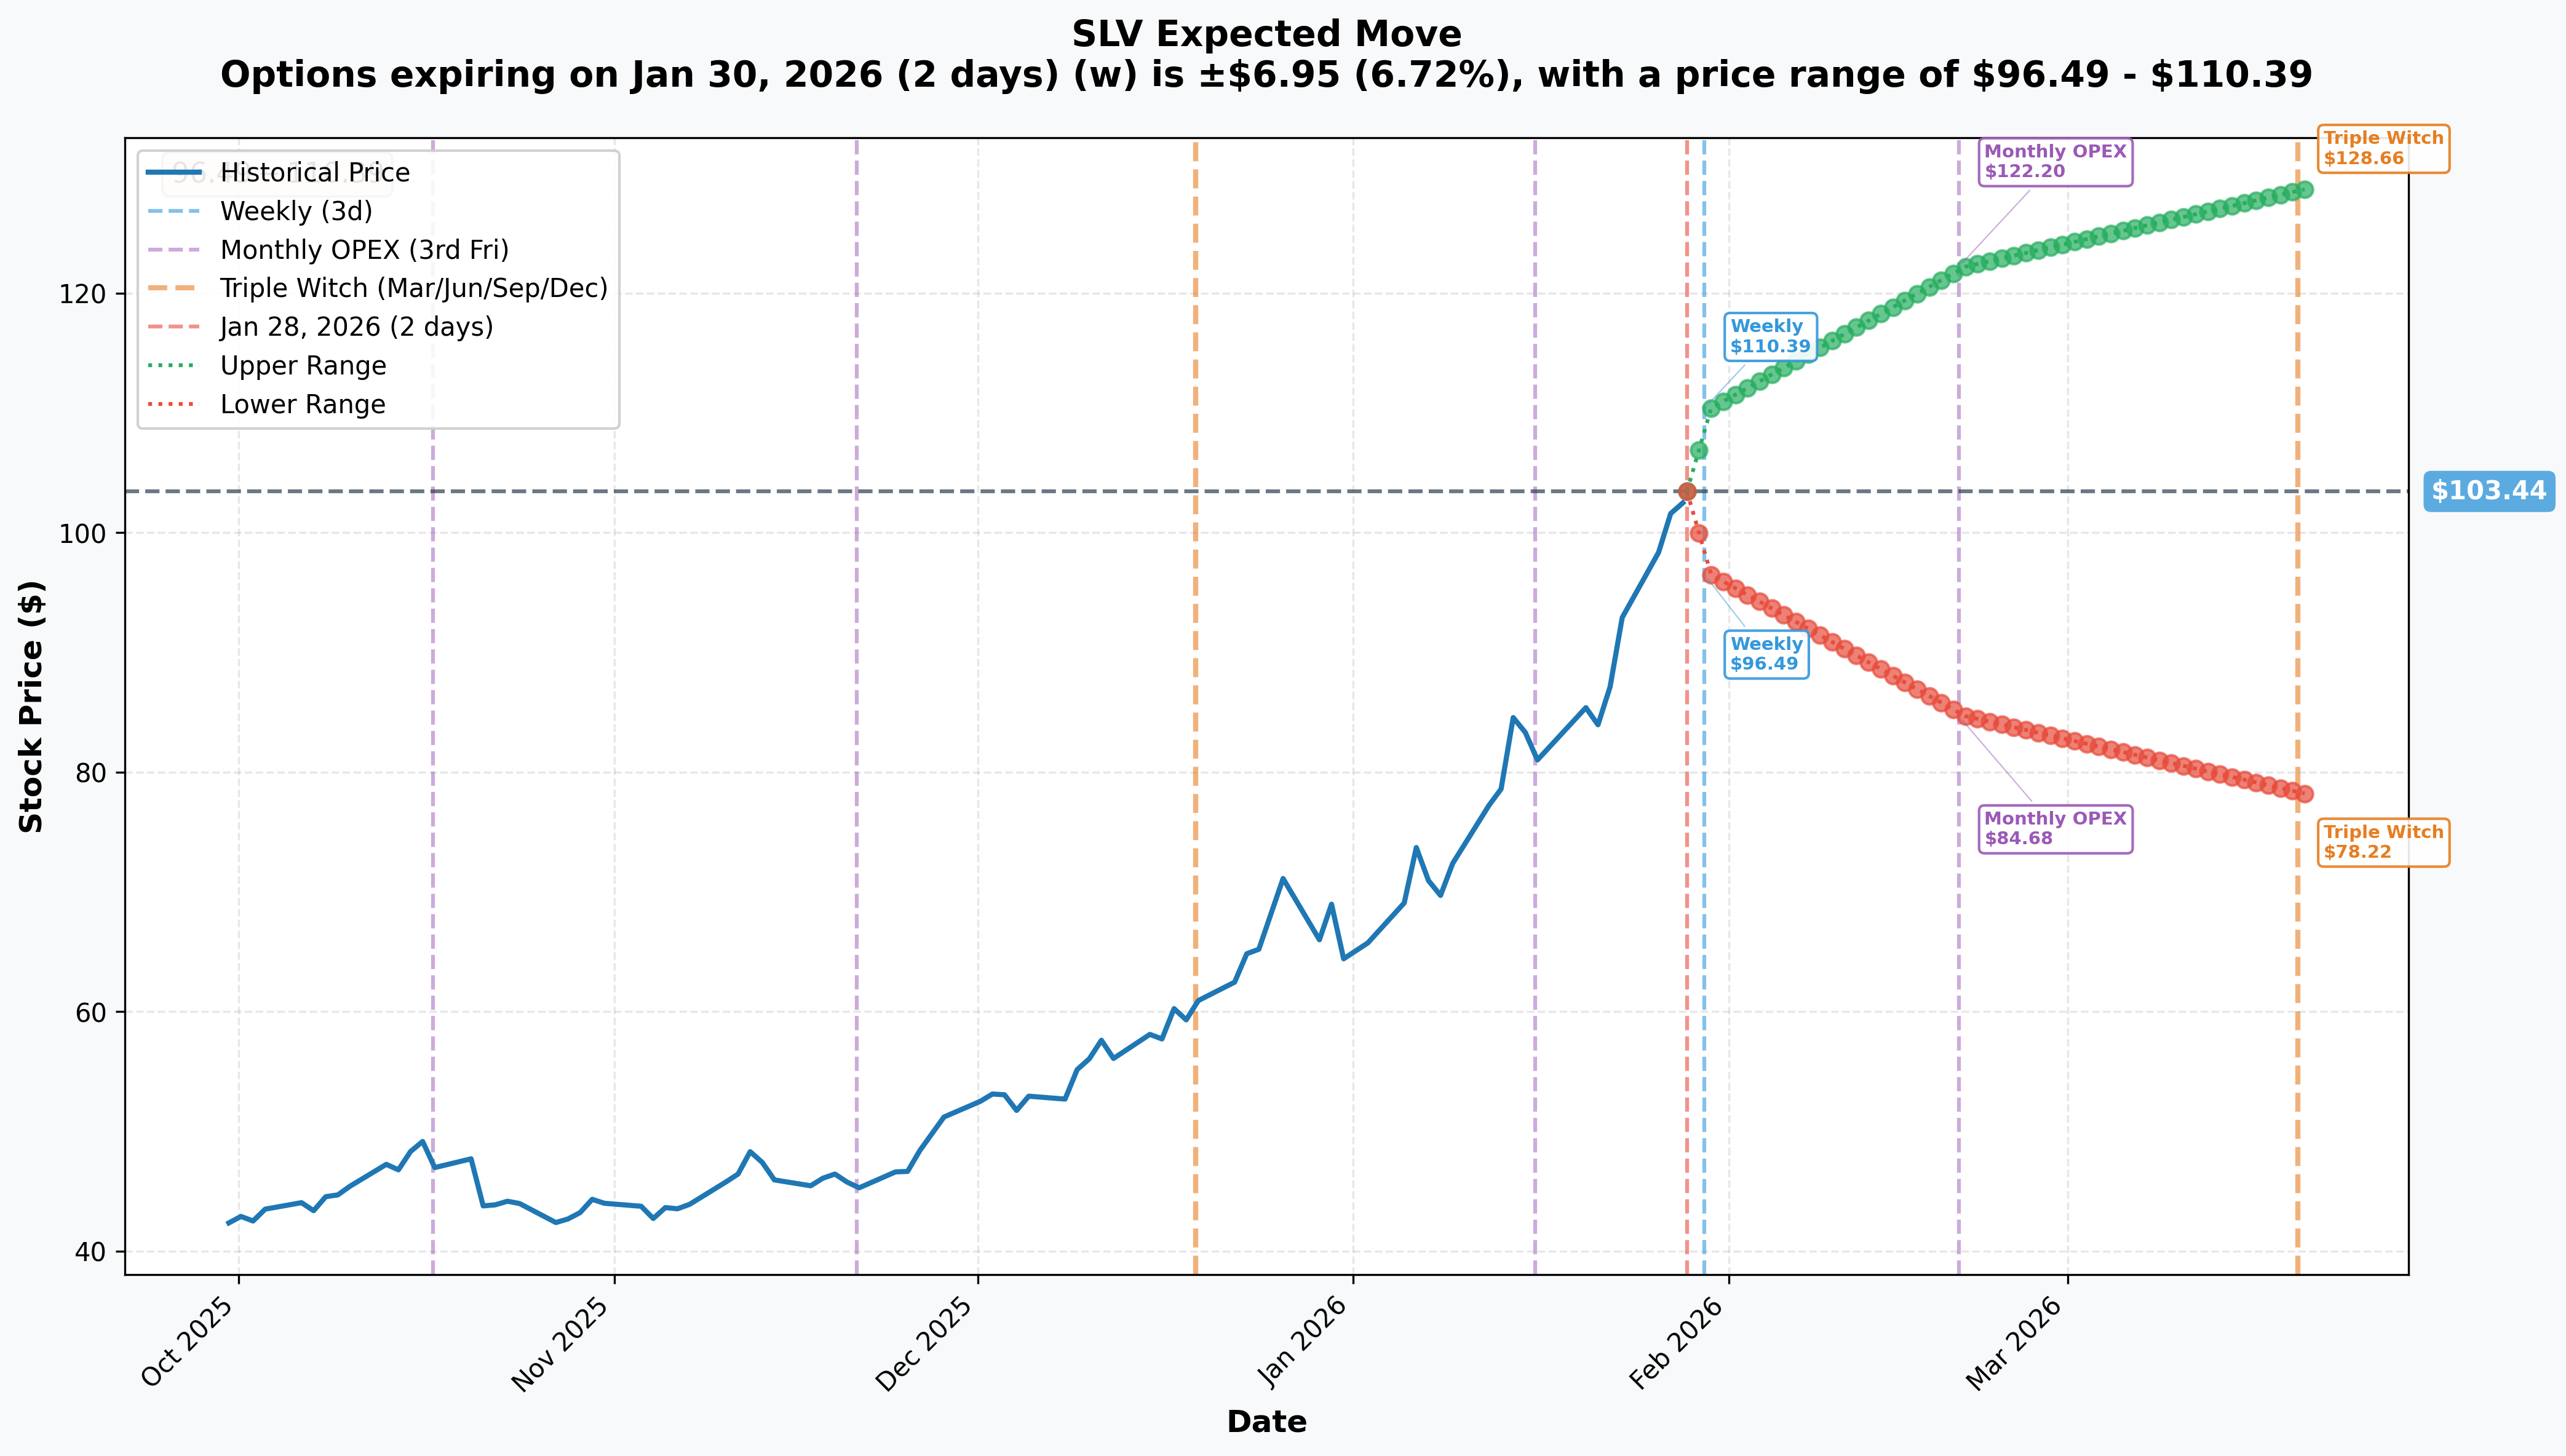
Options market pricing for upcoming expirations:
- 📅 Weekly (Jan 30 - 2 days): ±$6.95 (±6.7%) → Range: $96.49 - $110.39
- 📅 Monthly OPEX (Feb 20 - 23 days): ±$18.76 (±18.1%) → Range: $84.68 - $122.20
- 📅 Quarterly Triple Witch (Mar 20 - 51 days): ±$25.22 (±24.4%) → Range: $78.22 - $128.66
Translation for regular folks: Options traders are pricing in a 6.7% move ($7) by this Friday alone -- that's MASSIVE for a 2-day window and reflects extreme uncertainty around today's Fed rate decision. The monthly OPEX implies an 18% swing in just 3 weeks, and by the March triple witch, the market is pricing a nearly 25% move in either direction.
To put the risk reversal in context: the $65 put strike sits 37% below current price -- well beyond even the quarterly implied move lower range of $78.22. The trader is selling a put that's EXTREMELY far out of the money, collecting premium on a scenario the market considers highly unlikely. Meanwhile, the $210 call strike at 103% above current price sits far beyond the quarterly upper range of $128.66 -- but with 170 days to expiration (vs 51 for the triple witch), the math changes dramatically if this parabolic trend continues.
Key insight: Implied volatility on SLV is at EXTREME levels. A 6.7% weekly implied move and 18% monthly move reflect a market that expects silver to remain wildly volatile. This environment favors premium sellers on far OTM puts (exactly what this trader is doing) while also making speculative calls cheaper relative to their potential payout if the parabolic move continues.
🎪 Catalysts
🔥 Immediate Catalysts (Next 7 Days)
Federal Reserve Rate Decision - January 28-29 (TODAY!) 🏛️
The Fed is widely expected to hold rates at 3.50-3.75% at today's meeting. Key dynamics:
- 📊 Rate hold expected: Markets pricing near-certainty of no change, but Chair Powell's press conference could signal timing of next cut
- 🕊️ Dovish 2026 roster: FOMC composition shifted to 6 dovish, 4 neutral, 2 hawkish voters -- favors future cuts
- 💰 Silver sensitivity: Each 25 bps cut reduces opportunity cost of holding non-yielding silver, directly supportive of SLV
- ⚠️ Risk: Any hawkish surprise (pushing back on rate cut timeline) could trigger near-term selling in precious metals
China Silver Export Restriction Data (Ongoing Q1 2026) 🇨🇳
The full impact of China's January 1 export restrictions is still unfolding:
- 🚨 China controls 60-70% of world refined silver supply -- only large state-approved companies can now export
- 📊 Analysts project a potential 5,000+ metric ton annual supply gap if exports drop 50%
- 🏭 Chinese silver funds already suspended trading after premiums surged above NAV -- signal of intense domestic demand
- 📅 Q1 2026 trade data will provide first hard evidence of the export drop magnitude
🚀 Near-Term Catalysts (Q1-Q2 2026)
Fifth Consecutive Supply Deficit (2025 Confirmed, 2026 Expected) ⛏️
The silver market is in a structural supply crisis with 820 million ounces of cumulative deficit over 2021-2025:
- 📉 Global demand (~1.24B ounces) dramatically exceeds supply (~1.01B ounces)
- 🏭 Mine production peaked in 2016 at ~900M ounces, declined to ~813-835M ounces in 2025
- 🔋 71% of silver comes as a by-product of other metal mining -- supply can't ramp quickly
- 📅 Silver Institute's World Silver Survey (expected April-May 2026) will provide definitive 2025 deficit figures
Record Industrial Demand: Solar, EV, AI 🌞
Industrial silver consumption reached 680.5 million ounces in 2024 and continues accelerating:
- ☀️ Solar PV: 197.6M ounces consumed in 2024 (19% of global demand vs 5% a decade ago). Advanced TOPCon cells require 50% more silver per panel
- 🚗 Electric Vehicles: Each EV uses 25-50 grams of silver (67-79% more than ICE vehicles) -- EVs expected to overtake ICE as primary auto silver source by 2027
- 🤖 AI/Data Centers: Global IT power capacity grew 53x from 2000 to 2025; silver critical for semiconductors, power electronics, and smart grids
Fed Chair Transition (May 2026) 🏛️
Jerome Powell's leadership term ends May 2026. The Trump administration is expected to nominate a new chair (Kevin Hassett is frontrunner) who would likely advocate for lower rates -- directly bullish for precious metals.
Gold-Silver Ratio Compression (Ongoing) ⚖️
The gold-silver ratio has plummeted below 50:1 for the first time since 2011, down from ~90:1 in April 2025. With gold above $5,100/oz, BMO warns the ratio "could be nearing a historic bottom" -- suggesting silver still has room to outperform gold.
⚠️ Risk Catalysts (Negative)
HSBC "Fundamentally Overvalued" Warning 📉
HSBC's James Steel has flagged silver as "fundamentally overvalued", warning that the rally is driven more by physical market tightness and speculation than sustainable fundamentals:
- 📊 HSBC's average 2026 forecast: just $68.25/oz (vs current $116) -- implies 41% downside
- ⛏️ Mine supply projected to increase to 824M ounces (+1.4%) and recycling to surge to 206M ounces at current high prices
- 🔧 London market tightness and backwardation "may not be resolved until later in 2026" but once resolved, prices could fall sharply
Demand Destruction at $100+ Silver 🏭
- 🔬 Industrial substitution and silver thrifting (reducing silver per solar cell) accelerate at these price levels
- 💍 Jewelry demand "especially vulnerable" to high prices
- 📉 HSBC forecasts industrial demand declining slightly from 665M to 660M ounces in 2026
🎲 Price Targets & Probabilities
Using gamma levels, implied move data, China supply dynamics, and analyst forecasts, here are the scenarios through the July 17th risk reversal expiration:
📈 Bull Case (30% probability)
Target: $150-$210+
How we get there:
- 🇨🇳 China export data confirms 50%+ drop in silver exports, creating acute global shortage
- 🏛️ Fed cuts rates 2-3 times by July, with new dovish Fed chair accelerating the timeline
- 📊 Silver Institute survey (April-May) reveals 2025 deficit exceeded 200M ounces, panic buying ensues
- 📈 Gold pushes past $5,500 and gold-silver ratio compresses further below 40:1
- ☀️ Solar PV installations accelerate in H1 2026, adding 100M+ ounces of incremental demand
- 🚀 Breakout above $110 gamma resistance triggers momentum cascade with thin gamma above that level
- 💰 Bank of America's $135-$309/oz range comes into play
Risk reversal P&L in bull case:
- SLV at $150: $65 puts expire worthless (keep $5.6M), $210 calls still OTM = net profit $0.2M (put premium minus call cost)
- SLV at $210: $65 puts worthless, $210 calls at-the-money = roughly breakeven on calls, profit on puts
- SLV at $250: $65 puts worthless, $210 calls worth $40 x 18,000 = $72M profit, total gain ~$67M
Probability assessment: 30% because it requires the China supply shock to intensify AND multiple rate cuts AND continued industrial demand acceleration. The parabolic nature of the move makes continuation more likely than normal, but the 3.8x moving average overextension creates headwinds.
🎯 Base Case (45% probability)
Target: $85-$130 range (VOLATILE CONSOLIDATION)
Most likely scenario:
- ✅ Silver corrects from parabolic overextension but finds support from ongoing supply deficit
- 📊 Fed holds rates, provides cautious commentary -- neither bullish nor bearish catalyst
- 🇨🇳 China export impacts priced in after initial data release, volatility decreases
- ⛏️ Recycling and mine supply modestly increase, narrowing deficit
- 🔄 SLV oscillates between $100 gamma support and $110 resistance, with periodic breakouts and pullbacks
- 💤 Implied volatility gradually declines from extreme levels as the supply picture clarifies
Risk reversal P&L in base case:
- SLV stays $85-$130: Both legs likely expire worthless or near-worthless. Net loss = $5.4M (the net debit paid)
- The trader treats this as cost of doing business -- the "insurance" cost of being positioned for the tail event
Why 45% probability: After a 60% YTD rally in 4 weeks, mean reversion is statistically probable. However, the structural supply deficit provides a floor. The most likely outcome is a wide trading range as the market digests the move and waits for hard data on China exports and Fed policy.
📉 Bear Case (25% probability)
Target: $60-$85 (CORRECTION FROM PARABOLIC HIGHS)
What could go wrong:
- 😰 HSBC's overvaluation thesis plays out as supply tightness eases in H2 2026
- 🇨🇳 China relaxes export restrictions (reversal or modification of January 1 policy)
- 💵 Dollar strengthens on hawkish Fed surprise or geopolitical safe-haven flows
- 🏭 Demand destruction accelerates as manufacturers fast-track silver substitution at $100+ prices
- 📉 SLV outflows accelerate -- already seeing -$494M in 5-day outflows even at highs
- 🔨 Break below $100 gamma support (64.5B -- the MASSIVE level) triggers cascade through $95, $90
- 📊 Historical precedent: silver crashed from $50 to $10 after the 2011 parabolic spike
Risk reversal P&L in bear case:
- SLV at $85: $65 put worth ~$0 (still OTM), $210 call worthless = loss of $5.4M net debit
- SLV at $65: $65 put at-the-money, trader is ASSIGNED and buys 1.8M shares at $65 = $117M commitment, $210 call worthless
- SLV at $50: $65 put worth $15/share, trader loses $15 x 18,000 = $27M on put PLUS $5.4M call cost = $32.4M loss AND owns 1.8M shares at $65 with $15/share underwater
Critical support levels:
- 🛡️ $100: Massive gamma floor (64.5B) -- MUST HOLD or momentum shifts bearish
- 🛡️ $90-$95: Extended gamma support zone (~23-26B each)
- 🛡️ $85: Net gamma turns negative below here -- bearish acceleration kicks in
- 🛡️ $65: The put strike -- trader's "line in the sand" where they'd buy the dip
Probability assessment: 25% because it requires multiple bearish catalysts to align (China policy reversal + Fed hawkishness + demand destruction). The structural supply deficit provides a meaningful floor, but the parabolic overextension at 3.8x the 60-month moving average is historically associated with cyclical peaks.
💡 Trading Ideas
🛡️ Conservative: Wait for the Pullback to $95-$100
Play: Stay on the sidelines and set alerts at the $100 and $95 gamma support levels
Why this works:
- ⏰ SLV is up 60% in 4 WEEKS -- chasing parabolic moves is how retail accounts get destroyed
- 📊 Silver at 3.8x its 60-month moving average has only happened 3 times since 1954 -- not a great entry point
- 💸 Implied volatility at 50%+ makes options EXTREMELY expensive right now
- 🏛️ Fed decision TODAY creates binary event risk -- wait for clarity
- 📉 Already seeing $494M in 5-day ETF outflows -- institutional profit-taking underway
- 🎯 $100 with 64.5B gamma provides a natural entry zone with structural support
Action plan:
- 👀 Watch Fed decision today for tone on rate cuts -- dovish = silver stays elevated, hawkish = pullback opportunity
- 🎯 Set buy alerts at $100 (3% pullback), $95 (8% pullback), and $90 (12.5% pullback)
- ✅ If silver pulls back to $95-$100 on normal correction (not structural breakdown), enter with stock or call options
- 📊 Confirm supply deficit thesis with Silver Institute data (April-May) before sizing up
- ⏰ Patience pays -- parabolic moves ALWAYS have pullbacks, and buying dips in a structural bull market is the sweet spot
Risk level: Minimal (cash position) | Skill level: Beginner-friendly
⚖️ Balanced: Sell Cash-Secured Puts at $90 (Copy the Whale's Thesis at Better Odds)
Play: Sell cash-secured puts at the $90 strike, March 20 expiration
Structure: Sell $90 puts (March 20 expiration)
Why this works:
- 🐋 Mirrors the whale's thesis: willing to BUY SLV at lower prices while collecting premium
- 📊 $90 sits at 26.2B gamma support (12.5% below current) -- strong structural floor
- 💰 Collect premium in extreme IV environment -- high volatility means FAT premiums on far OTM puts
- 🛡️ Even if assigned at $90, you're buying silver at 2025 levels with a structural supply deficit tailwind
- ⏰ March 20 expiration (51 days) captures enough time decay to profit while limiting exposure
- 📈 Options market implies $78.22 lower range by March -- selling $90 puts means you're below the implied range with room to spare
Estimated P&L (adjust for current premium):
- 💰 Premium collected: ~$3-5 per contract depending on IV at entry
- 📈 Max profit: Keep full premium if SLV above $90 at March 20 expiration
- 📉 Assignment scenario: Buy SLV at $90 minus premium = effective cost basis ~$85-87
- 🎯 Breakeven: ~$85-87 (17-18% below current price -- requires a massive crash to lose money)
- 📊 Probability of profit: ~80%+ given current gamma support and supply dynamics
Position sizing: Requires $9,000 cash per contract. Risk 5-10% of portfolio maximum.
Risk level: Moderate (defined risk, premium collection with upside on assignment) | Skill level: Intermediate
🚀 Aggressive: Mini Risk Reversal (Replicate the Whale's Structure, Smaller Size)
Play: Risk reversal mirroring the institutional trade at retail-friendly size
Structure: Sell 10x $85 puts / Buy 10x $130 calls (July 17 expiration -- SAME as the whale)
Why this could work:
- 🐋 Follows the institutional flow -- when $16.6M shows up at the door, you pay attention
- 📊 $85 put strike sits at 24.3B gamma support (17.4% below) -- stronger foundation than the whale's $65
- 🚀 $130 call strike more achievable than $210 -- requires "only" 26% rally vs the whale's 103%
- 💰 Put premium partially finances the call purchase, reducing net cost
- ⏰ 170 days to July captures all major catalysts: China data, Fed cuts, Silver Institute survey, Fed chair transition
- 📈 Bank of America targets $135-$309/oz -- your $130 call would be well in the money in the bull scenario
Why this could blow up (SERIOUS RISKS):
- 💸 Put assignment risk: If silver crashes to $85, you're on the hook for $85,000 per contract x 10 = $850K commitment
- 🎢 Parabolic correction risk: Silver dropped from $50 to $10 after 2011 -- it CAN happen again
- 😱 Unlimited downside on puts: If SLV goes to $50, you lose $35/share x 10 contracts x 100 = $35,000
- 📊 Both legs could lose: In base case ($85-$130 range), you might lose premium on calls while puts approach assignment zone
- ⚠️ Margin requirements: Naked put writing requires significant margin -- make sure your broker allows it
Estimated P&L:
- 💰 Net cost: ~$2-4 net debit per spread (call cost minus put premium received)
- 📈 Home run scenario (SLV at $150): Calls worth $20/share x 10 = $20,000 profit
- 📉 Disaster scenario (SLV at $65): Put loss $20/share x 10 = $20,000 loss + call loss
- 🎯 Need SLV above ~$132-134 for meaningful call profit or below $83-81 for put assignment loss
CRITICAL WARNING - DO NOT attempt unless you:
- ✅ Understand margin requirements for naked/cash-secured put writing
- ✅ Can afford to be assigned on 10 contracts ($85,000 capital required AT MINIMUM)
- ✅ Have traded risk reversals or synthetic positions before
- ✅ Accept that you're copying an institutional trade that has VERY different risk tolerance than retail
- ✅ Can monitor the position and close if thesis breaks (silver below $90 gamma support)
Risk level: HIGH (unlimited downside on puts, large capital commitment) | Skill level: Advanced only
⚠️ Risk Factors
Don't get caught by these potential landmines:
-
🎢 Parabolic overextension at historic levels: Silver is trading at 3.8x its 60-month moving average -- a level reached only 3 times since 1954. The 60% rally in January alone and 274% YoY gain are NOT sustainable. Parabolic moves eventually correct, and when they do, silver can fall 30-50% in weeks. The Hunt Brothers squeeze of 1980 saw silver crash from $50 to $10. History doesn't repeat, but it rhymes.
-
📊 HSBC "fundamentally overvalued" call: HSBC forecasts silver averaging just $68.25/oz in 2026 vs current $116 -- implying 41% downside. They argue the rally is driven by physical market tightness and speculation, not sustainable fundamentals. When a major bank's average price target is 41% below spot, you need to take it seriously.
-
🇨🇳 China policy reversal risk: China's silver export restrictions are the single biggest driver of this rally. If China reverses, modifies, or relaxes these restrictions for ANY reason (domestic economic weakness, trade negotiations, diplomatic pressure), the supply shock thesis evaporates overnight. This is a policy-driven rally with policy-reversal risk.
-
🏛️ Federal Reserve hawkish surprise: Today's Fed meeting could change everything. If the Fed signals slower rate cuts due to persistent inflation, or pushes back against market expectations of 1-3 cuts in 2026, silver faces immediate headwinds. A stronger dollar from hawkish policy would pressure silver prices directly.
-
💵 US dollar reversal: The current rally is partly fueled by dollar weakness and Trump's "unconcerned about the dollar's drop" stance. Any reversal in dollar policy -- trade deal resolution, geopolitical flight to safety, or hawkish Fed -- could push silver back to the $60-$70 range according to bearish scenarios.
-
🏭 Demand destruction already underway: At $100+ per ounce, industrial users are actively thrifting and substituting. Solar manufacturers investing in silver reduction technology. HSBC forecasts industrial demand declining from 665M to 660M ounces. High prices sow the seeds of their own reversal by incentivizing substitution and recycling.
-
📉 ETF outflows signal institutional profit-taking: Despite record prices, SLV experienced -$494M in 5-day net outflows. When institutions are selling into strength while retail chases the rally, it's a classic distribution pattern. Smart money may be rotating out while retail FOMO drives the last leg higher.
-
🐋 Risk reversal has MASSIVE assignment risk: This is NOT a simple directional bet. The $65 put obligation means the trader MUST buy 1.8 million shares at $65 ($117M commitment) if silver crashes. In a 2011-style collapse, that's catastrophic. The institutional trader likely has the capital and portfolio context to absorb this -- retail traders copying this trade at scale do NOT.
-
⛏️ Supply response accelerating: Mine supply projected to increase to 824M ounces and recycling to surge to 206M ounces due to record prices. The supply deficit that powered this rally could narrow from ~230M ounces (2025) to ~140M ounces (2026), removing a key pillar of the bull thesis.
-
🌍 Macro recession could crush industrial demand: Silver is 59% industrial metal. A global manufacturing recession would slash industrial consumption of 680M+ ounces while investment demand alone can't sustain these price levels. Trade war escalation could damage the solar/EV supply chain, further reducing silver consumption.
🎯 The Bottom Line
Real talk: Someone just structured a $16.6M risk reversal on SLV that's essentially saying "I'm so bullish on silver that I'll agree to buy $117M worth at $65 if it crashes, and in exchange, I want to capture unlimited upside above $210." This is extreme conviction from institutional money riding the biggest silver supply squeeze in decades.
What this trade tells us:
- 🎯 This trader has a 6-month time horizon (July 17th) and expects the China export restriction supply shock to intensify, NOT fade
- 💰 They view the January starting price (~$65) as a generational floor -- they'd happily buy MORE at that level
- 🚀 The $210 call strike implies they think silver could reach $210+ per share (equivalent to ~$230/oz silver) by summer -- Bank of America's most bullish forecast is $309/oz
- ⚖️ The risk reversal structure (using put premium to finance calls) shows capital efficiency -- this is professional money management
- 📊 Timing on the day of the Fed meeting suggests they're positioned THROUGH the rate decision, not reacting to it
This is a "silver supercycle" bet, not a short-term trade.
If you're bullish on silver:
- ✅ Do NOT chase at $103 after a 60% rally in 4 weeks -- wait for pullback to $95-$100 gamma support
- 📊 Size conservatively -- silver can move 7% in a DAY right now (implied weekly move is 6.7%)
- 🎯 Consider selling far OTM puts to mimic the whale's strategy at smaller scale, collecting premium in this high-IV environment
- 🛡️ Set MENTAL STOP at $90 (26.2B gamma support) -- if silver breaks this, the character of the rally changes
- ⏰ Watch April-May Silver Institute data for confirmation of supply deficit thesis
If you're watching from the sidelines:
- ⏰ Today's Fed decision could trigger a 5-7% move in either direction -- wait for the dust to settle
- 🎯 Best entry: pullback to $95-$100 zone where 23-64B gamma support provides a structural floor
- 📈 The structural bull case (supply deficit, China restrictions, industrial demand) is REAL, but the PRICE has front-run the fundamentals
- 🤔 Ask yourself: "Would I buy silver at $116/oz when HSBC says fair value is $68?" If that makes you uncomfortable, wait for better prices
- 📊 Watch ETF flows -- if outflows accelerate from current -$494M/week, institutions are heading for the exits
If you're bearish:
- 🎯 Do NOT short silver into a parabolic rally -- that's how accounts blow up
- 📊 First support at $100 (64.5B gamma), then $90-$95 zone, disaster floor at $85
- ⚠️ Wait for a clear break below $100 before initiating bearish positions -- gamma support is MASSIVE there
- 📉 Bear put spreads ($100/$90 or $95/$85 for March expiration) offer defined-risk downside plays after breakdown confirmation
- ⏰ HSBC's thesis may take until H2 2026 to play out -- don't fight the trend prematurely
Mark your calendar - Key dates:
- 📅 January 28-29 (TODAY) - Fed rate decision and press conference
- 📅 January 30 (Friday) - Weekly OPEX (±6.7% implied move)
- 📅 February 20 - Monthly OPEX (±18.1% implied move)
- 📅 March 2026 - Next FOMC meeting, potential dovish shift
- 📅 March 20 - Quarterly triple witch (±24.4% implied move)
- 📅 April-May 2026 - Silver Institute World Silver Survey release (definitive 2025 deficit data)
- 📅 May 2026 - Fed Chair Powell leadership term ends
- 📅 June 2026 - FOMC meeting, most likely timing for next rate cut
- 📅 July 17, 2026 - Expiration of this $16.6M risk reversal trade
Final verdict: The silver supply squeeze is REAL -- fifth consecutive year of deficit, China choking off 60-70% of refined exports, record industrial demand from solar/EV/AI, and a weakening dollar with rate cuts ahead. The $16.6M risk reversal confirms institutional conviction. BUT, silver is up 274% in 12 months and trading at levels last seen during the 1980 mania. HSBC says it's overvalued, ETF outflows are starting, and the parabolic shape of this chart screams "correction coming before continuation."
The right move: Be patient. Let the Fed decision pass. Wait for a pullback to $95-$100 gamma support. The supply deficit will still be here next month, and you'll sleep better buying at $95 than at $103 after a 60% monthly rally.
Protect your capital first. Silver isn't going anywhere -- the supply deficit is structural. But the PRICE can absolutely go lower before it goes higher.
Disclaimer: Options trading involves substantial risk of loss and is not suitable for all investors. This analysis is for educational purposes only and not financial advice. Past performance doesn't guarantee future results. Silver is an extremely volatile commodity that can move 5-10% in a single session. The risk reversal strategy described involves potential assignment risk of $117M for the institutional trader -- retail traders should NOT replicate this trade at similar scale. Selling naked puts creates unlimited downside risk. Always do your own research and consider consulting a licensed financial advisor before trading. The Z-Score of 30.14 reflects this specific trade's unusual size relative to recent SLV history -- it does not imply the trade will be profitable or that you should follow it.
About iShares Silver Trust: The iShares Silver Trust (SLV) is the world's largest physical silver ETF, holding approximately 509.5 million ounces of silver bullion in trust. Listed on NYSE Arca, it provides investors with direct exposure to silver price movements without the complexities of storing physical metal, with net assets of approximately $56.8 billion in the Commodity Contracts Brokers & Dealers category.