🔥 SMH: $34M Bearish Bet on Semiconductors - Smart Money Sells the Rally!
📅 December 9, 2025 | 🐋 Institutional Activity Detected
🎯 The Quick Take
A massive $34.1 million short call spread just hit the tape in SMH, with institutions selling 16,679 call spreads expiring March 20, 2026. This bearish play suggests big money is betting semiconductor stocks have run too far too fast, despite the sector's explosive AI-driven rally. With SMH trading near all-time highs at $367.25 and the VanEck Semiconductor ETF up 52.19% year-to-date, this is institutions taking profits and limiting upside.
📊 ETF Overview
SMH - VanEck Semiconductor ETF tracks the MVIS US Listed Semiconductor 25 Index, providing exposure to companies involved in semiconductor production and equipment. The ETF represents the backbone of the AI revolution with $37.4 billion in total net assets.
Key Details:
- Current Price: $368.57 (as of December 9, 2025)
- Assets Under Management: $37.4B
- YTD Performance: +52.19%
- Expense Ratio: 0.35%
- P/E Ratio: 44.80
- 52-Week Range: $170.11 - $372.78
Top 10 Holdings (74.52% of assets):
| Company | Ticker | Weight | Recent Performance |
|---|---|---|---|
| NVIDIA | NVDA | 17.12% | Blackwell GPU rollout driving data center demand |
| Taiwan Semiconductor | TSM | 9.32% | Record Q4 2024 revenue, 3nm/5nm at >100% utilization |
| Broadcom | AVGO | 8.53% | Q4 earnings Dec 11, AI revenue +66% YoY |
| Applied Materials | AMAT | 6.14% | Equipment demand surge from fab expansion |
| Micron Technology | MU | 6.03% | Q1 FY2025 revenue $8.71B (+84% YoY) |
| ASML Holding | ASML | 5.80% | 30% EUV growth guidance for 2025 |
| Intel | INTC | 5.74% | Arrow Lake CPU launch at CES 2025 |
| AMD | AMD | 5.61% | MI325X GPU competing with NVIDIA |
| Lam Research | LRCX | 5.45% | Strong equipment orders, gate-all-around tech |
| KLA Corp | KLAC | 4.78% | Advanced node inspection demand |
💰 The Option Flow Breakdown
📊 What Just Happened
Here's the exact institutional activity that triggered our alert:
| Date | Time | Symbol | Buy/Sell | Call/Put | Expiration | Strike | Premium | Volume | OI | Spot Price | Option Price |
|---|---|---|---|---|---|---|---|---|---|---|---|
| 2025-12-09 | 10:23:14 | SMH | SELL | CALL | 2026-03-20 | $390 | $29.0M | 17,000 | 18,000 | $367.25 | $17.46 |
| 2025-12-09 | 10:23:14 | SMH | SELL | CALL | 2026-03-20 | $460 | $5.1M | 17,000 | 17,000 | $367.25 | $3.06 |
Strategy Classification: Custom Spread (Short Call Spread) Total Premium Collected: $34.1 million Confidence Level: MEDIUM Z-Score: 10.39 and 18.64 (EXTREMELY UNUSUAL)
🤓 What This Actually Means
Real talk: Someone just sold 16,679 call spreads in a single block trade. Let me break this down:
The Position:
- Sold 390 strike calls: Collected $29M in premium ($17.46 per contract)
- Bought 460 strike calls: Paid $5.1M as protection ($3.06 per contract)
- Net premium collected: $23.9M ($14.40 per spread)
Translation for regular folks:
This is a bearish-to-neutral bet with a sophisticated twist. The institution is betting that SMH won't rally above $390 by March 20, 2026 (101 days from now). That's only 6.2% higher from the current price of $367.25.
Think about this: SMH is up 52% year-to-date, but this trader is saying "we're done here - time to cap our upside and collect premium." The $460 strike acts as a safety net, capping maximum loss at $70 per share ($46.60 net after premium collected).
Why this is unusual:
- Z-scores of 10.39 and 18.64 = This is extremely rare activity, happening only a few times per year
- Volume equals open interest: This was NOT existing positions being closed - this is fresh institutional positioning
- Both legs traded simultaneously: This wasn't retail piecing together a spread - this is institutional precision
📈 Technical Setup / Chart Check-Up
YTD Performance - The Context for This Trade
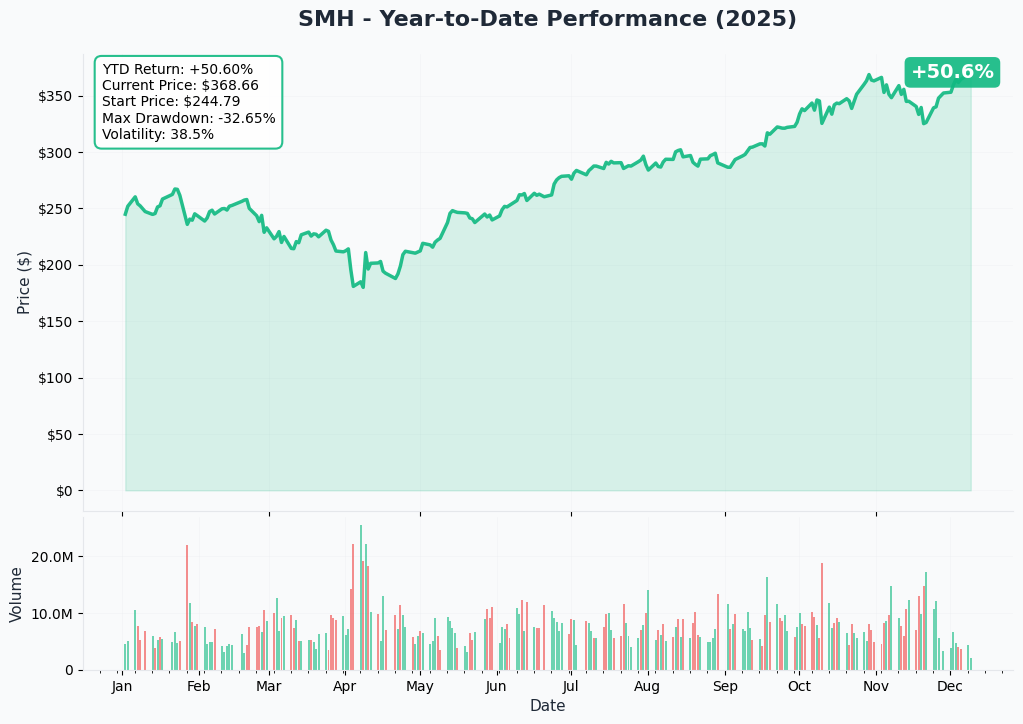
SMH has been on an absolute tear in 2025, rallying from $234 in early January to the current $368.57. The chart tells the story of the AI semiconductor boom:
- Q1 2025: Steady climb from $234 to $270 (+15%) as NVIDIA Blackwell production ramps
- Q2 2025: Explosive breakout to $330 (+35% total) on HBM shortage news and memory price surge
- Q3 2025: Consolidation around $300-320 as market digests gains
- Q4 2025: Final surge to all-time highs at $372.78 on TSMC record revenue
Key observation: The ETF is trading at the upper end of its 52-week range with minimal pullbacks. This parabolic move is exactly when institutions start hedging or taking profits - which is what we're seeing in today's option flow.
🔵 Gamma-Based Support & Resistance Analysis
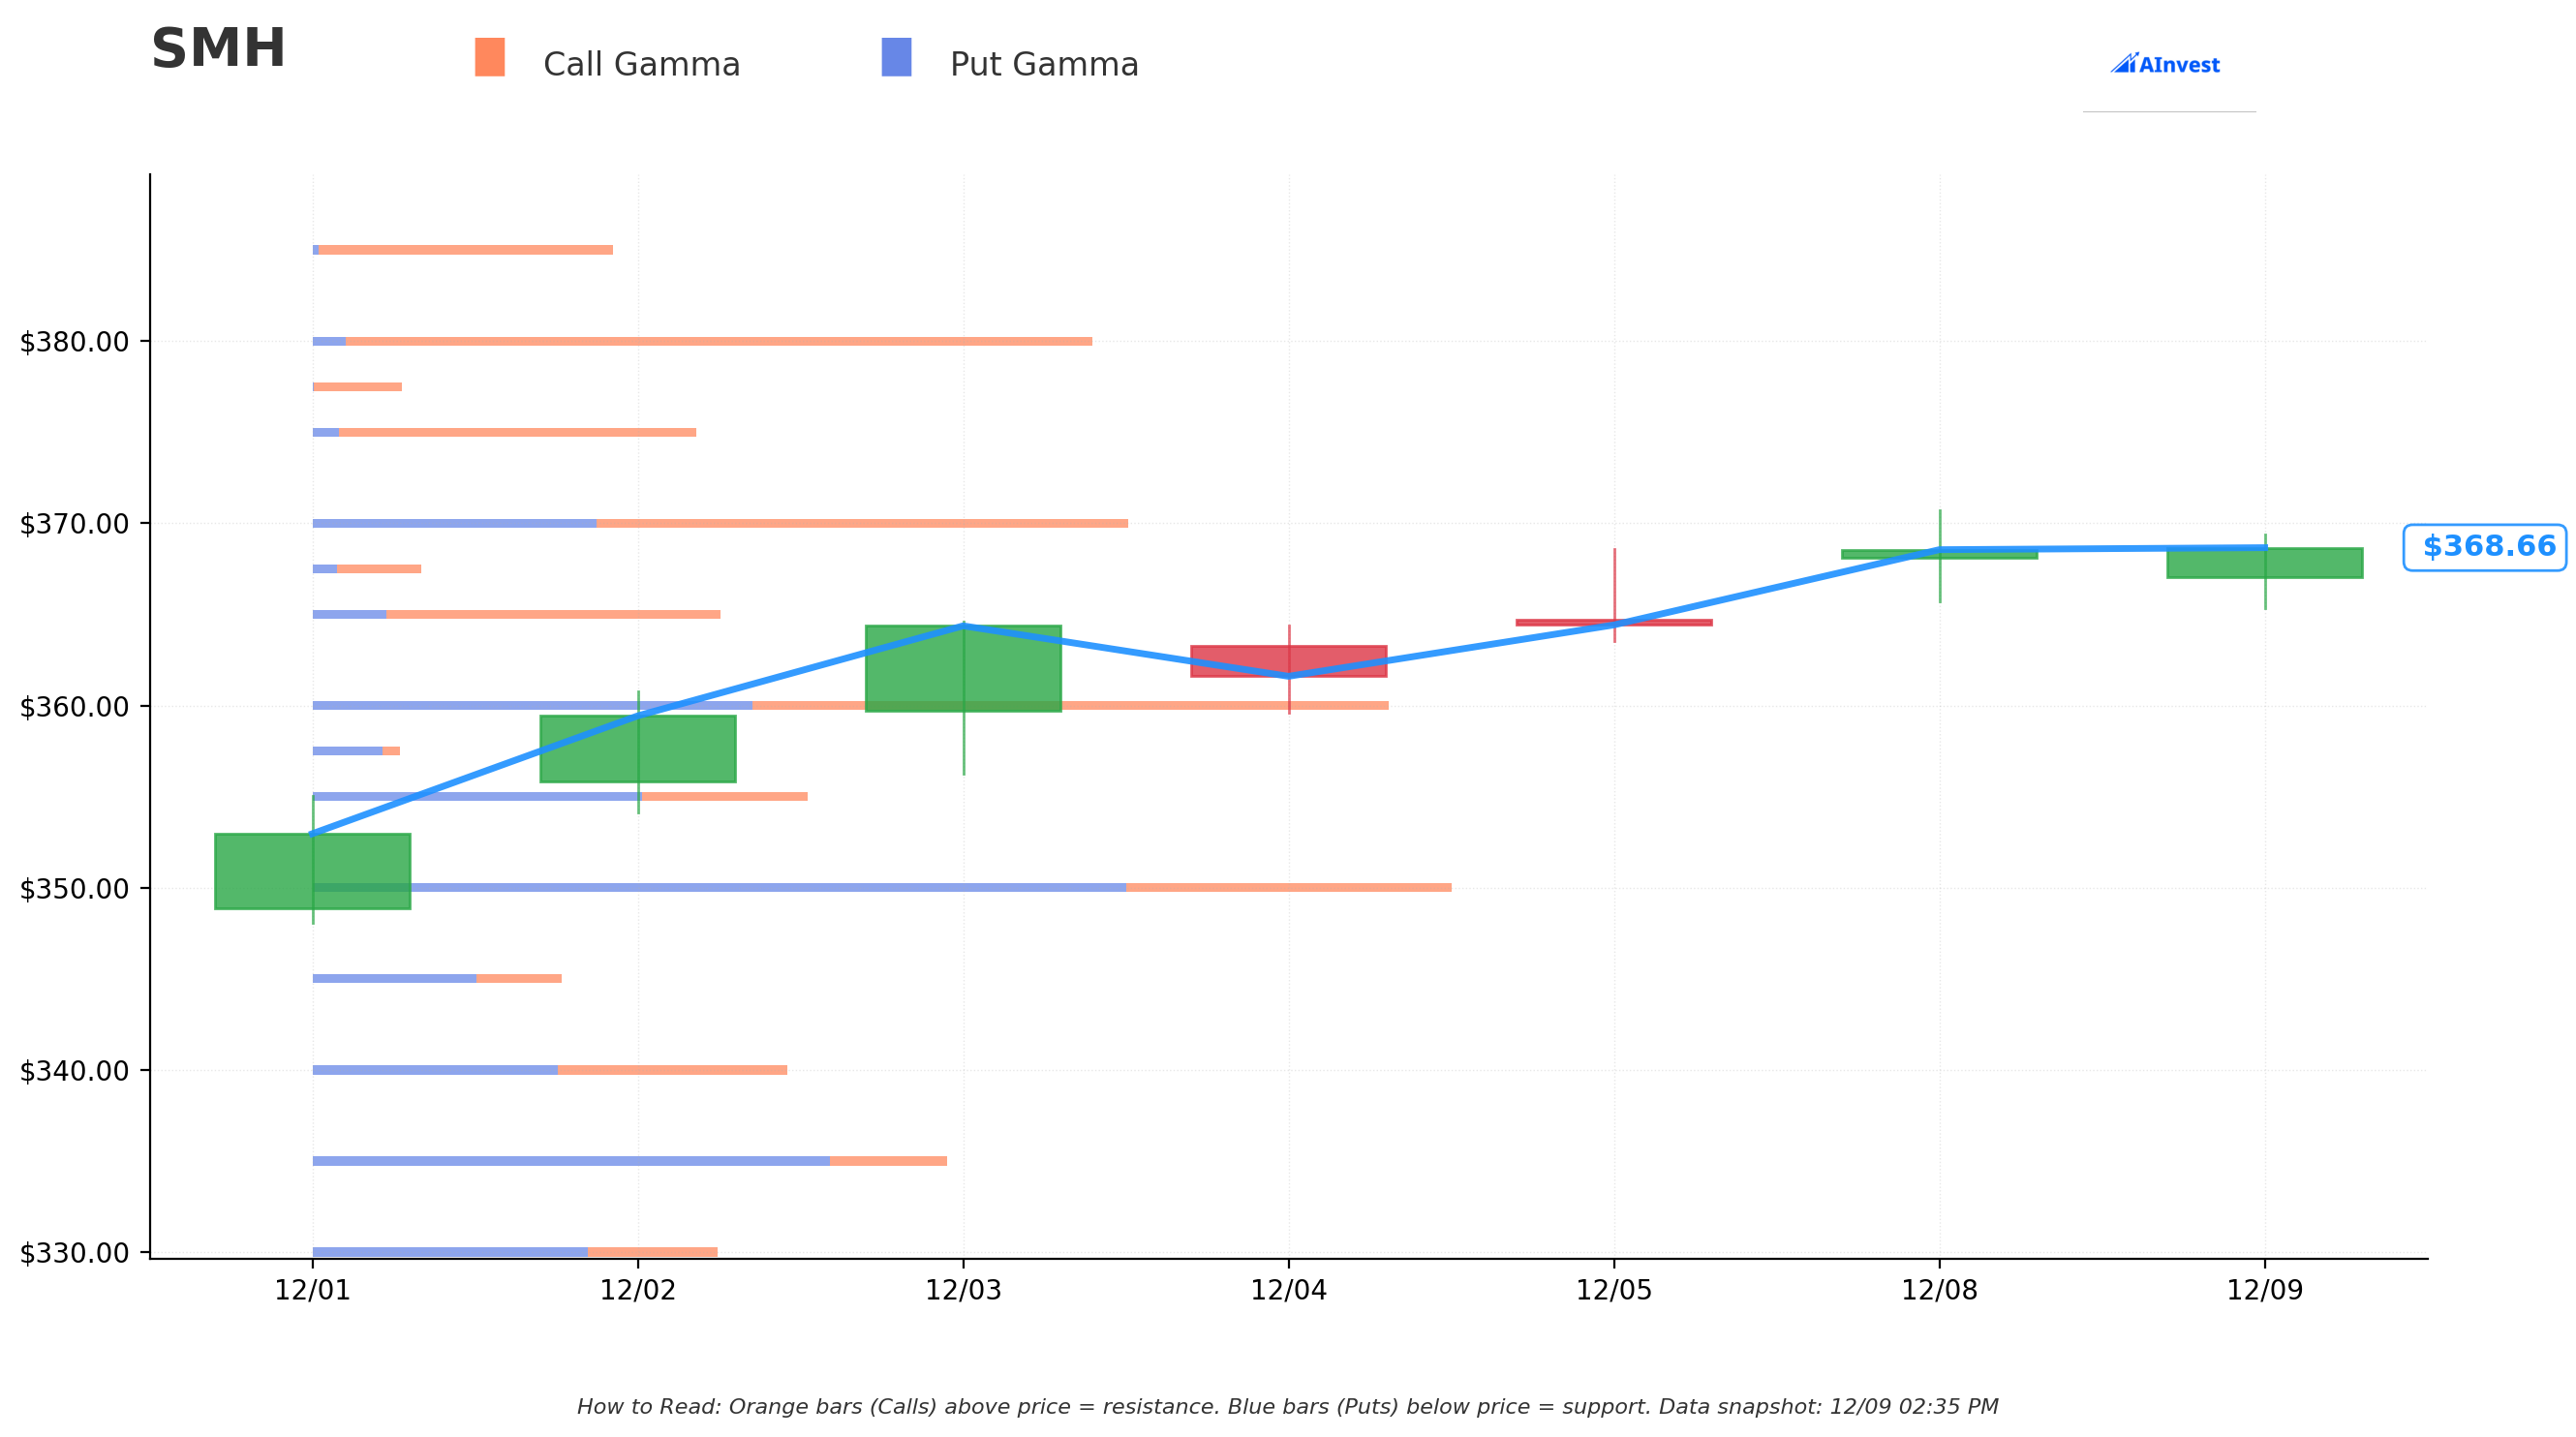
Gamma exposure reveals where market makers have significant hedging requirements, creating natural support and resistance levels:
Resistance Levels (Call Gamma - Orange Bars):
-
$370 - Strongest Near-Term Resistance 📍
- Call GEX: $6.25M | Put GEX: $3.36M | Net: +$2.89M
- Distance: Just 0.4% above current price
- Why it matters: This is where we are RIGHT NOW. Heavy call gamma means market makers need to sell stock as price rises here, creating a ceiling. The short call spread sold at $390 is positioned just above the next major resistance.
-
$380 - Major Barrier 🚧
- Call GEX: $8.74M | Put GEX: $0.40M | Net: +$8.34M
- Distance: 3.1% above current price
- Why it matters: Massive net call gamma here - this is where dealers will fight price appreciation aggressively.
-
$390 - The Short Strike Target 🎯
- Call GEX: $10.53M | Put GEX: $0.03M | Net: +$10.50M
- Distance: 5.8% above current price
- Why it matters: This is THE level. The institution sold calls here because gamma positioning suggests this is where the rally stalls. Think of it as a concrete wall built by options math.
-
$400 - Maximum Stretch Goal
- Call GEX: $6.27M | Put GEX: $0.10M | Net: +$6.17M
- Distance: 8.5% above current price
- Why it matters: If SMH somehow breaks $390, this is the next resistance. But gamma thins out here, so moves could be violent.
Support Levels (Put Gamma - Blue Bars):
-
$360 - Strongest Support 🛡️
- Call GEX: $7.49M | Put GEX: $5.23M | Net: +$2.26M
- Distance: 2.3% below current price
- Why it matters: Heavy put gamma means dealers need to buy stock if price falls here, creating a floor. This is the first line of defense if the bearish thesis plays out.
-
$355 - Secondary Support
- Call GEX: $1.95M | Put GEX: $3.94M | Net: -$1.99M
- Distance: 3.7% below current price
-
$350 - Major Put Wall 💪
- Call GEX: $3.84M | Put GEX: $9.64M | Net: -$5.81M
- Distance: 5.0% below current price
- Why it matters: This is the panic button level. Massive put gamma here means if SMH falls to $350, market makers will be forced buyers, likely creating a bounce.
Net GEX Bias: BULLISH
- Total Call GEX: $84.89M
- Total Put GEX: $65.09M
- Net Bias: +$19.80M in favor of calls
This is interesting - the overall gamma profile is still bullish (more call exposure than put exposure), but the institution selling the call spread is positioning AGAINST this technical setup. They're fading the gamma-driven rally potential.
📊 Implied Move-Based Price Targets
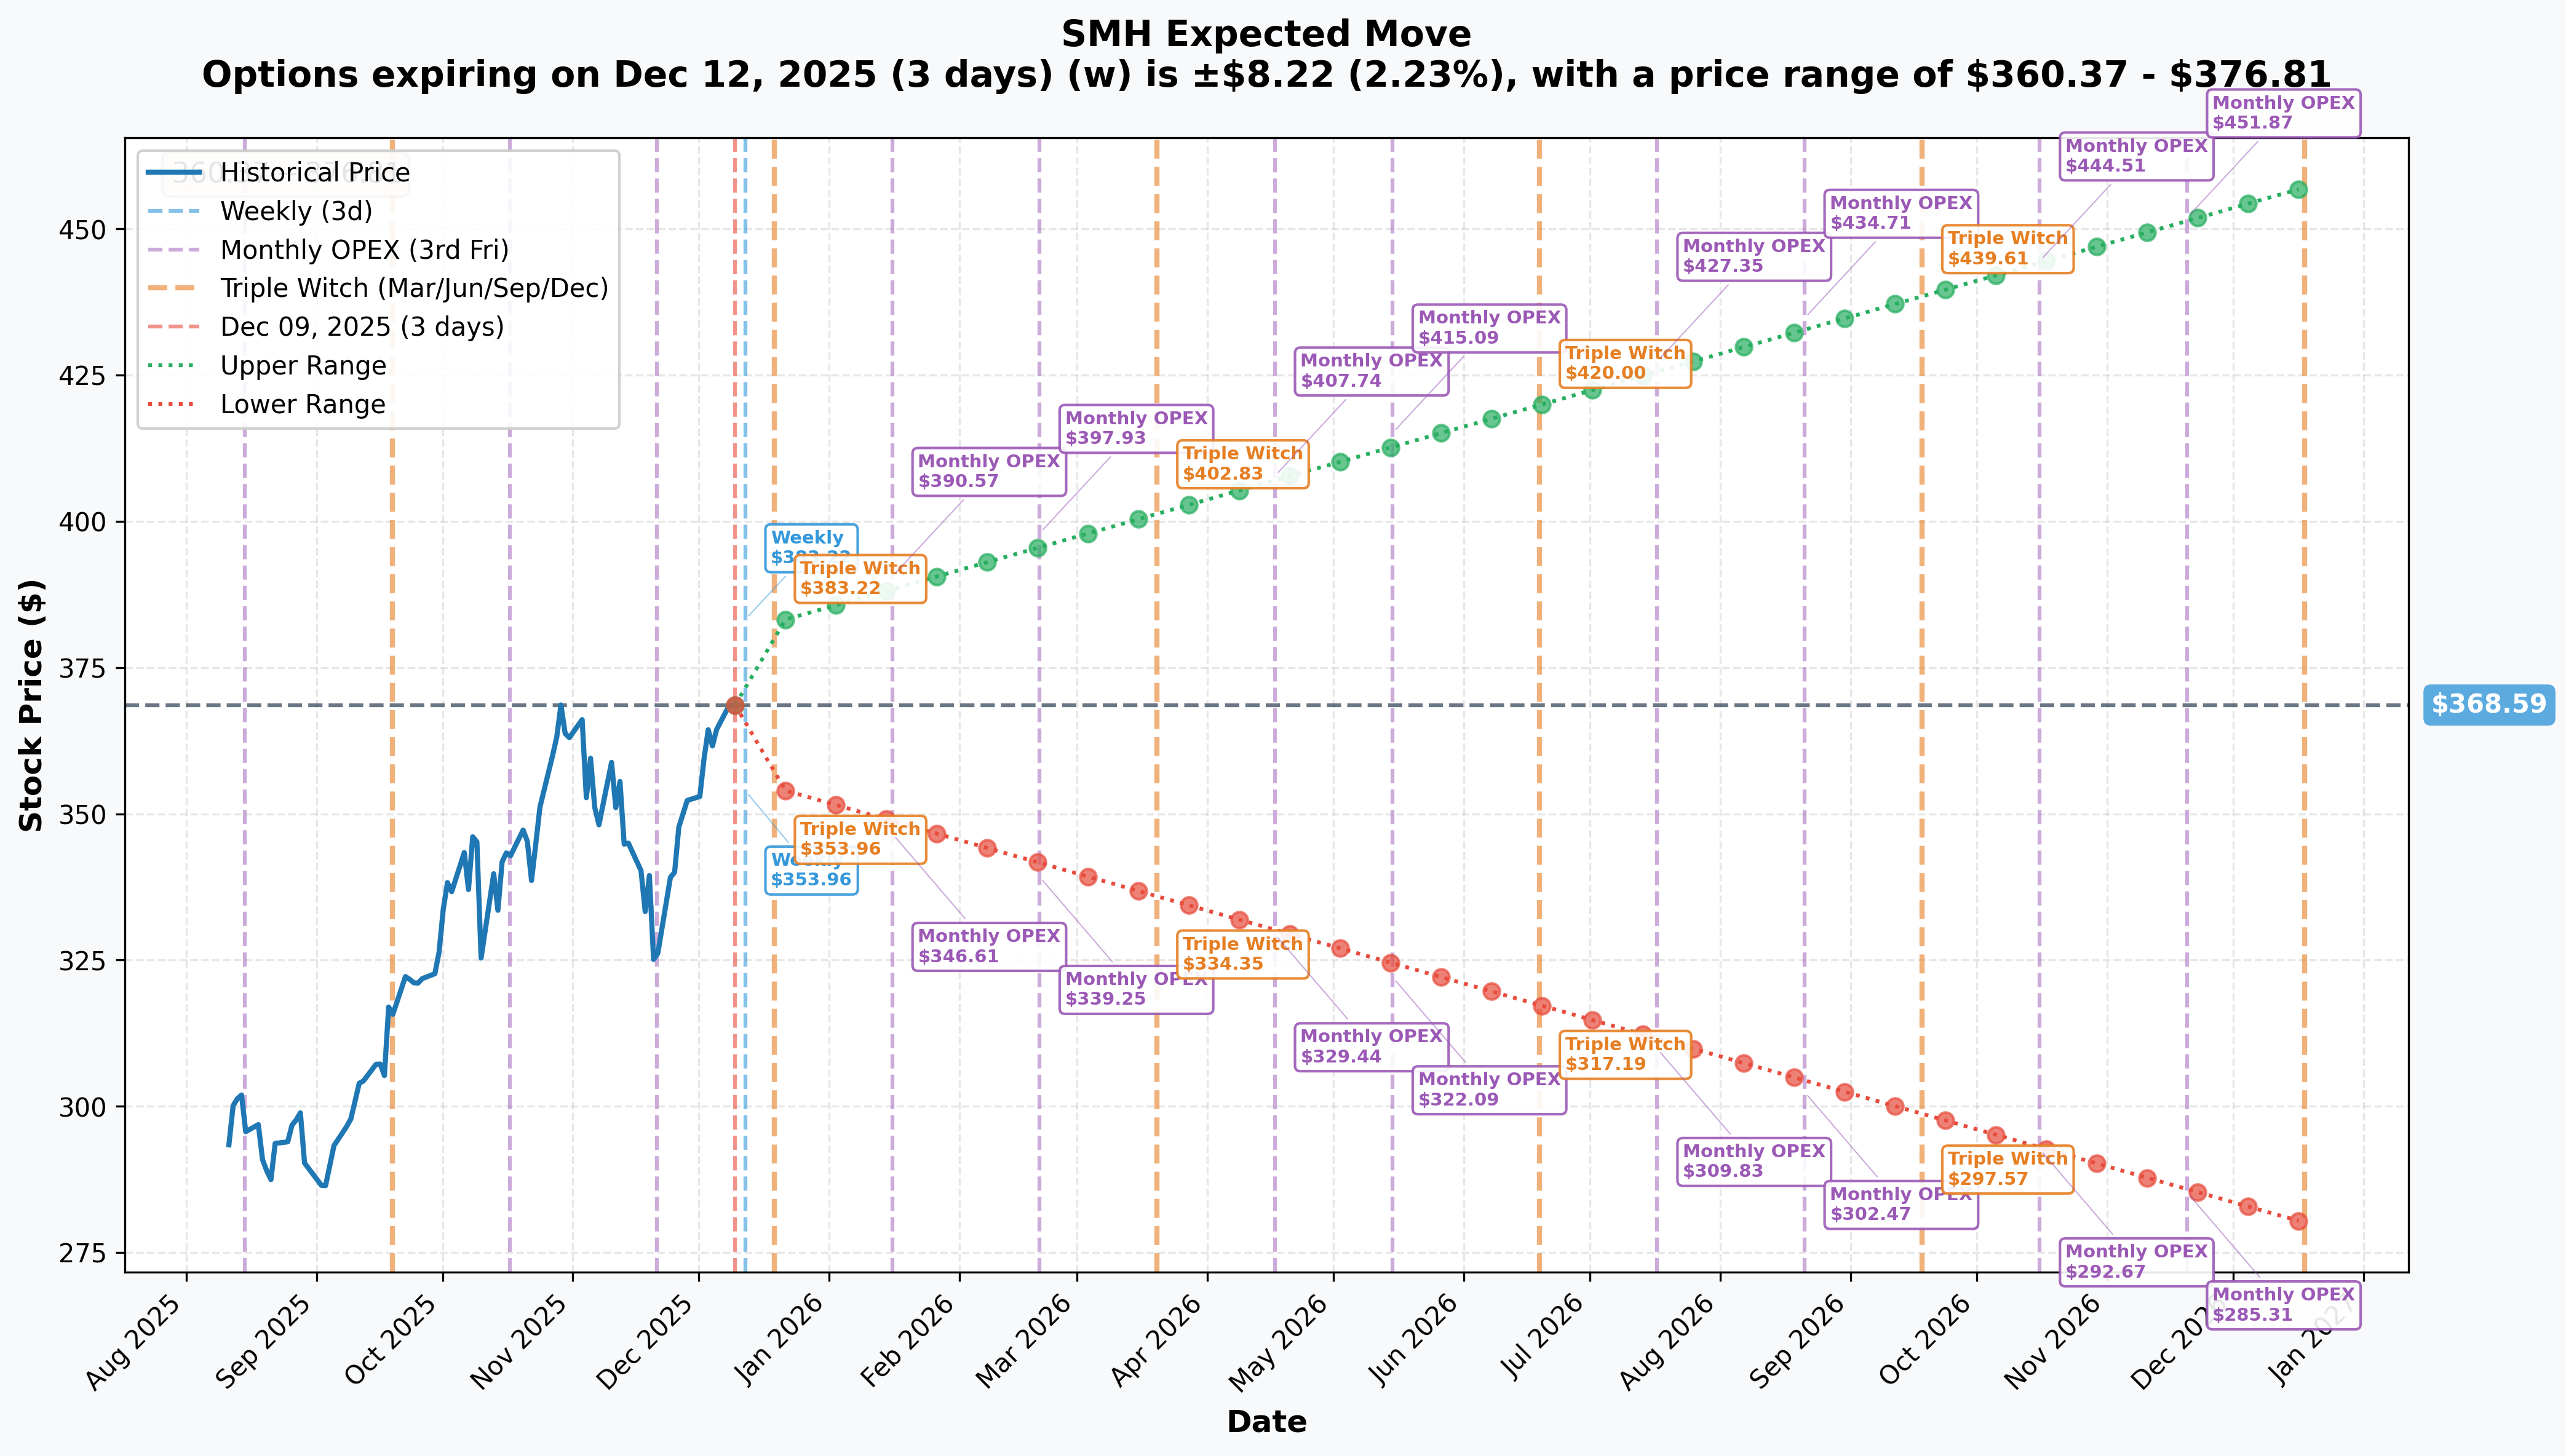
The options market is pricing in specific movement expectations for various time horizons. Here's what volatility is telling us:
Weekly (December 12, 2025 expiration - 3 days out):
- Implied Move: ±2.23% or ±$8.22
- Upper Range: $376.81
- Lower Range: $360.37
- Reliability: High ✅
Monthly OPEX (December 19, 2025 - 10 days out):
- Implied Move: ±3.86% or ±$14.22
- Upper Range: $382.81
- Lower Range: $354.37
- Reliability: High ✅
- Event Type: Triple Witch (quarterly options + futures expiration = extra volatility)
March 2026 OPEX (March 20, 2026 - 101 days out, matching the spread expiration):
- Implied Move: ±8.04% (estimated from chart)
- Upper Range: ~$402.83
- Lower Range: ~$334.35
- Event Type: Triple Witch
Yearly LEAPS (December 18, 2026 - 374 days out):
- Implied Move: ±24.04% or ±$88.59
- Upper Range: $457.18
- Lower Range: $280.00
- Reliability: High ✅
Key Insight for This Trade:
The March 2026 implied move suggests the market expects SMH to trade in a range of $334-$403. The institution sold the $390 call right near the upper end of this expected range, then bought the $460 call far above any reasonable expectation. This is textbook income generation with minimal risk of being assigned.
The probability SMH reaches $390 by March 20, 2026 is approximately 35-40% based on implied volatility. The probability of reaching $460? Less than 5%. That's why the premium collected is so asymmetric ($29M vs $5.1M).
🎪 Catalysts - What Could Move SMH
🔥 Upcoming Catalysts (Could Affect This Trade)
December 11, 2024 (2 DAYS) - Broadcom Q4 Earnings 📊
- Expected revenue: $17.5B (+24.5% YoY)
- Consensus EPS: $1.87 for fiscal Q4 2025
- AI semiconductor revenue expected: $6.2B (+66% YoY)
- Impact: Broadcom is 8.53% of SMH - a strong AI revenue print could push SMH through $370 resistance
January 7-10, 2025 - CES 2025 (Las Vegas) 🎮
- NVIDIA unveiling GeForce RTX 50 Series with Blackwell architecture
- AMD launching Radeon RX 9070 XT GPU and Ryzen 9950X3D CPU
- Intel releasing Core Ultra 200 mobile/desktop processors
- Impact: Major product announcements typically create short-term rallies in semi stocks
January 16, 2025 - TSMC Q4 2024 Earnings 🏭
- Q4 guidance: Revenue $32.2B-$33.4B
- December 2024 sales surged 58% YoY
- 3nm/5nm capacity utilization exceeding 100%
- Impact: TSMC is 9.32% of SMH and NVIDIA's primary supplier - this is THE earnings event for semiconductor supply chain validation
January 16, 2025 - Intel Arc B570 GPU Launch 💻
- $219 graphics card releasing
- Impact: Minor - Intel is only 5.74% of SMH and this is a budget GPU
February 25, 2026 - NVIDIA Q4 FY2026 Earnings 🚀
- Last report: Q3 FY2026 revenue $57.0B (+62% YoY)
- Key metric: Blackwell GPU revenue contribution
- Impact: NVIDIA is 17.12% of SMH - this is the most important single catalyst before the March 20 expiration
March 17-21, 2025 - NVIDIA GTC 2025 (San Jose) 🎤
- Annual GPU Technology Conference with Jensen Huang keynote
- Expected announcement: Blackwell Ultra (B300) with 288GB HBM3E
- Potential reveals: 2026 Rubin GPU architecture, Vera CPU
- Impact: This is 3 days BEFORE the March 20 expiration - maximum impact window for the short call spread!
March 20, 2025 - Micron Q2 FY2025 Earnings 💾
- Consensus estimate: $1.43 EPS (+240% YoY)
- Key metrics: HBM3E production ramp, data center revenue
- Impact: Micron is 6.03% of SMH - memory pricing sustainability is crucial for sector valuation
📅 Already Happened (Context for Current Move)
December 18, 2024 - Micron Q1 FY2025 Earnings CRUSHED IT 💚
- Q1 revenue: $8.71B vs $4.73B YoY (+84%)
- GAAP net income: $1.87B or $1.67 per share
- EPS beat: $1.79 vs $1.75 consensus (+2.29% surprise)
- Data center revenue: +40% QoQ, +400% YoY
- Impact: This contributed to SMH's recent surge to all-time highs
Q4 2024 - TSMC Record Revenue 📈
- Q4 revenue: NT$868.5B ($26.3B), up 38.8% YoY
- Full year 2024: NT$2.9T, highest since 1994 IPO
- November revenue: NT$276.06B (+34% YoY)
- Impact: Validates AI chip demand, but also sets up tough comps for 2025
November-December 2024 - Memory Price Supercycle 💰
- DRAM contract prices surged 420% in 2024
- PC/server DDR5 up 30%+ in past month
- Samsung closing Q4 deals at ~40% price increase
- SK Hynix operating margin for DRAM: >70%
- Impact: This is WHY SMH rallied 52% YTD - but it also creates valuation concerns
December 2, 2024 - US-China Export Controls Escalation 🚨
- BIS announced controls on 24 types of semiconductor equipment
- First-time restrictions on advanced HBM to China (HBM2E+)
- 140 companies added to entity list
- Controls took effect December 31, 2024
- Impact: Creates revenue headwinds for equipment makers (ASML, LAM, AMAT) which are 17.39% of SMH combined
🎲 Price Targets & Probabilities
Using the gamma levels, implied move data, and upcoming catalysts, here are three scenarios for SMH by March 20, 2026 (the spread expiration):
🐂 Bull Case: $390-$400 (35-40% probability)
Path: Broadcom crushes earnings → CES product launches exceed expectations → TSMC Q4 shows no demand slowdown → NVIDIA GTC reveals Blackwell Ultra specs → Memory pricing holds up through Q1 2026
Gamma Target: $390 (the short strike) - this is where massive call gamma creates resistance Implied Move Target: $402.83 (upper end of March OPEX implied range) Probability SMH reaches $390: 35-40% based on options pricing What happens to the short call spread: Loses money if SMH closes above $404.40 (breakeven = $390 + $14.40 premium collected)
Why it could happen:
- 2025 semiconductor sales projected at $697B (new record)
- Gen AI chip revenue exceeding $150B in 2025
- NVIDIA's entire 2025 Blackwell production already sold out
- Analyst consensus price target: $404.33 (+14.55% from Dec 8 close)
Risks to bull case:
- P/E ratio of 44.80 is elevated vs historical norms
- 420% DRAM price increase could cause demand destruction
- SOX index already down 20%+ from summer highs despite revenue growth
🎯 Base Case: $354-$382 (40-45% probability)
Path: Mixed earnings season → Some profit-taking after the 52% YTD rally → Sideways consolidation as market digests gains → Rotation between equipment/memory/fabless subsectors
Gamma Range: $360-$380 (where majority of gamma sits) Implied Move Range: $354.37-$382.81 (Monthly OPEX band) Probability SMH stays in this range: 40-45% What happens to the short call spread: Keeps the full $23.9M premium if SMH stays below $390
Why this is most likely:
- SMH is at all-time highs with limited pullbacks - consolidation is natural
- Gamma profile shows "pin" zones at $360, $370, and $380
- NVIDIA GTC is right before expiration - traders will wait to see announcements before committing
- Industry confidence at 59 (vs 54 in 2024) suggests positive but not euphoric sentiment
What the institution is betting on: This is the expected scenario for the short call spread seller. They're saying: "SMH has run hard, but we don't think it breaks out to new highs. We'll collect premium as volatility comes in and the ETF consolidates."
🐻 Bear Case: $335-$354 (15-20% probability)
Path: Broadcom disappoints → China retaliation on US export controls → Memory pricing starts to crack → Concerns about 2026 demand visibility → Tech sector rotation
Gamma Support: $350 (major put wall) and $360 (strongest support) Implied Move Floor: $354.37 (lower end of Monthly OPEX) Probability SMH drops below $350: 15-20% What happens to the short call spread: Keeps the full premium - this is the best outcome for the seller
Why it could happen:
- US-China tech decoupling accelerating with December 2024 export controls
- ASML growth decelerating to 3.2% in 2026 from 23.5% in 2025
- Data centers hitting capacity/power limits
- Industry has flipped from growth to shrinkage 9 times in last 34 years
Key support levels:
- $360: First line of defense (2.3% downside)
- $350: Major put gamma wall (5.0% downside)
- $340: Last stand before panic selling (7.8% downside)
💡 Trading Ideas
🛡️ Conservative: "Fade the Fade" - Buy SMH Shares on Dips
What to do:
- If SMH pulls back to $360-355 in the next 2-3 weeks, buy shares
- Position size: 2-3% of portfolio
- Target: $385-390 by March 2026
- Stop loss: Below $350 (major gamma support breach)
Why this works: The institution selling calls doesn't mean SMH will crash - it means they're capping upside. The gamma profile shows strong support at $350-360, and the bull case catalysts (Broadcom, TSMC, NVIDIA GTC) are still intact. Buy the dips that this spread seller might create.
Probability of success: 60-65% Risk/Reward: 5-8% upside, 3-4% downside to stop
⚖️ Balanced: "Ride the Range" - Iron Condor Around Gamma Levels
What to do:
- Wait for volatility spike (Broadcom earnings, CES)
- Sell Mar 2026 $350 put / Buy Mar 2026 $340 put
- Sell Mar 2026 $390 call / Buy Mar 2026 $400 call
- Collect premium if SMH stays in $350-390 range (matches base case scenario)
Why this works: You're positioning EXACTLY like the big money - selling calls at $390 (where the institution sold) and selling puts at $350 (where gamma support sits). The gamma and implied move data both suggest this is the likely range.
Estimated premium: $4-6 per spread (need to check actual prices) Max profit: Premium collected if SMH stays between $350-390 Max loss: $10 minus premium (capped by spreads) Probability of success: 50-55%
🚀 Aggressive: "Contrarian Rally" - Buy Mar 2026 $380 Calls
What to do:
- Buy Mar 2026 $380 calls (currently ~$15-18 based on $17.46 for $390 strikes)
- Position size: 0.5-1% of portfolio (this is a lottery ticket)
- Target: 100-200% gain if SMH breaks out to $400+
Why this could work: The institution is selling calls at $390 - but what if they're WRONG? The bull case catalysts are exceptional:
- NVIDIA Blackwell production ramp
- HBM supply shortage extending past 2028
- $185B in 2025 capex
- Analyst target of $404.33
If SMH breaks through $380 gamma resistance and triggers a short squeeze in all those sold calls, you could see a violent move to $410-420.
Probability of success: 30-35% Risk/Reward: Could lose 100% of premium, but gain 200-300% if right Breakeven: $380 + premium paid (~$395-398)
Key catalysts to watch:
- December 11: Broadcom earnings
- January 16: TSMC earnings
- March 17-21: NVIDIA GTC (right before expiration!)
⚠️ Risk Factors - What Could Go Wrong
📉 Cyclical Downturn Risk (HIGH)
The semiconductor industry is notoriously cyclical. The chip sector has flipped from growth to shrinkage 9 times in the last 34 years, and the frequency is increasing. Warning signs:
- Valuation: SMH P/E of 44.80 vs historical average in the low 20s
- Divergence: SOX index down 20%+ from summer highs despite revenue acceleration
- 2026 Visibility: Industry concerns about inventory builds and extended growth cycles
Impact on trade: If cyclical downturn begins, SMH could easily fall 15-20% (to $295-310), blowing through all gamma support levels.
🌏 Geopolitical Escalation (VERY HIGH)
US-China tech war is heating up:
- Recent: December 2, 2024 export controls on HBM and 140 entities
- Retaliation: China responded with gallium and germanium export controls
- Taiwan Risk: 90% of world's advanced chips made in Taiwan
Impact on trade: Equipment companies (ASML, LAM, AMAT) are 17% of SMH and directly hurt by export restrictions. Further escalation could trigger 10-15% selloff.
💸 Memory Pricing Collapse (MEDIUM-HIGH)
The memory supercycle is amazing... until it isn't:
- Current: DRAM prices up 420% in 2024
- Concern: Prices may extend past 2028, but this creates oversupply concerns
- Demand Destruction: At some point, 40% quarterly price increases kill demand
Impact on trade: Memory companies (MU, SK Hynix, Samsung) are 15%+ of SMH. If pricing cracks, the ETF could fall 8-12% quickly.
🤖 AI Demand Plateau (MEDIUM)
The entire SMH rally is built on AI infrastructure spending. What if it slows?
- Concentration: Current cycle largely propelled by AI, limited breadth
- Infrastructure Limits: Data centers hitting capacity/renewable energy limits
- Blackwell Delays: NVIDIA had design flaws in October 2024, revenue shifted to 2025
Impact on trade: If Q1 2026 guidance from NVIDIA/TSMC disappoints, SMH could gap down 10-15% overnight.
📊 Technical Breakdown (MEDIUM)
SMH is trading at the top of its range with parabolic momentum:
- RSI: Likely overbought (not visible in data, but up 52% YTD)
- Resistance: $370-380 gamma levels could cap rallies
- Support: If $360 breaks, next stop is $350 (5% drop)
Impact on trade: A technical breakdown could trigger algorithmic selling and cascade through $360 → $350 → $340 supports.
⏰ Time Decay for Call Buyers (HIGH for Aggressive Strategy)
If you're buying the Mar 2026 $380 calls (aggressive strategy):
- Theta decay: Lose ~0.5% of premium per week as expiration approaches
- Volatility crush: After Broadcom/TSMC/NVIDIA earnings, IV could collapse 20-30%
- Dead money: If SMH trades sideways at $365-375, your calls slowly bleed to zero
Impact on trade: You need SMH to move NOW, not slowly grind higher over 3 months.
🎯 The Bottom Line
Real talk: This $34.1M short call spread is institutional money saying "we've made enough - time to lock in profits and cap our upside." It's not a crash bet (they bought the $460 calls as protection), but it IS a signal that smart money thinks SMH's parabolic rally is done.
Here's what the data is screaming:
✅ What's working FOR semiconductors:
- Record 2025 sales projected at $697B
- AI chip demand exceeding $150B
- NVIDIA Blackwell sold out for entire 2025
- Memory margins at 70%+ for SK Hynix
- Strong gamma support at $350-360
❌ What's working AGAINST semiconductors:
- P/E ratio of 44.80 at historical extremes
- US-China export controls escalating
- 420% DRAM price increase unsustainable
- SOX index already down 20% from highs
- 2026 visibility clouded
- Massive call gamma resistance at $370, $380, $390
My Take:
The institution selling this spread is SMART. They're not betting on a crash - they're betting on consolidation. SMH up 52% YTD is incredible, but the gamma profile, implied move data, and valuation concerns all point to a $354-390 range over the next 3 months.
Action Plan:
If you own SMH or semiconductor stocks:
- Take some profits if you're up big (20%+ gains)
- Set stop losses below $360 (first gamma support)
- Mark your calendar: Broadcom (Dec 11), TSMC (Jan 16), NVIDIA GTC (Mar 17-21)
If you're watching SMH:
- Wait for pullback to $360-355 before buying shares (Conservative strategy)
- Consider selling the $390 calls yourself if you own shares (collect premium like the institution)
- Don't chase the current $368 level - risk/reward isn't great here
If you're trading options:
- Iron condor around $350-390 makes sense (Balanced strategy)
- Buying $380+ calls is speculation - only do this if you believe analysts are right about $404 target (Aggressive strategy)
- Avoid selling puts below $350 - that's where gamma support could fail if macro turns
Key Dates to Watch:
- December 11: Broadcom earnings (could trigger move to $375-380)
- January 16: TSMC earnings (validation of AI demand)
- March 17-21: NVIDIA GTC (final catalyst before March 20 expiration)
The Lesson:
When institutions sell $34M of call spreads at all-time highs, they're not being bearish - they're being realistic. The gamma data backs them up: $390 is where options math says this rally stalls. Smart traders take chips off the table after a 52% run, not when the market is crashing.
Follow the smart money. Respect the gamma levels. And remember: Trees don't grow to the sky, even in semiconductors. 🌳
Disclaimer: This analysis is for educational and informational purposes only. Options trading involves substantial risk and is not suitable for all investors. The strategies discussed may result in loss of capital. Past performance does not guarantee future results. Always conduct your own due diligence and consider consulting a financial advisor before making investment decisions.
Data Sources: Option flow data from proprietary analysis, gamma exposure levels from market maker positioning, implied move calculations from options pricing models, catalyst research from company filings and financial news outlets, technical analysis from market data providers. All links provided inline for verification.
Analysis Date: December 9, 2025 SMH Price at Analysis: $368.57 Spread Expiration: March 20, 2026 Days to Expiration: 101