💎 SMH $6.8M Call Spread - Big Money Bets on Semis Rallying Into June! 🚀
📅 January 21, 2026 | 🔥 Unusual Activity Detected
🎯 The Quick Take
Someone just dropped $6.8 MILLION on a bullish call spread in SMH this morning at 09:56:54! They bought 2,702 contracts of June 18 $420 calls while simultaneously selling 1,500 contracts of the $480 calls - a classic vertical spread betting semiconductors rally 4.4-19% higher by the June triple witch. With TSMC just crushing earnings last week and Nvidia's Blackwell sold out through mid-2026, this institutional player is betting the AI chip supercycle continues. Translation: Smart money sees $420+ SMH by summer!
📊 ETF Overview
VanEck Semiconductor ETF (SMH) is the premier semiconductor ETF tracking the largest U.S.-listed chip companies:
- Current Price: $402.33
- AUM: $43.46 billion - ETF Database
- Expense Ratio: 0.35%
- 52-Week Range: $170.11 - $405.31 - Stock Analysis
- P/E Ratio (TTM): 45.97x - ETF Database
- 1-Year Return: ~55-60% - Morningstar
- Beta: 1.64 (high volatility relative to market)
🏆 Top Holdings
| Rank | Company | Ticker | Weight |
|---|---|---|---|
| 1 | NVIDIA Corporation | NVDA | 18.90% |
| 2 | Taiwan Semiconductor | TSM | 10.61% |
| 3 | Broadcom Inc. | AVGO | 7.70% |
| 4 | Micron Technology | MU | 5.77% |
| 5 | ASML Holding | ASML | 5.66% |
Source: VanEck
Recent Fund Flows:
- 📈 1-Month Net Flows: +$870.7M
- 📈 3-Month Net Flows: +$2.89B
- 📈 1-Year Net Flows: +$3.85B
- 📉 5-Day Net Flows: -$291.68M (short-term profit taking)
💰 The Option Flow Breakdown
📊 The Tape (January 21, 2026 @ 09:56:54)
| Time | Symbol | Side | Type | Expiration | Strike | Volume | Premium | Order Type | Strategy | Z-Score | Classification |
|---|---|---|---|---|---|---|---|---|---|---|---|
| 09:56:54 | SMH | BUY | CALL | 2026-06-18 | $420 | 2,000 | $3.8M | BTO | Long Call | 42.76 | EXTREMELY_UNUSUAL |
| 09:56:54 | SMH | BUY | CALL | 2026-06-18 | $420 | 702 | $1.6M | BTO | Long Call | 14.61 | EXTREMELY_UNUSUAL |
| 09:56:54 | SMH | SELL | CALL | 2026-06-18 | $480 | 1,500 | $1.4M | STO | Short Call | 7.12 | EXTREMELY_UNUSUAL |
Option Symbols:
- Long leg: SMH20260618C420
- Short leg: SMH20260618C480
🤓 What This Actually Means
This is a bullish call spread (also called a bull call spread or vertical debit spread). Here's the breakdown:
- 💸 Net premium paid: ~$5.4M ($3.8M + $1.6M - $1.4M credit from short calls)
- 🎯 Break-even price: ~$424-426 (4.4% above current $402.33 price)
- 🚀 Max profit zone: At $480+ on June 18 expiration
- 📊 Spread width: $60 ($480 - $420)
- ⏰ Time horizon: 148 days to June 18 triple witch expiration
- 🔥 Z-Score: 42.76 on the main leg - this happens maybe a few times per year!
What's really happening here: This institutional trader is betting SMH trades between $420-$480 by mid-June 2026. They're bullish but defined-risk - the short $480 calls cap their upside but dramatically reduce the cost of the trade. The June expiration captures multiple major catalysts: Intel earnings (tomorrow!), Nvidia Q4 (Feb 25), memory chip earnings, and the full Blackwell ramp cycle.
Why sell the $480 calls? At $480 (+19.3% from current), SMH would be hitting new all-time highs well above the current $405 peak. The trader is essentially saying "I think we rally to $420-460, but I'm not betting on a moonshot to $480+."
📈 Technical Setup / Chart Check-Up
YTD Performance Chart
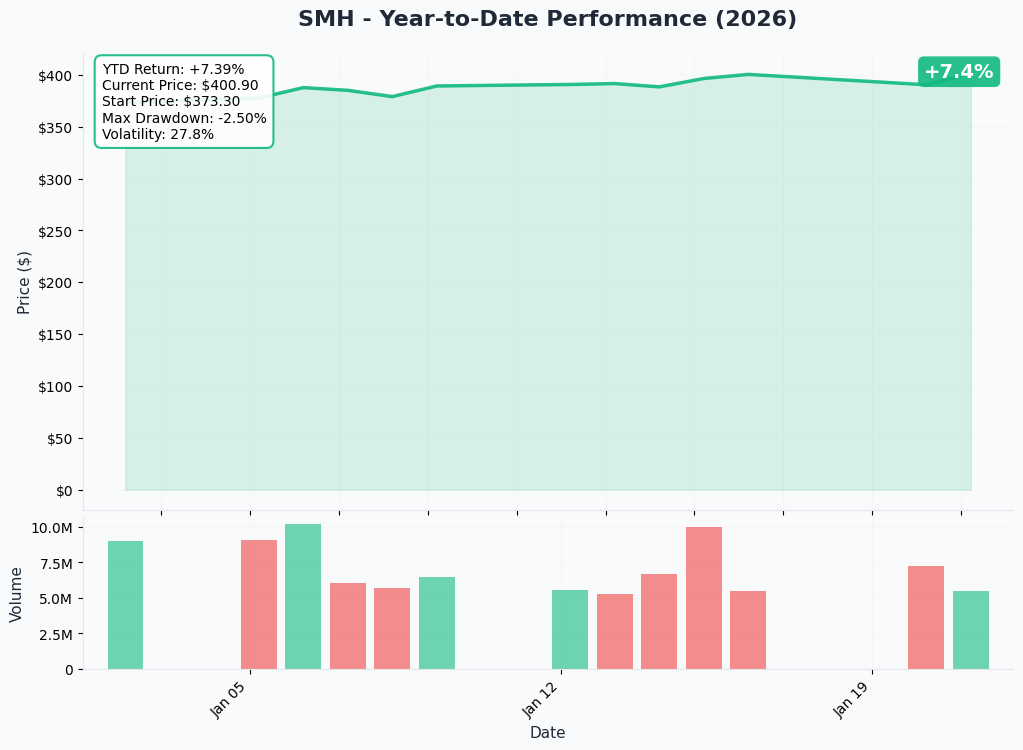
SMH has been on a tear - up 55-60% over the past 12 months riding the AI semiconductor wave. After a consolidation period in late 2025, the ETF is trading near all-time highs around $402, just below the $405.31 52-week high. The chart shows the power of AI demand - TSMC's blowout Q4 2025 earnings on January 15th added another leg to the rally.
Key observations:
- 🚀 Strong uptrend: From $255 in early 2025 to $402 today (+58%)
- 📈 Breakout attempt: Currently testing prior highs - needs to clear $405 resistance
- 🎢 High beta (1.64): Moves 64% more than the broader market in both directions
- 📊 Volume healthy: Consistent institutional accumulation throughout 2025
- ⚠️ Overbought signals: P/E at 46x is stretched but supported by AI earnings growth
Gamma-Based Support & Resistance Analysis
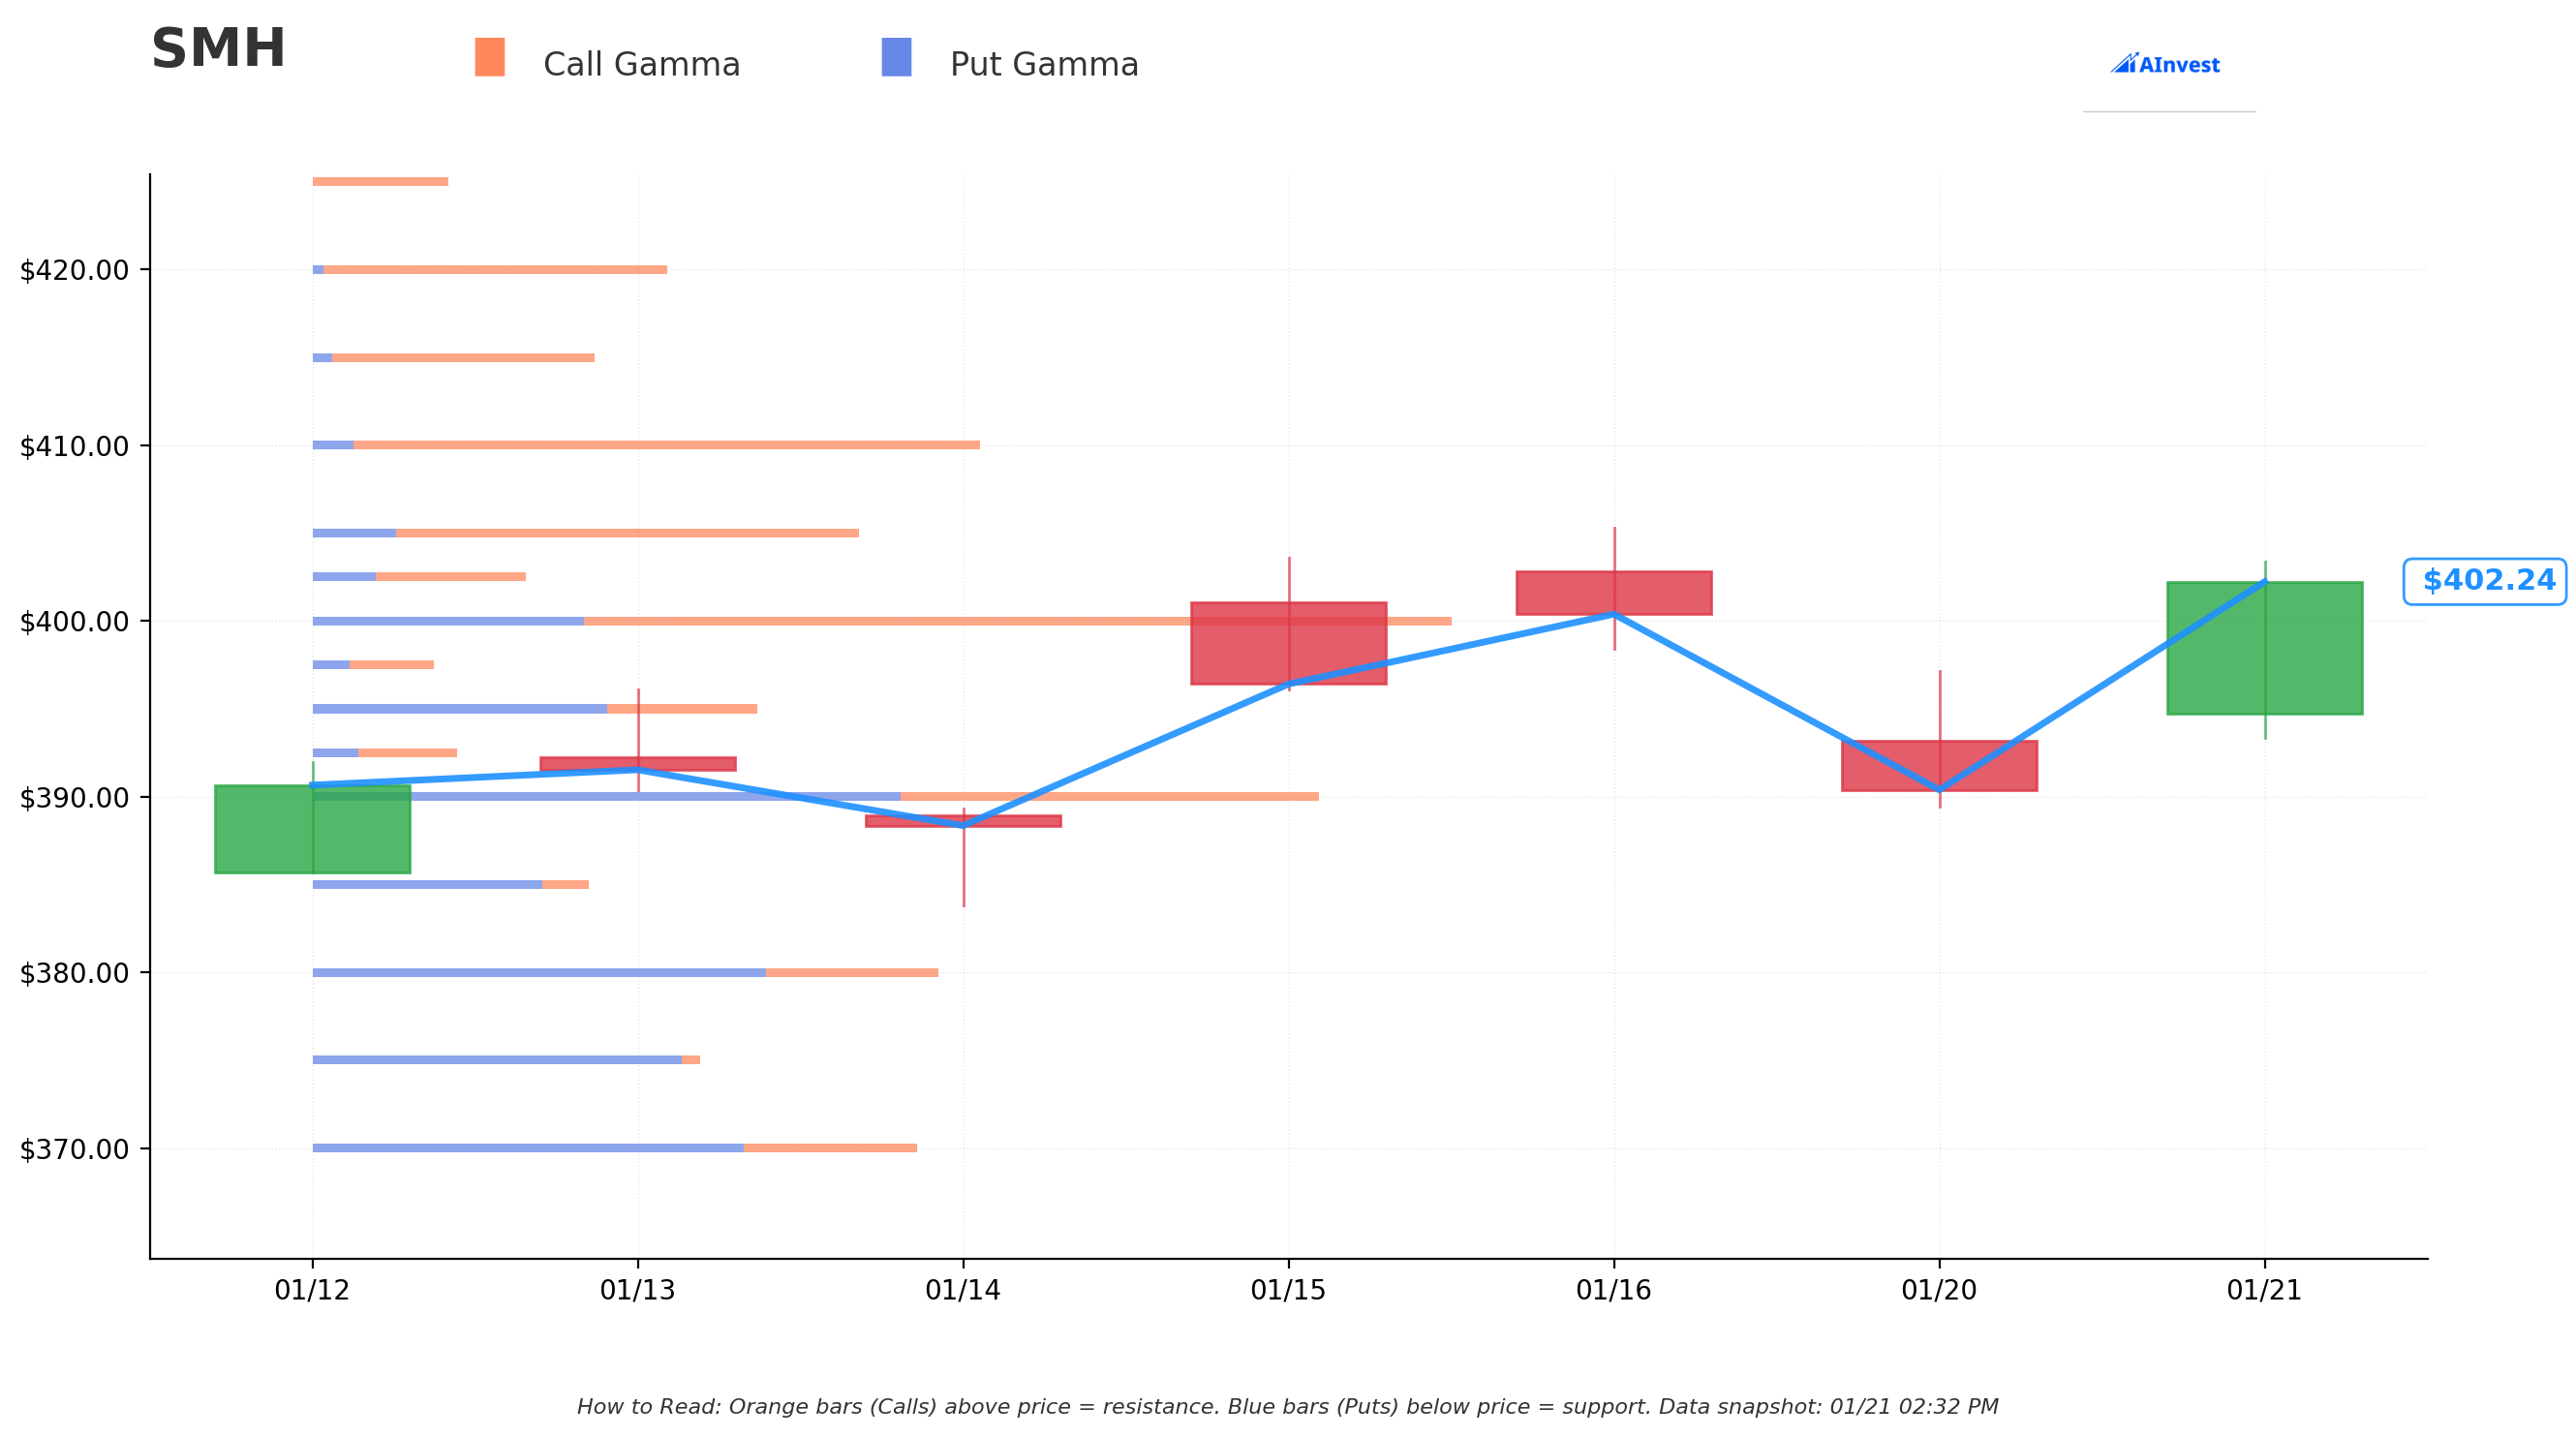
Current Price: $402.33
The gamma exposure map reveals critical dealer positioning that will drive near-term price action:
🔵 Support Levels (Put Gamma Below Price):
- $400 - STRONGEST support with 12.4B total gamma (6.34B net positive) - dealers WILL buy dips here aggressively!
- $395 - Secondary support at 4.9B gamma (1.8% below current)
- $390 - Major floor with 11.1B gamma (3.1% below current)
- $380 - Deep support at 6.9B gamma (5.5% below)
- $370 - Extended support at 6.7B gamma (8% below)
- $360 - Disaster scenario floor at 4.5B gamma (10.5% below)
🟠 Resistance Levels (Call Gamma Above Price):
- $405 - Immediate ceiling with 5.8B gamma (0.7% above) - THIS IS THE KEY BREAKOUT LEVEL!
- $410 - Major resistance at 7.3B gamma (1.9% above current)
What this means for traders: SMH is pinned between MASSIVE $400 gamma support and $405-$410 overhead resistance. The $400 strike has the highest total gamma exposure (12.4B), creating a "floor" where market makers will aggressively buy dips to stay hedged. The call spread buyer is betting SMH breaks through this $405-$410 resistance zone and trends toward $420+ by June.
Net GEX Bias: Bullish (65.8B call gamma vs 57.9B put gamma) - Overall dealer positioning supports upside, but immediate price action constrained by overhead call gamma at $405-$410.
Implied Move Analysis
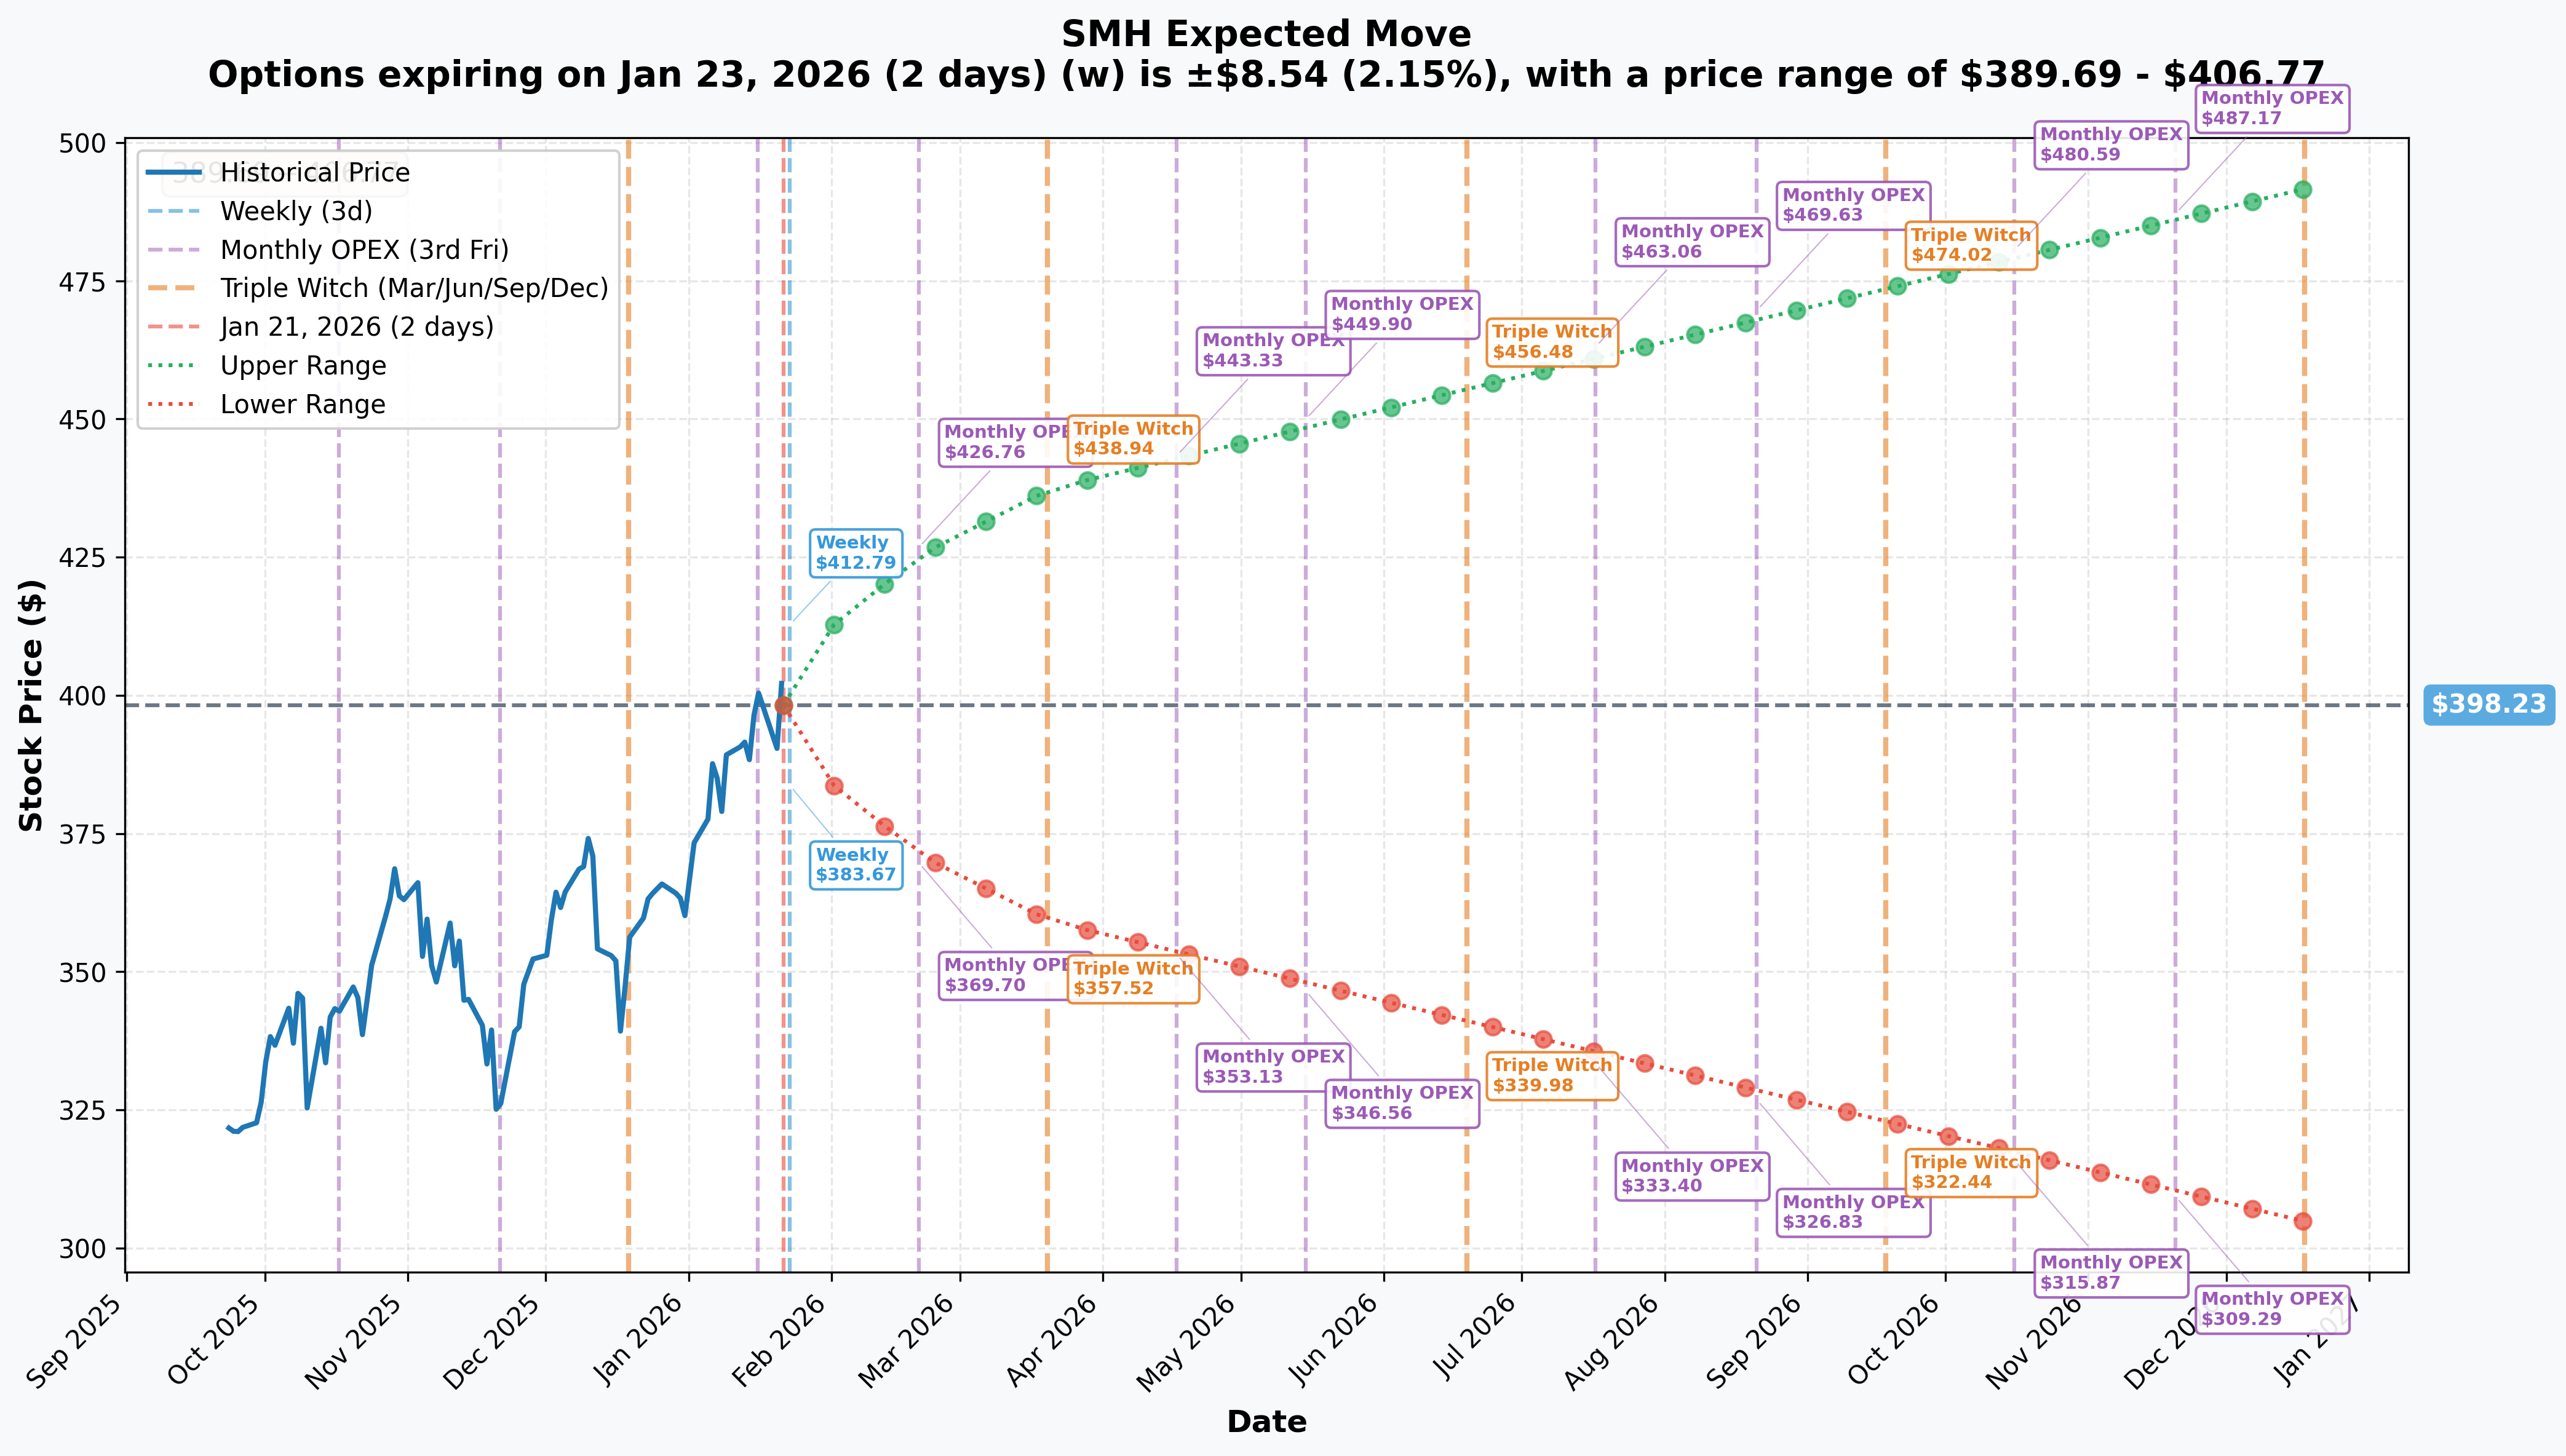
Options market pricing for upcoming expirations:
| Timeframe | Expiry | Days | Implied Move | Upper Range | Lower Range |
|---|---|---|---|---|---|
| 📅 Weekly | 2026-01-23 | 2 | ±2.15% ($8.54) | $406.77 | $389.69 |
| 📅 Monthly OPEX | 2026-02-20 | 30 | ±6.85% ($27.26) | $425.49 | $370.97 |
| 📅 Triple Witch | 2026-03-20 | 58 | ±9.82% ($39.12) | $437.35 | $359.11 |
| 📅 June Triple Witch | 2026-06-19 | 149 | ±14.5% (~$58) | $456.48 | $339.98 |
| 📅 Yearly LEAPS | 2026-12-18 | 331 | ±23.48% ($93.52) | $491.75 | $304.71 |
Translation for regular folks: Options traders are pricing in a 2.15% move ($8.54) by this Friday and a much larger 6.85% move ($27) through February OPEX. The February range of $370.97-$425.49 is wide because it captures major earnings from Intel (tomorrow!), Nvidia (Feb 25), and multiple memory chip companies.
The June expiration (when this call spread expires) has an upper range of $456.48 - meaning the market thinks there's a reasonable chance SMH trades above $450 by summer. The $420 strike bought today is INSIDE this implied upper range, suggesting the trade has roughly 50-55% probability of being profitable.
Key insight: The implied volatility term structure slopes upward, reflecting elevated uncertainty around the AI chip earnings cycle through Q1-Q2 2026.
🎪 Catalysts
🔥 Immediate Catalysts (Next 7-30 Days)
Intel Q4 2025 Earnings - January 22, 2026 (TOMORROW!) 📊
Intel reports tomorrow after market close with massive expectations for the 18A foundry ramp:
- 🏭 18A Process: Fab 52 in Arizona entered high-volume manufacturing - first U.S. facility to surpass 2nm using High-NA EUV
- 🤝 External Customers: Microsoft and AWS signed as foundry customers
- 📈 Stock Performance: Intel rose from $19.95 (Aug 2025) to $37.01 (Oct 2025) after government support announcement - Stimson Center
- 💰 Government Support: $9.9B equity stake from Trump administration ($5.7B CHIPS Act + $3.2B DoD)
Nvidia Q4 FY2026 Earnings - February 25, 2026 (CRITICAL!) 🤖
The single most important catalyst for SMH given Nvidia's 18.9% weight:
- 🚀 Blackwell Revenue: Q3 delivered $11B (fastest product ramp ever), Q4 expectations even higher - Nvidia Newsroom
- 📊 Q3 Results Recap: Revenue $39.3B (+78% YoY), Data Center $35.6B (+93% YoY) - CNBC
- 🔥 Blackwell Status: Sold out through mid-2026 with 3.6M unit backlog
- 📈 Capacity Lock: Nvidia secured ~70% of TSMC's CoWoS-L advanced packaging capacity - CUDA Compute
✅ Recent Catalysts (Already Happened)
TSMC Q4 2025 Blowout - January 15, 2026 💰
TSMC delivered record results that validate the AI infrastructure thesis:
- 📊 Revenue: $33.73B (+25.5% YoY) - CNBC
- 💰 Net Income: ~$16.3B (+35% YoY) - Record quarter!
- 📈 EPS: NT$19.50 vs NT$18.12 estimate (beat!)
- 🎯 Gross Margin: 62.3% vs 60.6% estimate (massive beat!)
- 🚀 Q1 2026 Guidance: $34.6-35.8B vs $33.2B consensus - TrendForce
- 🏭 2026 CapEx Guidance: $52-56B (up from $40.9B in 2025) - massive AI investment!
China Export Policy Shift - January 13-14, 2026 🇨🇳
Mixed signals on chip export restrictions:
- 📜 BIS revised licensing policy for H200, MI325X chips - case-by-case review vs presumption of denial
- 💸 25% tariff imposed on AI chips destined for China - added cost burden
- ⚠️ China customs reportedly blocking H200 imports despite U.S. approval - Network World
🚀 Medium-Term Catalysts (Q1-Q2 2026)
Hyperscaler CapEx Explosion 💸
The AI infrastructure buildout continues at unprecedented pace - IEEE ComSoc:
| Company | 2026 CapEx Estimate | Focus |
|---|---|---|
| Amazon | $100+ billion | AWS AI infrastructure |
| Microsoft | ~$80-121 billion | Azure AI, OpenAI partnership |
| Meta | ~$100 billion | Llama models, Reality Labs |
| ~$85 billion | TPU infrastructure, Gemini |
Total 2026 Hyperscaler CapEx: Projected $600+ billion (+36% over 2025)
Memory Supercycle 2026 🧠
- 📈 HBM Market 2026: $54.6B (+58% YoY) - TrendForce
- 💰 HBM3E Price Increases: ~20% higher for 2026 deliveries - Korea Herald
- 🚀 Server DRAM Prices: Up to 70% increase projected in Q1 2026 - Data Center Dynamics
- 📊 Bank of America defines 2026 as "supercycle similar to 1990s boom" - The Register
Nvidia Vera Rubin Architecture - Late 2026 🔮
- 📅 Expected launch late 2026
- 🔬 TSMC 3nm process
- 💪 Combines GPU and CPU into single platform (successor to Grace Blackwell) - Wikipedia
🎲 Price Targets & Probabilities
Using gamma levels, implied move data, and the catalyst calendar, here are the scenarios through June 18, 2026:
📈 Bull Case (30% probability)
Target: $450-$480
How we get there:
- 💪 Intel earnings beat tomorrow with strong 18A customer pipeline and foundry momentum
- 🚀 Nvidia Q4 crushes expectations with Blackwell revenue exceeding $15B
- 📊 Memory chip earnings (Micron, SK Hynix, Samsung) show continued pricing power
- 💸 Hyperscaler CapEx guidance raised for 2026 (exceeding $600B projection)
- 🇺🇸 CHIPS Act investments deliver production milestones on schedule
- 📈 SMH breaks through $405-$410 gamma resistance and trends toward analyst target of $457.45 - TipRanks
Key metrics needed:
- Nvidia Data Center revenue growth >30% YoY
- TSMC maintaining 60%+ gross margins
- HBM pricing power continuing through H1 2026
- No major China export escalation
Call spread P&L at $450: ~$2.6M profit (+48% ROI on $5.4M cost) Call spread P&L at $480+: ~$3.5M profit (max gain, +65% ROI)
🎯 Base Case (50% probability)
Target: $410-$440 range
Most likely scenario:
- ✅ Solid earnings across semiconductor holdings meeting consensus
- 📈 SMH breaks through $405-$410 resistance as AI demand validated
- ⚖️ Guidance generally in-line to slightly above (AI momentum continues but priced in)
- 🇨🇳 China export situation stabilizes without major escalation
- 📊 ETF trades in $410-$440 range, consolidating 2025 gains
- 🎯 Call spread profitable as $420 long leg moves in-the-money
This is the call spread buyer's target scenario: SMH rallies to $420-$450 by June, long $420 calls are profitable, short $480 calls expire worthless or with minimal value. The spread nets $1.5-2.5M profit on $5.4M investment (28-46% ROI).
Why 50% probability: Strong fundamental backdrop with AI demand acceleration, but elevated valuations (46x P/E) and geopolitical uncertainty create headwinds. Gamma support at $400 provides floor, but $405-$410 resistance needs to break.
📉 Bear Case (20% probability)
Target: $370-$400 (below the $420 strike)
What could go wrong:
- 😰 Intel earnings disappoint - 18A yield issues or customer delays
- 📉 Nvidia Q4 guidance below expectations citing Blackwell production constraints
- 🇨🇳 China export restrictions tighten, removing significant revenue opportunity
- ⚠️ Memory pricing softens as inventory builds
- 💸 Hyperscaler CapEx guidance trimmed on ROI concerns
- 📊 SMH fails at $405-$410 resistance and pulls back to $390-$400 gamma support
- 🌐 Broader market correction drags semis lower (beta of 1.64 amplifies downside)
Critical support levels:
- 🛡️ $400: Major gamma floor (12.4B) - MUST HOLD or momentum shifts bearish
- 🛡️ $390: Secondary support (11.1B gamma) - 3% below current
- 🛡️ $380: Deep support at 6.9B gamma - 5.5% below current
Call spread P&L at $400: -$5.4M loss (100% of premium) Call spread P&L at $420 (at strike): -$5.4M loss (100% of premium)
💡 Trading Ideas
🛡️ Conservative: Wait for Earnings Clarity
Play: Stay on sidelines until Intel (tomorrow) and Nvidia (Feb 25) earnings clear
Why this works:
- ⏰ Two major catalysts in next 35 days create binary event risk
- 💸 Implied volatility elevated pre-earnings - options are expensive
- 📊 SMH at all-time high resistance ($405) - needs confirmation to break higher
- 🎯 Better entry likely after earnings volatility settles
- 🤔 The call spread trade signals smart money expects rally BUT you don't need to front-run it
Action plan:
- 👀 Watch Intel earnings tomorrow for 18A foundry commentary and customer traction
- 📊 Monitor SMH price action around $400 support and $405 resistance
- ⏰ After Nvidia Feb 25 earnings, reassess if breakout confirmed
- 🎯 Look for pullback to $390-$400 gamma support for better risk/reward entry
- ✅ If SMH breaks above $410 convincingly, consider following the institutional flow
Risk level: Minimal (cash position) | Skill level: Beginner-friendly
⚖️ Balanced: Follow the Flow with Smaller Call Spread
Play: Copy the institutional positioning with a smaller, cheaper spread
Structure:
- Buy SMH20260321C410 (March 20 $410 calls)
- Sell SMH20260321C440 (March 20 $440 calls)
Why this works:
- 🎯 Similar bullish thesis but shorter timeframe (58 days vs 148 days)
- 💸 Lower capital outlay (~$1,500-2,000 per spread vs institutional millions)
- 📊 Captures Intel and Nvidia earnings plus March triple witch expiration
- ⚖️ Defined risk with $30 wide spread (max loss = premium paid)
- 🎢 Implied move to March is ±9.82% ($39.12) - $410 strike is achievable
Estimated P&L:
- 💰 Cost: ~$15-20 per spread ($1,500-2,000 for 1 contract)
- 📈 Max profit: ~$10-15 per spread if SMH above $440 at March expiration
- 🎯 Breakeven: ~$425-430
- 📉 Max loss: Premium paid if SMH below $410
Entry timing:
- ⏰ Wait for Intel earnings reaction (Jan 23)
- 🎯 Enter if SMH holds above $400 support and shows strength
- ❌ Skip if SMH breaks below $395 (thesis invalidated)
Position sizing: Risk 3-5% of portfolio (defined-risk directional play)
Risk level: Moderate | Skill level: Intermediate
🚀 Aggressive: Earnings Momentum Play (ADVANCED!)
Play: Buy short-dated calls betting on positive Intel/Nvidia earnings momentum
Structure: Buy SMH20260220C410 (February 20 $410 calls)
Why this could work:
- 💥 Captures both Intel (Jan 22) and Nvidia (Feb 25) earnings reactions
- 🚀 If TSMC's blowout is any guide, AI chip earnings should be strong
- 📈 Monthly OPEX implied move of ±6.85% means $425 upside possible
- ⚡ Shorter duration means lower premium but higher leverage
- 🎯 Gamma levels show $400 support and $410 as key breakout level
Why this could blow up (SERIOUS RISKS):
- 💸 Time decay: Theta burns hard with only 30 days to expiration
- 😱 Binary earnings risk: Intel or Nvidia miss could crush the trade overnight
- 📊 Breakout required: Need SMH to break through $405-$410 resistance to profit
- ⚠️ China wildcard: Any export restriction news could crater semis
- 🎢 IV crush: Even positive earnings could see volatility collapse hurt option value
Estimated P&L:
- 💰 Cost: ~$8-10 per contract ($800-1,000 per contract)
- 📈 Profit scenario: SMH at $425 by Feb 20 = ~$15 value, $5-7 profit (50-70% ROI)
- 📉 Loss scenario: SMH below $410 = lose 80-100% of premium
CRITICAL WARNING - DO NOT attempt unless you:
- ✅ Can afford to lose ENTIRE premium
- ✅ Understand binary earnings risk
- ✅ Will actively manage position through earnings events
- ✅ Have experience with short-dated options
Risk level: HIGH | Skill level: Advanced only
⚠️ Risk Factors
Don't get caught by these potential landmines:
-
⏰ Intel earnings TOMORROW (Jan 22): Results after market close create immediate binary risk. 18A foundry progress and customer wins are critical - any disappointment at current $37+ price (up 85% from August lows) could trigger 10-15% correction. Intel is 3.5% of SMH.
-
🚀 Nvidia earnings Feb 25 is THE catalyst: With 18.9% weight in SMH, Nvidia drives the ETF. Blackwell demand is priced to perfection - any production constraints, China revenue headwinds, or conservative guidance could spark 15-20% Nvidia correction = 3-4% SMH hit. - Wall Street Horizon
-
💰 Valuation stretched at 46x P/E: SMH trades near 3-year average P/E of 51.8x but at all-time price highs. Semiconductors are the largest S&P 500 industry group - this is a "crowded trade." Technical analysts note negative divergence forming after unprecedented momentum in 2024. - Sourceability, StockCharts
-
🇨🇳 China export restrictions remain wildcard: Policy shifted in January but Chinese customs reportedly blocking H200 imports anyway. Taiwan invasion risk remains "black swan" concern. Any escalation could remove 15-20% of revenue overnight for Nvidia and AMD. - Network World
-
🔌 "Power Wall" emerging as constraint: Grid capacity may limit data center expansion plans. Only ~25% of AI initiatives have delivered expected ROI to date. If hyperscaler spending slows, ripple effects through entire supply chain. - CreditSights
-
📊 Gamma ceiling at $405-$410 creates natural resistance: 5.8B call gamma at $405 and 7.3B at $410 means market makers will systematically SELL into rallies to hedge. SMH has bounced off this zone multiple times - needs significant buying pressure to break through.
-
🎢 High beta (1.64) amplifies both gains AND losses: SMH moves 64% more than the broader market. In a risk-off environment or market correction, expect SMH to significantly underperform. The 2024 March selloff saw 15%+ drawdown in weeks.
-
📉 CHIPS Act future uncertain: Trump administration called it "horrible, horrible thing" - future funding rounds may be at risk. Intel's $9.9B government investment was a special case; broader CHIPS support unclear. - Stimson Center
🎯 The Bottom Line
Real talk: An institutional player just bet $6.8 MILLION that SMH rallies from $402 to $420+ by June 2026. This is a well-structured, defined-risk trade that captures the AI semiconductor supercycle thesis while capping upside at $480 (keeping costs reasonable). The timing is significant - TSMC just crushed earnings last week, Intel reports tomorrow, and Nvidia's February earnings will be the biggest catalyst of the quarter.
What this trade tells us:
- 🎯 Smart money expects SMH to break through current $405 resistance and trend toward $420-$450
- ⏰ They're betting on 148 days of semiconductor momentum through June triple witch
- 📊 The $420 strike is 4.4% above current price - achievable if AI demand thesis holds
- ⚖️ Selling the $480 calls shows measured optimism (not betting on moonshot)
- 🔥 Z-score of 42.76 means this size trade happens maybe a few times per year
This is a BULLISH signal from informed players who follow the chip cycle closely.
If you're bullish on semis:
- ✅ The call spread structure (long $420, short $480) is smart risk management you can copy at smaller scale
- 📊 Consider March expiration ($410/$440 spread) for lower capital outlay and faster feedback
- ⏰ Wait for Intel earnings reaction tomorrow before entering
- 🎯 Look for SMH to hold $400 support and break $410 as confirmation signal
- 🛡️ Set mental stop at $395 - if that breaks, the bullish thesis weakens significantly
If you're watching from sidelines:
- ⏰ Tomorrow (Jan 22) Intel earnings after close - first major data point
- 📅 February 25 Nvidia earnings - THE catalyst for SMH direction
- 🎯 Pullback to $390-$400 gamma support would be excellent entry opportunity
- 📊 Analyst consensus target of $457.45 (+14% upside) with Strong Buy rating - TipRanks
- 🚀 Longer-term thesis (12 months): Semiconductor industry approaching $1 trillion revenue milestone - Deloitte
If you're concerned about downside:
- 🛡️ $400 gamma support is THE level to watch - major institutional interest there
- 📉 Break below $395 would suggest consolidation to $380-$390 range
- ⚠️ Bear case floor around $360-$370 if multiple negative catalysts align
- 🎯 Consider protective puts or collar strategies if holding large semiconductor positions
Mark your calendar - Key dates:
- 📅 January 22 (Wednesday) after close - Intel Q4 2025 earnings
- 📅 January 23 (Thursday) - Weekly OPEX, Intel earnings reaction
- 📅 February 20 - Monthly OPEX (±6.85% implied move window)
- 📅 February 25 (Wednesday) after close - Nvidia Q4 FY2026 earnings (CRITICAL!)
- 📅 March 20 - Quarterly triple witch
- 📅 June 18 - Triple witch, this $6.8M call spread expiration
Final verdict: The semiconductor AI supercycle is real - TSMC's blowout earnings proved demand is not slowing. KPMG reports 93% of industry leaders expect revenue growth in 2026, and hyperscaler CapEx is projected to exceed $600 billion. This call spread trade captures that thesis with defined risk. The key question is whether SMH can break through the $405-$410 resistance zone - Intel and Nvidia earnings will provide the answer.
Be patient through earnings. Follow the smart money. Let the thesis prove itself.
This is a strong setup, but never bet more than you can afford to lose. 💪
Disclaimer: Options trading involves substantial risk of loss and is not suitable for all investors. This analysis is for educational purposes only and not financial advice. Past performance doesn't guarantee future results. SMH is an ETF that tracks semiconductor stocks - individual holdings may perform differently than the index. The call spread buyer may have portfolio hedging needs or information not available to retail traders. Always do your own research and consider consulting a licensed financial advisor before trading. Earnings create binary event risk with potential for significant gaps in either direction.
About VanEck Semiconductor ETF (SMH): SMH tracks the MVIS US Listed Semiconductor 25 Index, providing exposure to the largest U.S.-listed semiconductor companies including Nvidia, TSMC, Broadcom, AMD, and Micron. With $43.46B in AUM and a 0.35% expense ratio, it's the most liquid semiconductor ETF for options trading.