🚀 SMH $9.1M Call Sweep - Smart Money Loading Up on Semiconductors Before Earnings Avalanche!
January 28, 2026 | Unusual Activity Detected
The Quick Take
Someone just dropped $9.1 MILLION on SMH calls across two aggressive sweeps this morning - BOTH filled ABOVE the ask price, showing extreme urgency to get positioned! With ASML posting record orders 109% above consensus today and three mega-cap semiconductor earnings on deck (AMD Feb 3, Qualcomm Feb 4, NVIDIA Feb 25), institutional money is making a bold bet that the AI chip rally has more room to run. Translation: Big money is paying UP for semiconductor exposure heading into the most catalyst-dense month of the year.
ETF Overview
VanEck Semiconductor ETF (SMH) is the go-to ETF for concentrated exposure to the world's largest semiconductor companies, traded on the Nasdaq:
- AUM: $35.6 Billion
- Current Price: ~$414-416 (near 52-week high of $409.39)
- P/E Ratio: 42.6x (TTM)
- 1-Year Return: +59.9% (vs S&P 500 ~+16%)
- Expense Ratio: 0.35%
- Top Holdings: NVIDIA (19.1%), TSMC (10.4%), Broadcom (7.0%), Micron (6.4%), ASML (5.8%), AMD (5.5%)
- Top 10 Concentration: ~73% of total assets - this is essentially a bet on 10 companies driving the AI chip revolution
The Option Flow Breakdown
The Tape (January 28, 2026):
| Time | Symbol | Side | Buy/Sell | Type | Expiration | Premium | Strike | Volume | OI | Size | Spot | Option Price |
|---|---|---|---|---|---|---|---|---|---|---|---|---|
| 10:22:50 | SMH | ABOVE ASK | BUY | CALL $410 | 2026-02-20 | $5.5M | $410 | 6.6K | 7K | 3,182 | $414.10 | $17.24 |
| 09:37:32 | SMH | ABOVE ASK | BUY | CALL $430 | 2026-02-20 | $3.6M | $430 | 4.3K | 3.6K | 4,276 | $415.41 | $8.39 |
What This Actually Means
Two large call purchases hit the tape this morning, both with the same February 20 expiration - and here is where it gets interesting:
-
Trade 1 ($5.5M, $410 strike calls): Classified as BTO (Buy to Open) - this is a brand-new bullish position. The $410 strike is already in-the-money with SMH at $414, giving this trade immediate delta exposure. Z-score of 11.22 (EXTREMELY UNUSUAL). This trader wants EXPOSURE, not leverage.
-
Trade 2 ($3.6M, $430 strike calls): Classified as BTC (Buy to Close) - someone is CLOSING a short call position. With $430 calls 3.7% out-of-the-money, a previous seller is buying back their short calls, likely because they're worried SMH will blow through $430 before February OPEX. Z-score of 8.36 (EXTREMELY UNUSUAL).
-
BOTH trades filled ABOVE the ask price - this means the buyers were willing to PAY MORE than the listed offer to ensure they got filled immediately. You don't pay above ask unless you absolutely NEED to be in this position right now. That is extreme urgency.
-
Combined $9.1M in premium represents conviction that SMH is heading higher through February 20 OPEX, which captures AMD earnings (Feb 3), Qualcomm earnings (Feb 4), and NVIDIA earnings (Feb 25 - just 5 days after expiration, but the run-up matters).
What is really happening here: The BTO on the $410 calls is a directional bullish bet - someone is paying $17.24/contract for ITM calls with 23 days to expiration, controlling 318,200 shares (~$132M notional). The BTC on the $430 calls tells us a previous call seller is getting SCARED - they're paying $3.6M to exit a short position before semiconductor earnings potentially rip the ETF higher. Both signals point the same direction: UP.
Unusual Score: EXTREME (Z-scores of 11.22 and 8.36) - These trades are roughly 8-11x the statistical threshold for unusual activity. This level of flow happens maybe a few times per quarter on SMH.
Technical Setup / Chart Check-Up
YTD Performance Chart
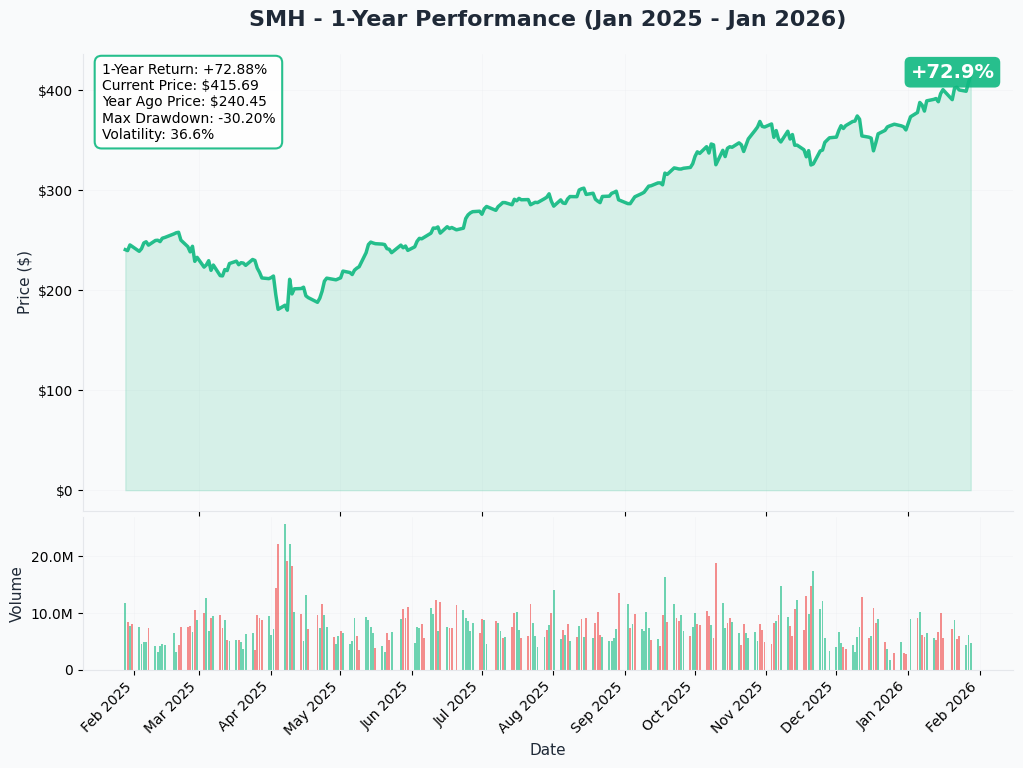
SMH is having an exceptional run - up roughly +60% over the past year and hitting fresh 52-week highs near $416. The ETF has massively outperformed the S&P 500 (+16%) as the AI semiconductor supercycle enters its third year.
Key observations:
- 📈 New highs: Trading at or near 52-week high of $409.39, with momentum firmly to the upside
- 🚀 January surge: Up nearly +10% in just the past month, fueled by TSMC and ASML earnings beats
- 💪 Relentless bid: Every dip has been bought aggressively as hyperscaler capex projections keep getting revised higher
- 📊 Volume confirmation: Strong institutional accumulation throughout Q4 2025 and into January 2026
- ⚠️ Extended move: After a 60% annual gain, some consolidation or mean reversion risk is real
Gamma-Based Support & Resistance Analysis
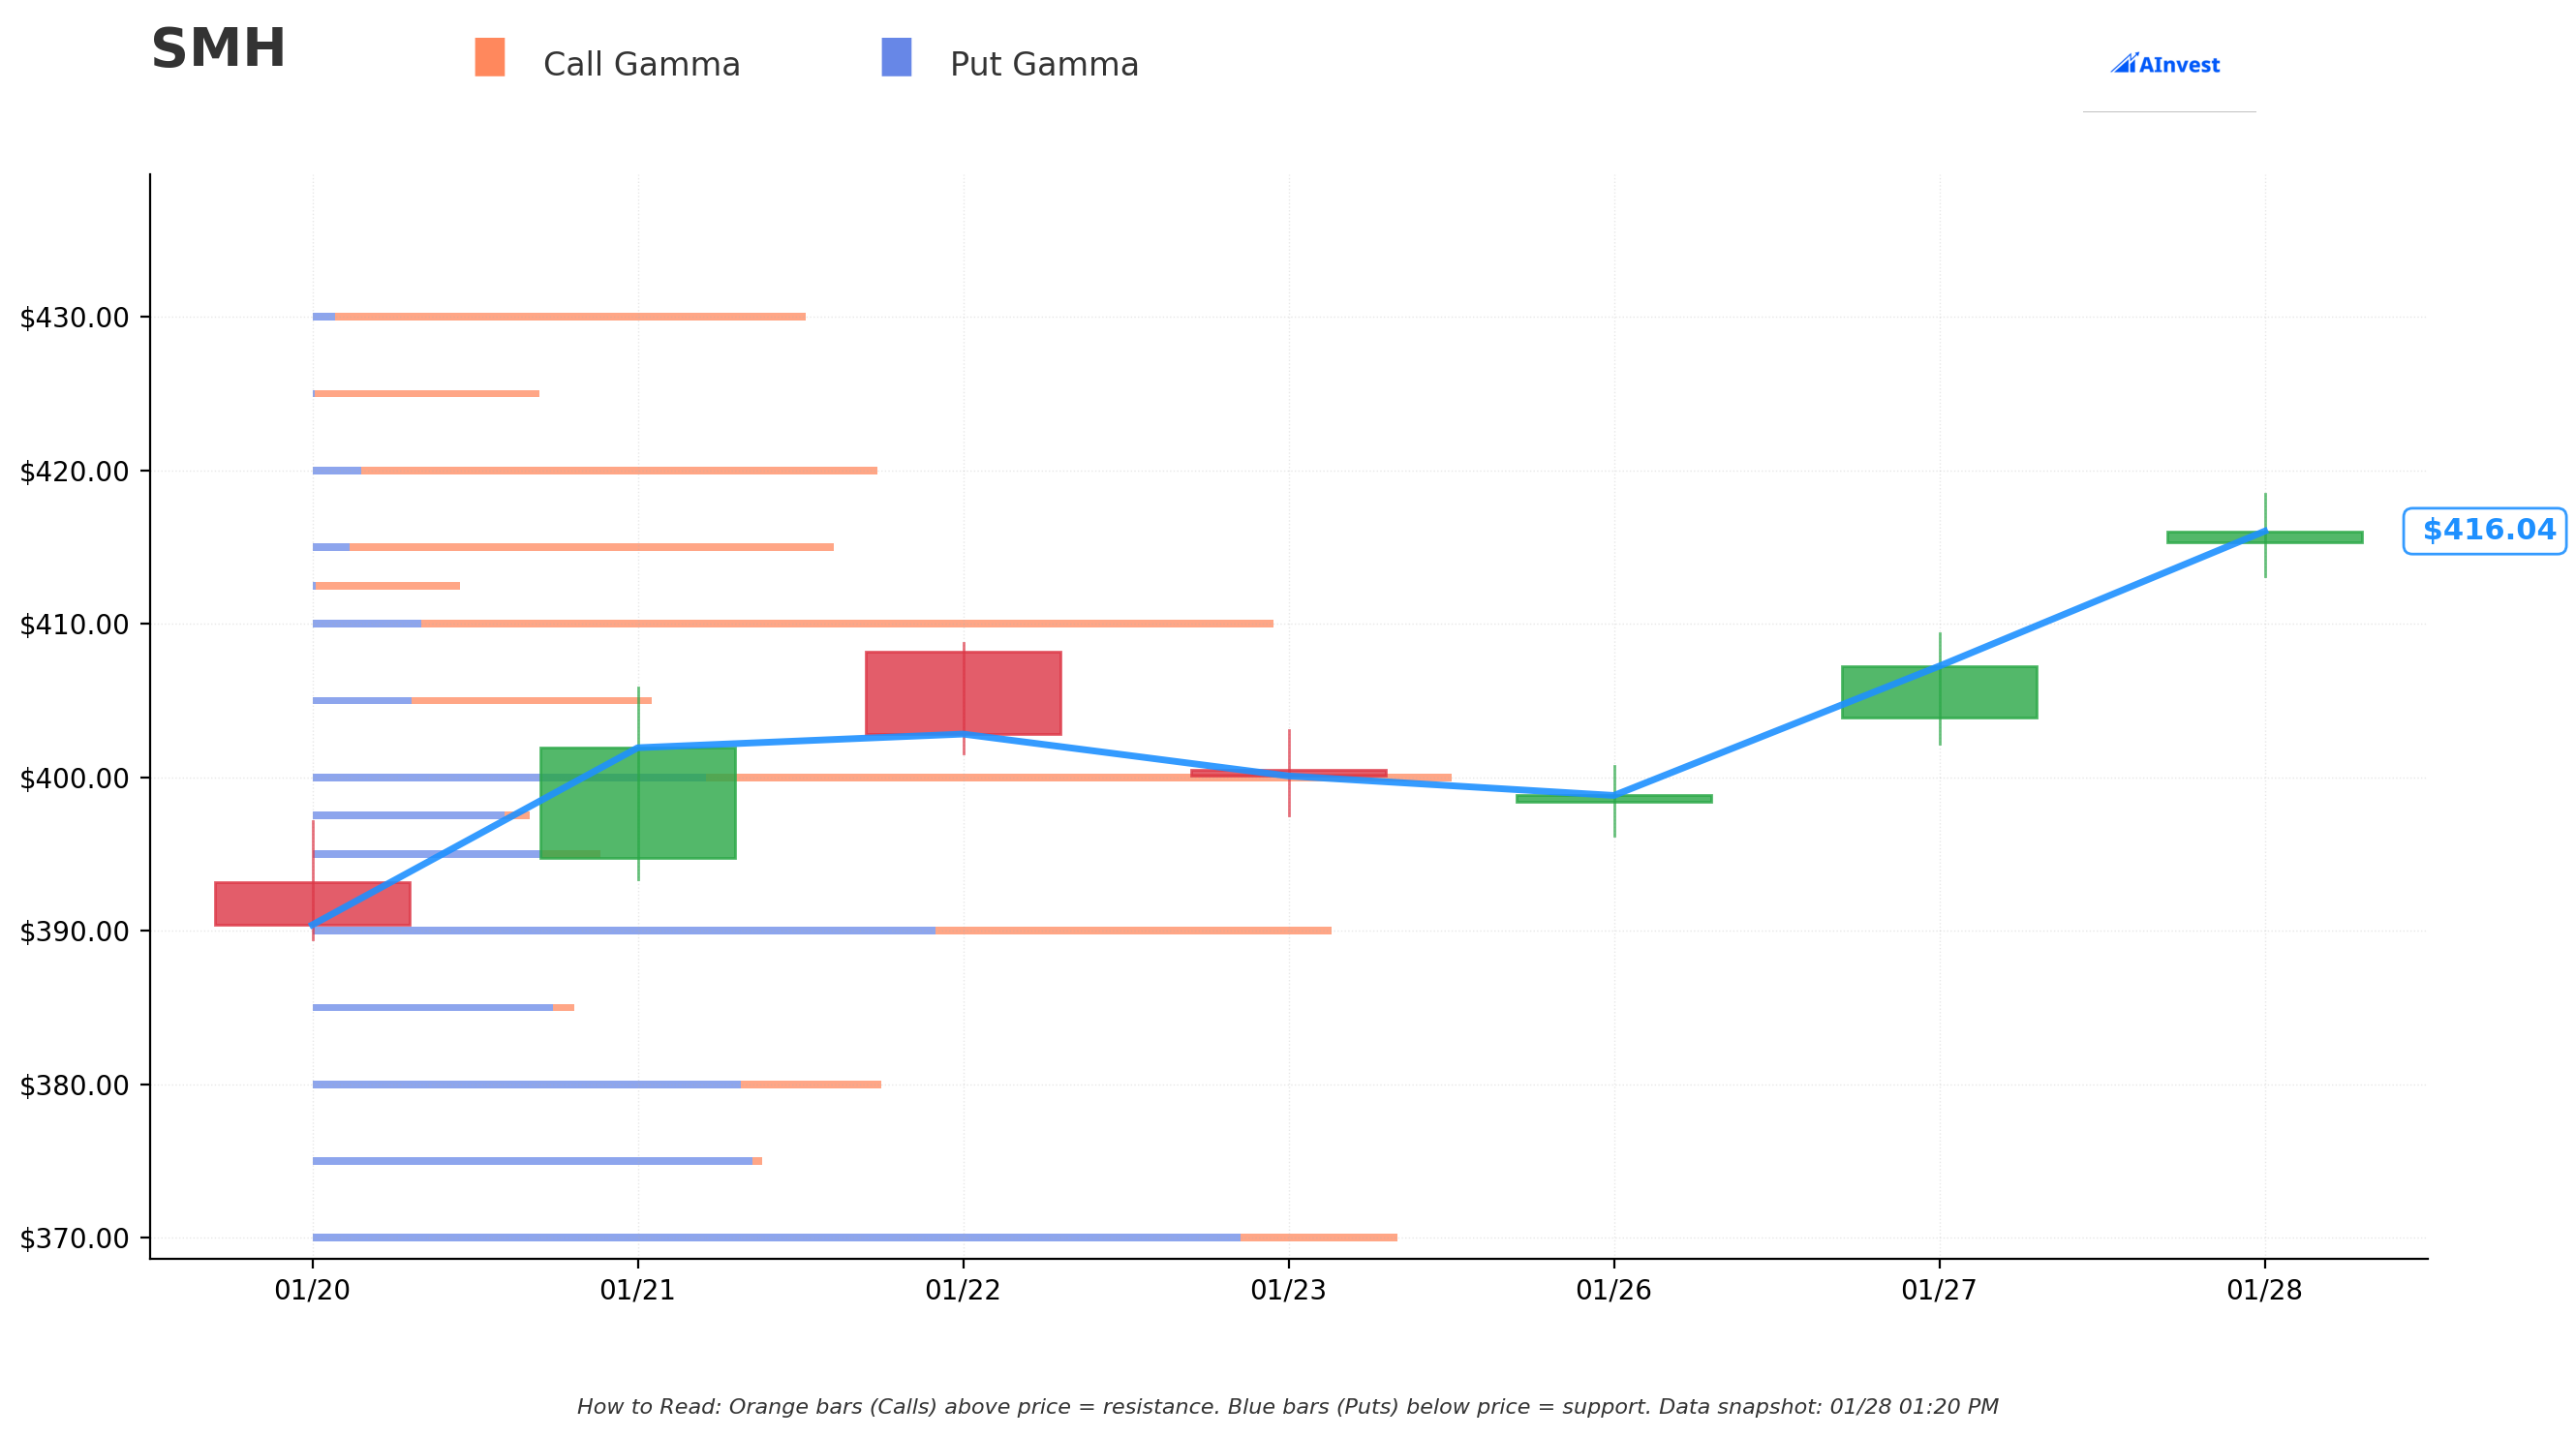
Current Price: $416.16
The gamma exposure map reveals critical price magnets and barriers that will govern near-term price action:
Support Levels (Put Gamma Below Price):
- $415 - Immediate support with 5.0B total gamma exposure (strongest nearby floor, just 0.3% below)
- $410 - Secondary support at 9.2B gamma (THIS IS WHERE THE $5.5M CALL TRADE STRUCK - not coincidental!)
- $400 - Major structural floor with 11.0B gamma (round number + high gamma = strong support, 3.9% below)
- $390 - Extended support at 9.9B gamma (6.3% below, net GEX turns negative here)
- $370 - Deep support with 10.5B gamma (11.1% below, heaviest put gamma concentration)
Resistance Levels (Call Gamma Above Price):
- $420 - Immediate ceiling with 5.4B gamma (nearest resistance, only 0.9% overhead)
- $430 - Secondary resistance at 4.8B gamma (THIS IS THE $3.6M CALL STRIKE - the level someone was short and had to cover!)
What this means for traders: SMH is trading in a constructive zone between solid $410-$415 support and nearby $420-$430 resistance. The gamma data shows net GEX is bullish (67.2B call gamma vs 58.9B put gamma), meaning dealer hedging flows generally support the upside. The $410 level with 9.2B gamma is THE critical support - exactly where the institutional call buyer struck their position. If SMH holds above $410, the path to $420 and then $430 is clear.
Notice anything? The call buyer picked the $410 strike precisely at the strongest gamma support zone below current price. They're buying at a level where dealers will aggressively buy dips - smart positioning. Meanwhile, the $430 strike where someone covered their short sits right at the next major gamma resistance - they clearly believe SMH can reach or exceed that level.
Net GEX Bias: Bullish (67.2B call gamma vs 58.9B put gamma) - Overall dealer positioning supports continued upside, though $420 and $430 are levels where some selling pressure will emerge.
Implied Move Analysis
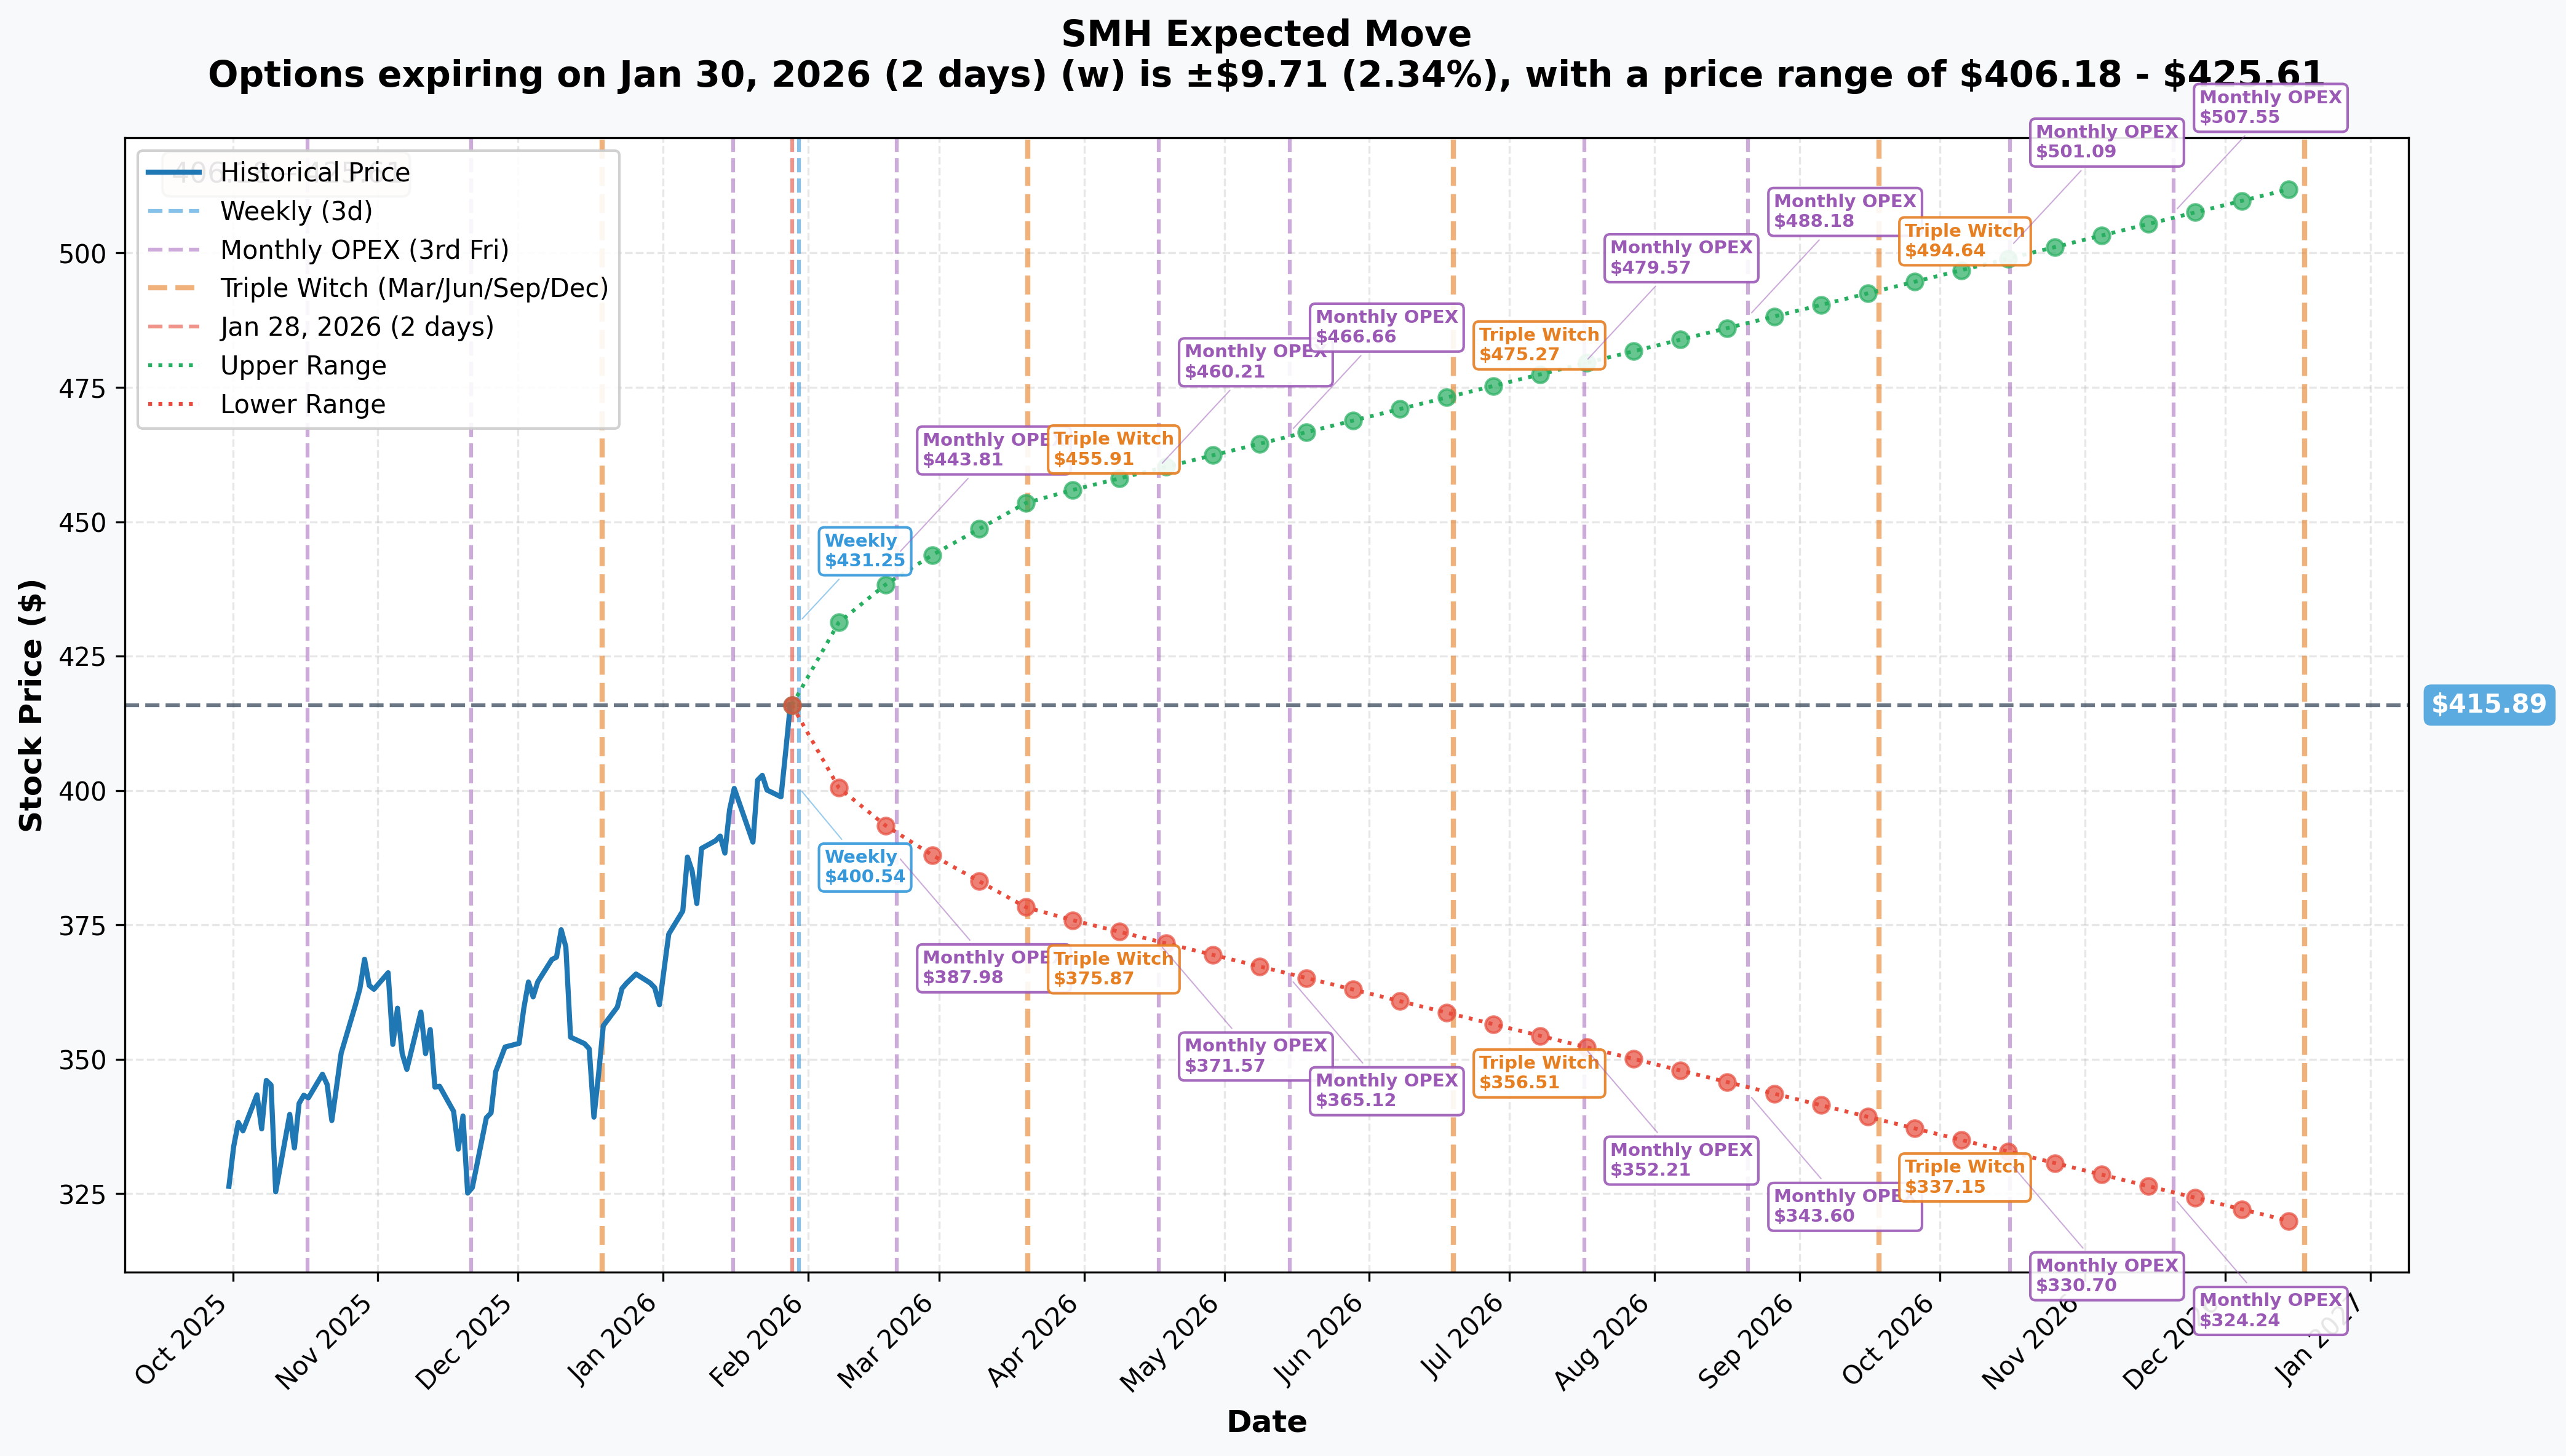
Options market pricing for upcoming expirations:
- Weekly (Jan 30 - 2 days): +/-$9.71 (+/-2.3%) - Range: $406.18 - $425.61
- Monthly OPEX (Feb 20 - 23 days - THESE TRADES!): +/-$24.52 (+/-5.9%) - Range: $391.37 - $440.42
- Quarterly Triple Witch (Mar 20 - 51 days): +/-$38.08 (+/-9.2%) - Range: $377.81 - $453.97
- Yearly LEAPS (Dec 18 - 324 days): +/-$96.81 (+/-23.3%) - Range: $319.08 - $512.71
Translation for regular folks: Options traders are pricing in a 5.9% move ($24.52) through the February 20 OPEX - the exact expiration of both call trades. That means the market expects SMH could reasonably trade anywhere from $391 to $440 over the next 23 days. The upper range of $440 aligns with the $430 call strike being in-the-money by $10 - the short seller who covered clearly believes that scenario is possible.
The implied move range is WIDE because of the stacked earnings calendar: AMD (Feb 3), Qualcomm (Feb 4), and NVIDIA (Feb 25). Each of these reports can independently swing SMH 2-4%, and with three in rapid succession, the compounding effect justifies elevated implied volatility.
Key insight: The $410 call buyer needs SMH above $427.24 ($410 strike + $17.24 premium) at expiration to profit. That is only 2.7% above current price and well within the implied move upper range of $440. This is a high-probability directional bet, not a lottery ticket.
Catalysts
Immediate Catalysts (Today and This Week)
ASML Q4 2025 Earnings - January 28, 2026 (TODAY!)
ASML just reported record-smashing results that are fueling today's semiconductor rally:
- 📊 Record orders: EUR 13.2B vs EUR 6.32B expected - a staggering 109% beat
- 💰 EUV bookings: EUR 7.4B of the total, showing insatiable demand for cutting-edge lithography
- 📈 2026 guidance: Sales EUR 34B-39B, above EUR 35.1B consensus
- 🚀 Stock surged 7% on the news
- 💸 Announced EUR 12B share buyback + 17% dividend increase
This is THE catalyst driving today's unusual options activity. ASML's record orders confirm that chip manufacturers are investing aggressively for 2026-2027 production - bullish for the entire semiconductor supply chain.
Near-Term Catalysts (Next 30 Days)
AMD Q4 2025 Earnings - February 3, 2026 (6 DAYS!)
AMD reports fiscal Q4 and full year 2025 results next Tuesday. Key expectations:
- 📊 Revenue: ~$9.6B (+25% YoY) per Q3 guidance
- 🤖 Data Center: Record trajectory after $4.3B in Q3 (+22% YoY)
- 🎯 MI350 GPU traction commentary will be critical for AI thesis
- 📈 AMD is 5.5% of SMH - a strong beat could add 1-2% to the ETF
Qualcomm Q1 FY2026 Earnings - February 4, 2026 (7 DAYS!)
Qualcomm reports the day after AMD:
- 📱 Snapdragon X Elite PC adoption rate
- 🚗 Automotive revenue growth trajectory
- 📊 Qualcomm is ~4% of SMH
NVIDIA Q4 FY2026 Earnings - February 25, 2026 (28 DAYS!)
This is THE big one. NVIDIA reports with revenue consensus around $65.4B, representing ~50% YoY growth:
- 📊 Revenue: ~$65.4B consensus - Blackwell architecture ramp is the key variable
- 💰 NVIDIA is 19.1% of SMH - the single largest holding. A 10% NVIDIA move = ~2% SMH move
- 🚀 Data center margins and forward guidance will set the tone for the entire sector
- ⚠️ This report falls 5 days AFTER the February 20 expiration of these trades, but the anticipatory run-up will impact pricing
Recent Catalysts (Already Priced In)
TSMC Q4 2025 Beat (January 15)
TSMC crushed estimates with NT$1.046T revenue (+3.2% above consensus) and guided Q1 2026 revenue to $34.6B-$35.8B with 63-65% gross margins. Full-year 2026 growth guided at ~30% - massive for a $800B+ company.
Micron Record Q1 FY2026 (December 17, 2025)
Micron delivered $13.64B revenue (+57% YoY) with ALL 2026 HBM supply committed on price and volume. Guided Q2 to a stunning $18.7B revenue with 67% gross margins.
Broadcom Q4 FY2025 Record (December 11, 2025)
Broadcom posted $18.0B in quarterly revenue (+28% YoY) with AI semiconductor revenue up 74% and expected to double to $8.2B in Q1 FY2026.
Intel Q4 2025 - The One Blemish (January 23)
Intel beat lowered expectations but guided Q1 2026 to breakeven EPS, with foundry losses of $2.5B in Q4 alone. Stock plummeted 12% - but Intel is only 1.7% of SMH, so the impact was minimal.
Price Targets & Probabilities
Using gamma levels, implied move data, and the catalyst-dense earnings calendar, here are the scenarios through the February 20 expiration:
Bull Case (30% probability)
Target: $435-$445
How we get there:
- 💪 AMD CRUSHES Q4 estimates with revenue above $10B, MI350 traction exceeding expectations
- 🚀 Qualcomm delivers strong results with AI-on-device momentum building
- 📈 Pre-NVIDIA earnings run-up pushes semis higher as Street raises estimates toward $70B+ revenue
- 🌐 Hyperscaler capex projections revised HIGHER from $600B as AI spending accelerates
- 📊 ASML's record orders today set a bullish tone for the entire February earnings season
- 🎯 Break above $420 gamma resistance triggers momentum buying to $430, then $440+ implied move upper range
P&L for call positions:
- $410 calls at $440: Worth $30, cost $17.24 = $12.76 profit (74% ROI)
- $430 calls at $440: Worth $10, vs $8.39 cost = $1.61 profit (19% ROI)
Probability assessment: 30% because it requires multiple earnings beats in sequence AND sustained momentum. ASML's blowout today makes this more plausible than usual. The implied move upper range of $440 supports this target.
Base Case (50% probability)
Target: $410-$430 range (GRIND HIGHER WITH VOLATILITY)
Most likely scenario:
- ✅ AMD meets or modestly beats consensus (~$9.6-9.8B revenue)
- 📱 Qualcomm delivers in-line results, no major surprise
- 📊 SMH consolidates recent gains in the $410-$425 range ahead of NVIDIA earnings
- ⚖️ Some profit-taking after ASML spike, but buyers emerge on dips to $410-$415 gamma support
- 🔄 Implied volatility stays elevated ahead of NVIDIA Feb 25 report, keeping option premiums firm
- 📈 Net drift higher as sector sentiment remains bullish but not euphoric
P&L for call positions:
- $410 calls at $420: Worth $10, cost $17.24 = -$7.24 loss (-42%) (time value erodes)
- $410 calls at $430: Worth $20, cost $17.24 = $2.76 profit (16%)
Why 50% probability: The call buyer at $410 has a reasonable setup - already ITM with strong gamma support below. But needs SMH above $427 at expiration to profit, which requires continued upside momentum through multiple earnings events. The base case is choppy action within the implied move range.
Bear Case (20% probability)
Target: $390-$410 (EARNINGS DISAPPOINTMENT)
What could go wrong:
- 😰 AMD misses or guides conservatively - data center growth decelerating, MI350 delays
- 🚨 New semiconductor tariff escalation beyond current 25% - Phase 2 broader tariffs announced unexpectedly
- 🇨🇳 China retaliates with expanded soft boycott of U.S. chips or rare earth export restrictions tightened
- 💸 Profit-taking cascade after 60% annual gain - "sell the news" on ASML results
- 📉 Cycle overheating concerns - "ASP-led, not unit-driven" growth thesis gains traction
- 🔨 Break below $410 gamma support triggers cascade toward $400 and then $390
P&L for call positions:
- $410 calls at $400: Worth $0, cost $17.24 = -$17.24 total loss (-100%)
- $430 calls at $400: Worth $0, cost $8.39 = -$8.39 total loss (-100%)
Probability assessment: Only 20% because it requires fundamental disappointment against a backdrop of record TSMC, ASML, Micron, and Broadcom results. The weight of evidence from recent earnings is overwhelmingly bullish. But tariff escalation is a genuine wildcard that could override fundamentals.
Trading Ideas
Conservative: Ride the Momentum with ITM Calls
Play: Buy February 20 $405 or $410 ITM calls
Why this works:
- 🎯 Already in-the-money, so you have immediate delta exposure without needing a big move
- 📊 $410 gamma support at 9.2B provides a natural floor - exactly what the institutional buyer identified
- 🚀 Three earnings catalysts (AMD, QCOM, NVDA anticipation) provide upside fuel within the expiration window
- 📈 ASML's blowout today confirms the semiconductor demand narrative heading into earnings season
- 🛡️ ITM options have lower break-even risk than OTM lottery tickets
Estimated P&L:
- 💰 Cost: ~$15-18 per contract for $410 calls
- 📈 Target: SMH at $430 by Feb 20 = ~$12-15 profit (70-100% ROI)
- 📉 Stop: Close if SMH breaks below $405 (below gamma support)
- 🎯 Breakeven: ~$425-428
Position sizing: Risk 3-5% of portfolio. This is a defined-risk directional bet.
Risk level: Moderate | Skill level: Intermediate
Balanced: Call Spread Targeting Gamma Resistance
Play: Buy $410 calls, sell $430 calls (February 20 expiration - SAME as both institutional trades)
Why this works:
- 📊 Defined risk spread ($20 wide = $2,000 max profit per spread)
- 💸 Selling the $430 call reduces cost significantly vs buying naked $410 calls
- 🎯 Targets the exact range between gamma support ($410) and resistance ($430) - the institutional "sweet spot"
- 🤝 You are literally bracketing the SAME two strikes where $9.1M in institutional flow just landed
- ⏰ 23 days to expiration captures AMD and Qualcomm earnings plus NVIDIA anticipation
Estimated P&L:
- 💰 Cost: ~$8-10 net debit per spread
- 📈 Max profit: $10-12 if SMH above $430 at expiration (100-120% ROI)
- 📉 Max loss: $8-10 if SMH below $410 (the debit paid)
- 🎯 Breakeven: ~$418-420
- 📊 Risk/Reward: ~1:1.2 with probability weighted to the upside given current momentum
Position sizing: Risk 2-4% of portfolio. Defined risk makes this manageable.
Risk level: Moderate | Skill level: Intermediate
Aggressive: Pre-NVIDIA Run-Up OTM Calls
Play: Buy March 20 $440 or $450 calls to capture the full NVIDIA earnings cycle
Why this works:
- 🚀 NVIDIA is 19% of SMH - a blowout quarter could single-handedly push SMH 3-4% higher
- 📊 March expiration captures ALL three earnings (AMD Feb 3, QCOM Feb 4, NVDA Feb 25) plus post-earnings follow-through
- 💥 Revenue consensus ~$65.4B but whisper numbers could be higher given TSMC/ASML strength
- 📈 Implied move upper range of $454 for March supports $440-450 target
- ⚡ Historical pattern: semis tend to rally into NVIDIA earnings as expectations build
- 🎯 Hyperscaler capex of $600B+ provides fundamental backdrop for continued semiconductor strength
Why this could blow up:
- 💸 OTM calls have aggressive theta decay - you need a MOVE, not just time passing
- 📉 Any AMD or Qualcomm disappointment could stall momentum before NVIDIA reports
- 🇨🇳 Tariff escalation or China export control changes could torpedo the entire sector overnight
- 😱 At 42.6x P/E, SMH is priced for perfection - bad news gets amplified
- ⏰ If SMH consolidates $410-$420 for three weeks, these calls bleed to zero
Estimated P&L:
- 💰 Cost: ~$6-10 per contract for $440 calls, ~$4-7 for $450 calls
- 📈 Home run: SMH hits $455 = $15 value on $440 calls (150%+ ROI)
- 📉 Loss scenario: SMH stays below $435 = lose most of premium
- 💀 Total loss: SMH pulls back to $400 = 100% loss
Risk level: HIGH | Skill level: Advanced only
Risk Factors
Do not get caught by these potential landmines:
-
🎢 Earnings concentration risk over 30 days: AMD (Feb 3), Qualcomm (Feb 4), and NVIDIA (Feb 25) all report within 23 days. Each report is a binary event for SMH. A strong beat from AMD could push SMH to $425, but a miss could drop it to $405. NVIDIA carries the most weight at 19% of the ETF - a 10% NVIDIA decline alone would cause ~2% SMH drawdown. Three earnings in rapid succession means compounding volatility risk.
-
🇨🇳 Tariff and trade policy escalation: The White House already imposed 25% tariffs on select semiconductor categories effective January 15, with broader Phase 2 tariffs still under negotiation. ITIF warns 25% blanket tariffs could cause 24% decline in U.S. ICT capital in Year 1. This is a genuine overnight risk that could gap SMH down 5-10% with zero warning.
-
🇨🇳 China export controls remain a wildcard: Despite H200 export easing, Chinese customs has reportedly ordered a soft boycott of NVIDIA chips. The BIS Affiliates Rule suspension expires November 2026 - renewal or reimposition is a binary risk event. China's rare earth export controls on gallium, germanium, and antimony threaten the supply side.
-
📊 Cycle overheating concerns: Future Horizons warns 2025 semiconductor growth was "ASP-led, not unit-driven" - historically an unstable pattern. AI demand may be masking excess capex, bloated inventories, and structural imbalances. When growth is driven by price increases rather than volume, corrections tend to be sharp.
-
💸 Hyperscaler capex sustainability is NOT guaranteed: $600B+ in 2026 capex requires hyperscalers to spend 94% of operating cash flow (per Bank of America). Any slowdown, pause, or ROI skepticism from Amazon, Google, Microsoft, or Meta would ripple through the entire semiconductor chain. Capital intensity at 57% for Oracle and 45% for Microsoft is at historic levels.
-
📉 Valuation stretched at 42.6x P/E: SMH is priced for continued earnings acceleration. After a 60% annual gain, any deceleration could trigger multiple compression. The ETF's extreme concentration (top 5 holdings = 49% of assets) means a stumble from ANY major holding gets amplified.
-
⚡ Concentration risk in NVIDIA: A single stock (NVIDIA) represents 19% of the ETF. If NVIDIA's Blackwell ramp disappoints or data center margins compress, it alone could drag SMH down 3-4%. You are essentially taking a large NVIDIA bet whether you realize it or not.
-
📉 Short-term fund outflows: Recent 5-day net outflows of -$291.7M suggest some institutional profit-taking at these levels, even as longer-term flows remain positive ($3.85B over 1 year). If outflows accelerate, it creates mechanical selling pressure.
The Bottom Line
Real talk: Two institutional players just spent a combined $9.1 MILLION on SMH calls this morning - and both paid ABOVE the ask price to guarantee fills. That is not casual positioning. That is urgency. When someone is willing to overpay for immediate execution on $5.5M and $3.6M trades simultaneously, they see something they need exposure to RIGHT NOW.
What these trades tell us:
- 🎯 The $5.5M BTO at $410 is a directional bet on continued semiconductor strength through February 20 OPEX - covering AMD and Qualcomm earnings
- 💰 The $3.6M BTC at $430 means a previous short seller is SCARED of upside - they're buying back protection because they think SMH could breach $430
- ⚡ BOTH above-ask fills signal extreme urgency - likely triggered by ASML's record orders 109% above consensus reported this morning
- 📊 February 20 expiration was chosen deliberately to capture AMD (Feb 3), Qualcomm (Feb 4), and the pre-NVIDIA earnings run-up
- 🚀 The combined flow is overwhelmingly bullish on the semiconductor sector for the next 23 days
If you are bullish on semis:
- ✅ The $410-$430 call spread mirrors institutional positioning perfectly - consider following the smart money
- 📊 $410 gamma support is your floor - set stops below $405 to manage risk
- 🎯 Target $430 for the February OPEX window, with potential extension to $440+ if all three earnings deliver
- ⏰ Best entry is NOW or on any pullback to $410-$415 area before AMD reports February 3
- 📈 ASML's record orders today confirm the demand thesis - semiconductor equipment orders lead chip revenue by 6-12 months
If you are watching from the sidelines:
- 👀 Wait for AMD earnings (Feb 3) to confirm the narrative before entering
- 🎯 A pullback to $400-$410 (gamma support zone) would be an excellent entry with 5-10% margin of safety
- 📊 Watch NVIDIA's February 25 report as THE make-or-break catalyst - 19% of the ETF rides on it
- ⚠️ At 42.6x P/E, you are paying a premium for growth - make sure you are comfortable with that valuation
If you are cautious:
- 🛡️ Consider put spreads below $400 as portfolio insurance if you hold long semiconductor positions
- 📉 First major support at $410 (9.2B gamma), deeper support at $400 (11.0B gamma)
- ⏰ The November 2026 BIS rule expiration and broader tariff negotiations are medium-term risks worth monitoring
- 🇨🇳 Any escalation in China trade tensions could gap SMH down 5-10% - size positions accordingly
Mark your calendar - Key dates:
- 📅 January 28 (Today) - ASML record earnings driving sector rally
- 📅 January 30 (Friday) - Weekly OPEX (+/-2.3% implied move)
- 📅 February 3 (Tuesday) - AMD Q4 2025 earnings (5.5% of SMH)
- 📅 February 4 (Wednesday) - Qualcomm Q1 FY2026 earnings (~4% of SMH)
- 📅 February 20 (Friday) - Monthly OPEX - EXPIRATION of both $9.1M call trades
- 📅 February 25 (Wednesday) - NVIDIA Q4 FY2026 earnings (19.1% of SMH - THE big one)
- 📅 March (est.) - Broadcom Q1 FY2026 and Micron Q2 FY2026 earnings
Final verdict: The semiconductor sector is firing on all cylinders - TSMC beat, ASML crushed it, Micron set records, and Broadcom's AI revenue is doubling. The $9.1M in call buying today, with BOTH trades filled above ask, confirms that institutional money sees more upside ahead. The risk/reward favors the bulls through February OPEX, BUT the 42.6x P/E and tariff uncertainty mean you need to size positions carefully and respect your stops.
The AI semiconductor supercycle is real. The earnings confirm it. Smart money is positioning for it. But do not confuse conviction with recklessness - use defined-risk strategies and protect your capital.
Disclaimer: Options trading involves substantial risk of loss and is not suitable for all investors. This analysis is for educational purposes only and not financial advice. Past performance does not guarantee future results. The Z-scores of 8.36 and 11.22 reflect these specific trades' unusual size relative to recent SMH history - they do not imply the trades will be profitable or that you should follow them. ETF options carry additional risks including tracking error and concentration risk. Always do your own research and consider consulting a licensed financial advisor before trading. Earnings create binary event risk with potential for significant gaps in either direction.
About VanEck Semiconductor ETF (SMH): SMH tracks the MVIS US Listed Semiconductor 25 Index, providing concentrated exposure to the 25 largest U.S.-listed semiconductor companies. With $35.6 billion in assets and top holdings including NVIDIA, TSMC, Broadcom, Micron, and ASML, SMH is the premier vehicle for trading the AI-driven semiconductor supercycle. The ETF trades on the Nasdaq exchange with an expense ratio of 0.35%.