:snowflake: SNOW: $44M Institutional Put Spread Calendar - Someone's Building a Fortress Before Earnings!
February 4, 2026 | Unusual Activity Detected
:dart: The Quick Take
Someone just dropped $44 MILLION on a sophisticated multi-leg put structure in Snowflake - and this is definitely not retail money playing around! The trade combines near-term protection through March with premium collection extending to July, creating what looks like a defensive fortress ahead of the February 25 earnings report. With SNOW down 24% YTD and earnings just 3 weeks away, big money is positioning for potential turbulence.
:office: Company Overview
Snowflake Inc. (NYSE: SNOW) | View on AInvest
| Metric | Value |
|---|---|
| Sector | Services - Prepackaged Software |
| Market Cap | $59.28B |
| Current Price | $164.89 |
| 52-Week Range | $120.10 - $280.67 |
| YTD Performance | -23.9% |
Founded in 2012, Snowflake is a fully managed platform that consolidates data hosted on different public clouds for centralized analytics and governance. The platform serves Fortune 2000 companies across financial services, media, and retail with solutions for analytics, data engineering, and AI applications.
:money_with_wings: The Option Flow Breakdown
:bar_chart: What Just Happened
Here's the complete tape of today's institutional activity - 9 trades totaling ~$44M in premium:
| Time | Direction | Strike | Expiration | Premium | Size | Spot |
|---|---|---|---|---|---|---|
| 10:08:07 | SELL PUT | $140 | 2026-07-17 | $6.4M | 5,115 | $164.90 |
| 10:08:07 | SELL PUT | $140 | 2026-07-17 | $1.5M | 1,207 | $164.90 |
| 10:08:07 | BUY PUT | $170 | 2026-03-20 | $9.5M | 5,115 | $164.90 |
| 10:08:07 | BUY PUT | $170 | 2026-03-20 | $1.5M | 805 | $164.90 |
| 10:08:07 | BUY PUT | $170 | 2026-03-20 | $2.3M | 1,207 | $164.90 |
| 10:20:08 | BUY PUT | $165 | 2026-04-17 | $7.1M | 4,325 | $169.01 |
| 10:20:08 | BUY PUT | $165 | 2026-04-17 | $7.1M | 4,325 | $169.01 |
| 10:20:08 | SELL PUT | $135 | 2026-07-17 | $4.4M | 4,325 | $169.01 |
| 10:20:08 | SELL PUT | $135 | 2026-07-17 | $4.4M | 4,325 | $169.01 |
Premium Summary:
- Total PUT Buys: ~$27.5M (protection/bearish exposure)
- Total PUT Sells: ~$16.7M (premium collection/bullish floor)
- Net Debit: ~$10.8M
:nerd: What This Actually Means
Translation for us regular folks: This is a sophisticated put spread calendar combination that screams "institutional risk management."
Here's the breakdown:
Leg 1 - March $170 Put Spread Calendar:
- Bought $170 puts for March 20 (Triple Witch expiration) - $13.3M protection
- Sold $140 puts for July 17 - $7.9M premium collected
- This creates downside protection through earnings with reduced cost
Leg 2 - April $165/$135 Put Spread Calendar:
- Bought $165 puts for April 17 - $14.2M protection
- Sold $135 puts for July 17 - $8.8M premium collected
- Extended protection through Q1 earnings and potential guidance updates
The Big Picture:
This trader is essentially saying: "I want protection if SNOW tanks to the $135-$165 zone through April, but I don't think it's going below $135-$140 by July."
The structure:
- Max protection zone: $135-$170 (where the trader makes money on a drop)
- Break-even on puts sold: Stock would need to crash below $135-$140 by July for losses
- Time decay: Works against long puts but for short puts
- Earnings hedge: March expiration captures Feb 25 earnings event perfectly
:chart_with_upwards_trend: Technical Setup / Chart Check-Up
YTD Performance Analysis
SNOW has been in a brutal downtrend in 2026, shedding nearly 24% year-to-date. The stock started the year around $217 and has steadily declined to current levels near $165.
Key observations from the YTD chart:
- Started 2026 at $216.71
- Max drawdown of -29.69% during the selloff
- Current volatility reading: 54.2% (elevated)
- Recent volume spike suggests institutional repositioning
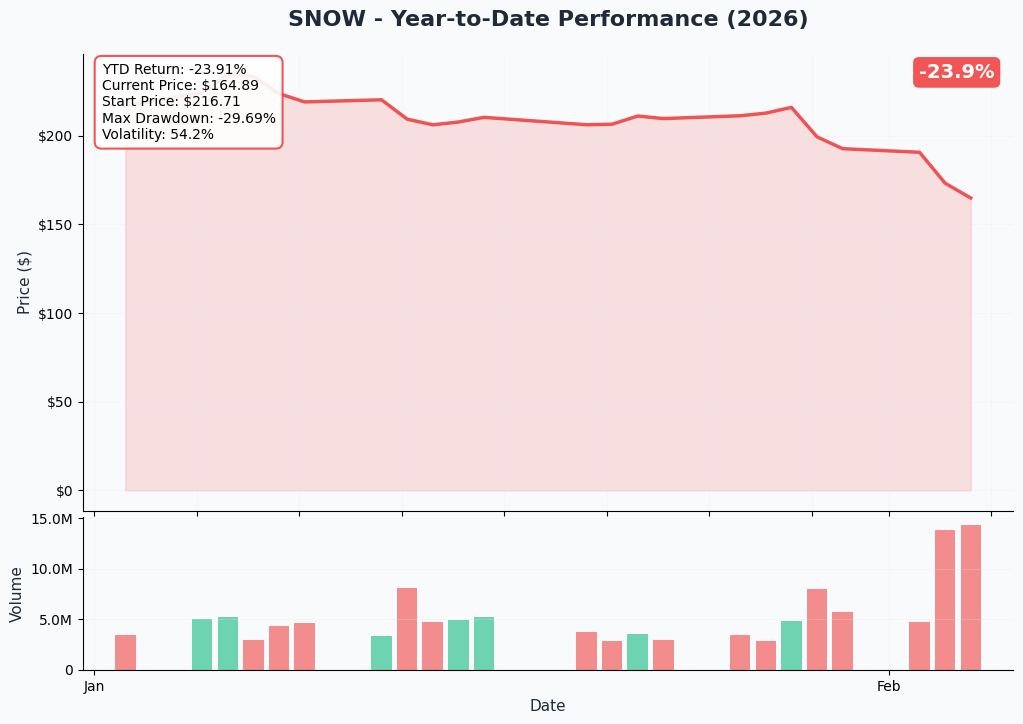
The massive volume bars in early February coincide with today's institutional put activity - someone is clearly making moves ahead of earnings.
:bar_chart: Gamma-Based Support & Resistance Analysis
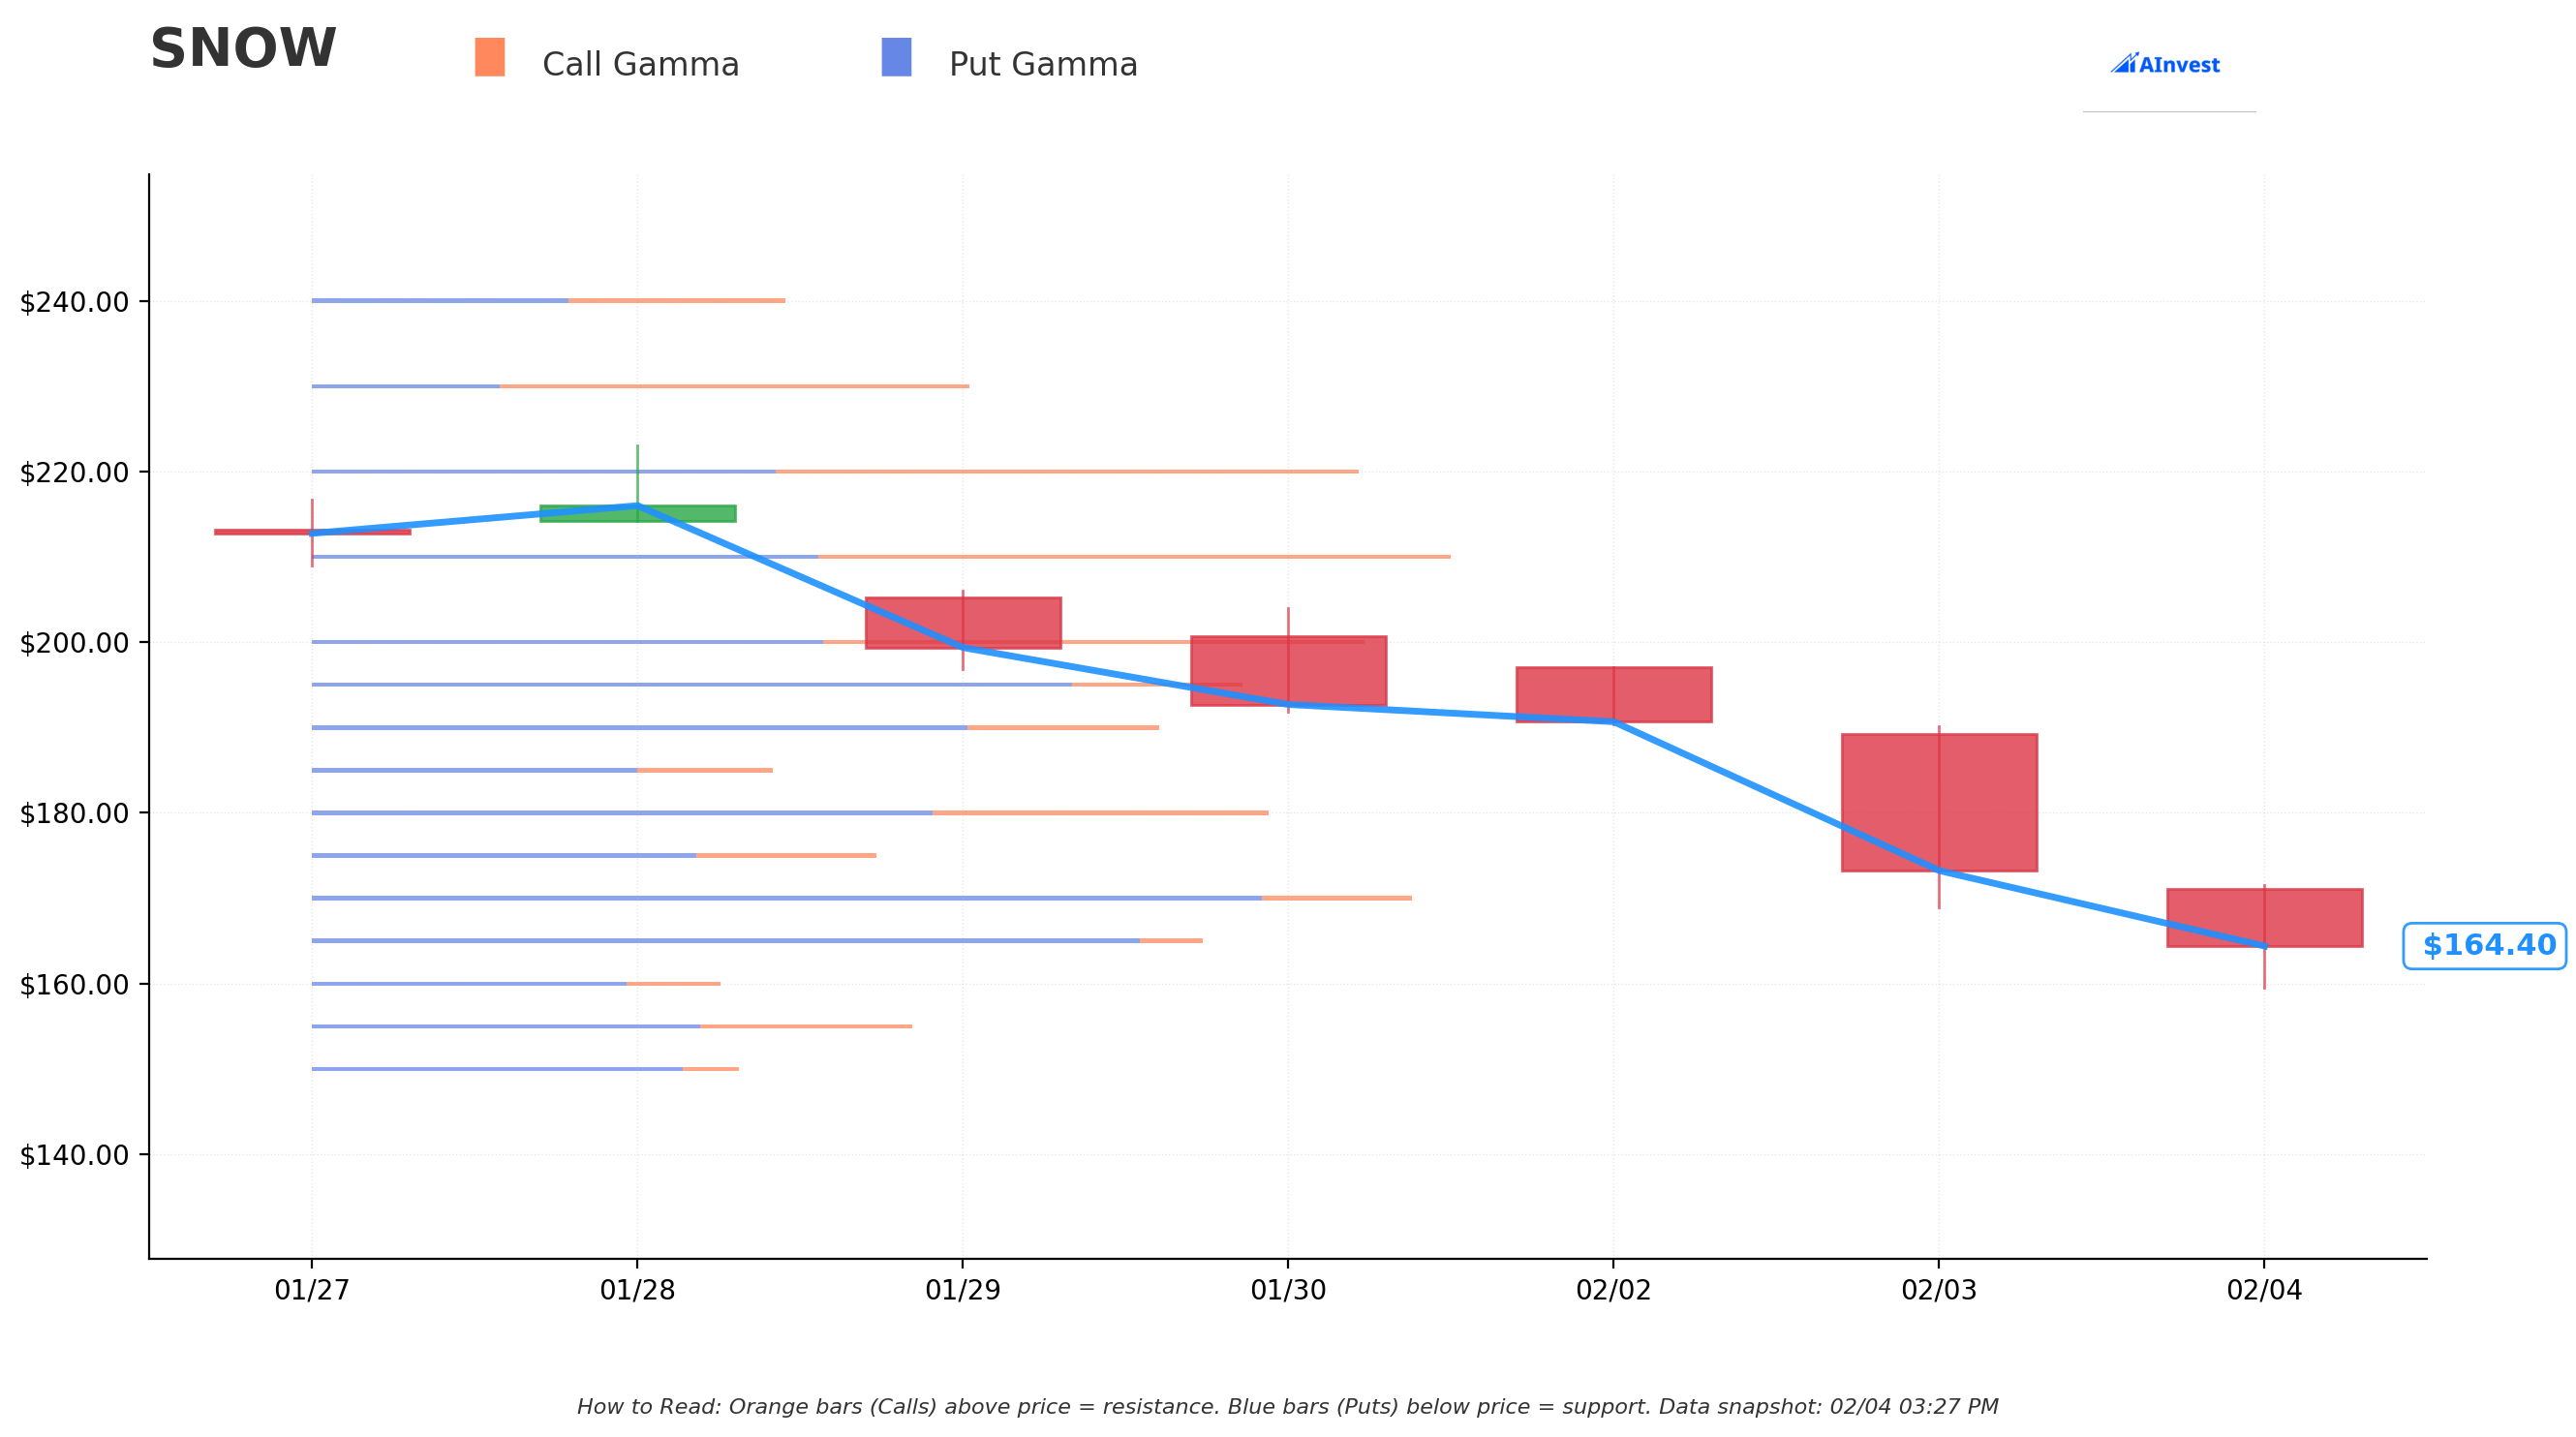
Reading the Chart:
- Orange bars (Call Gamma) = Resistance levels above current price - where the stock may face selling pressure
- Blue bars (Put Gamma) = Support levels below current price - where buyers may step in
Current Gamma Levels (as of February 4, 2026):
| Level | Type | Distance from Current | Strength |
|---|---|---|---|
| $160 | Support | -2.5% | Strong (Net GEX: -0.54) |
| $155 | Support | -5.6% | Moderate (Net GEX: -0.43) |
| $150 | Support | -8.6% | Strong (Net GEX: -0.79) |
| $165 | Resistance | +0.5% | Very Strong (Net GEX: -1.91) |
| $170 | Resistance | +3.6% | Very Strong (Net GEX: -1.98) |
| $175 | Resistance | +6.6% | Moderate (Net GEX: -0.51) |
Gamma Summary:
- Strongest Support: $160
- Strongest Resistance: $165
- Net GEX Bias: Bearish (Put GEX: 21.59 vs Call GEX: 15.35)
The negative net gamma exposure suggests market makers are positioned to amplify moves - meaning if SNOW breaks below $160 support, we could see accelerated selling. Conversely, getting above $170 would be difficult without significant buying pressure.
:crystal_ball: Implied Move Analysis
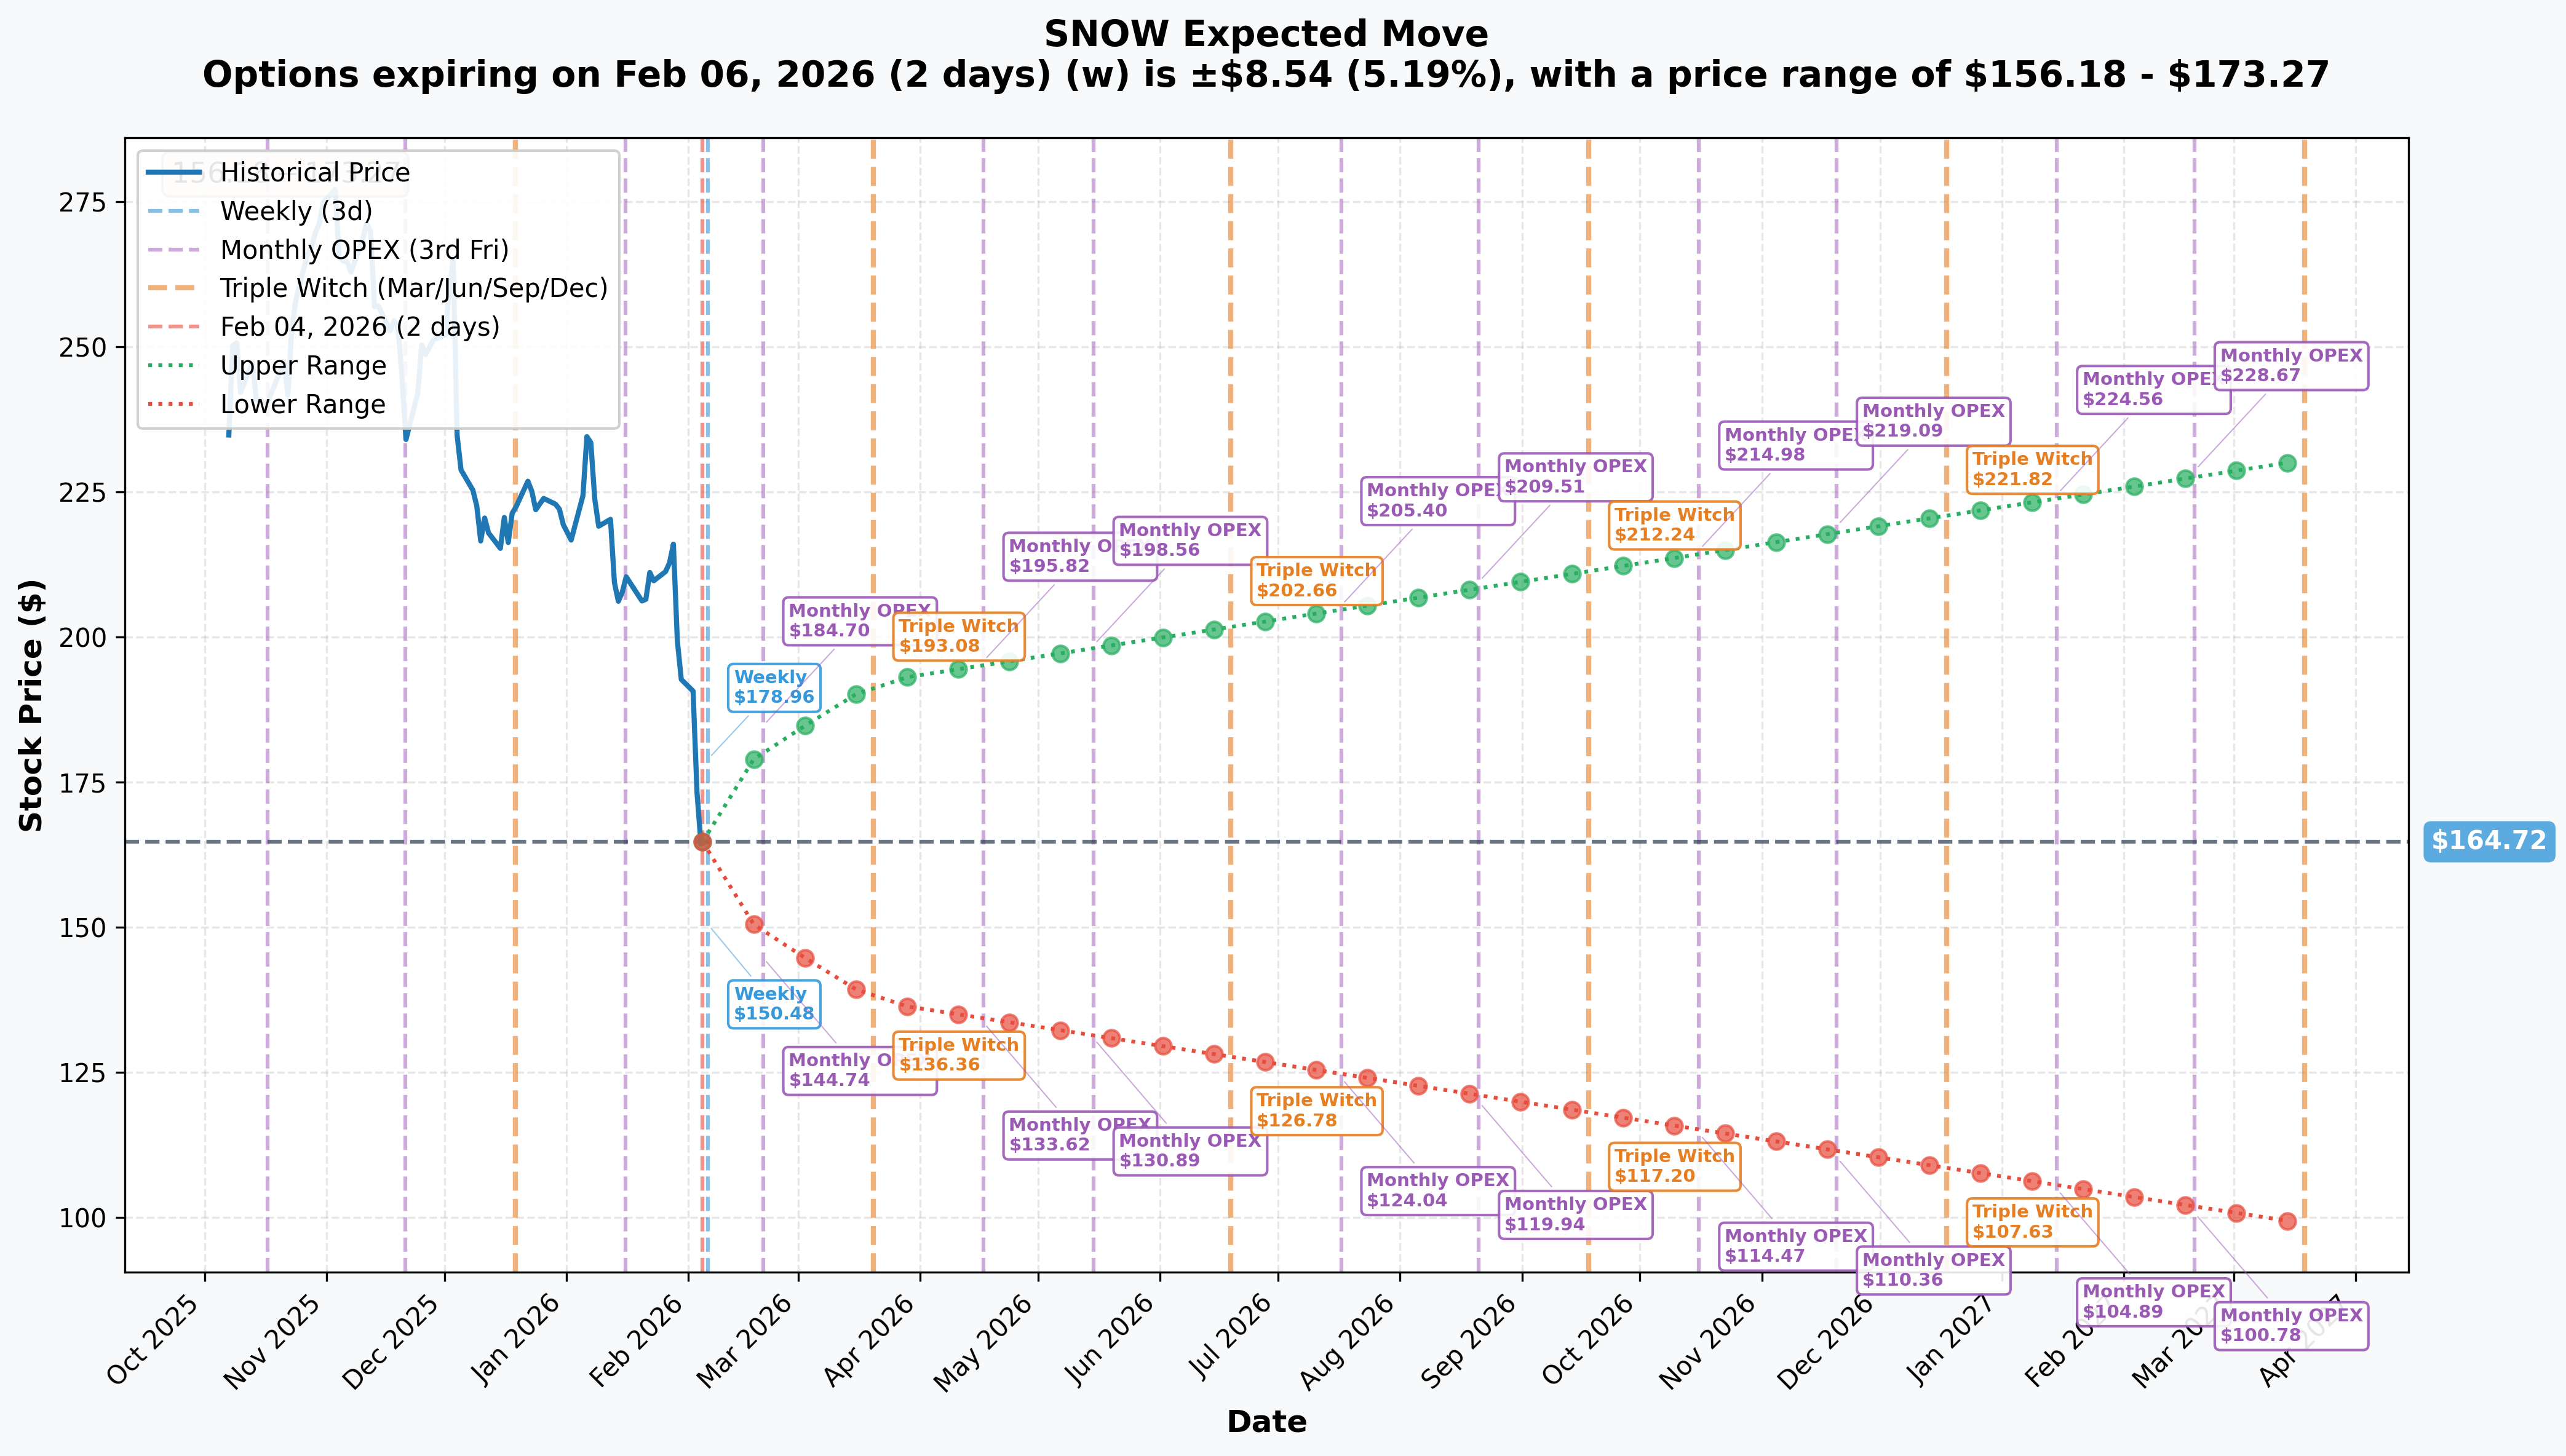
The options market is pricing in significant volatility across multiple timeframes:
| Expiration | Days Out | Implied Move | Price Range |
|---|---|---|---|
| Feb 6 (Weekly) | 2 days | +/-5.19% | $156.18 - $173.27 |
| Feb 20 (Monthly OPEX) | 16 days | +/-9.58% | $148.93 - $180.51 |
| Mar 20 (Triple Witch) | 44 days | +/-16.71% | $137.20 - $192.24 |
| Apr 17 (Monthly OPEX) | 72 days | +/-18.9% | $133.62 - $195.82 |
| Jul 17 (Monthly OPEX) | 163 days | +/-24.7% | $124.04 - $205.40 |
Key Insight: The institutional put structure we saw today is perfectly calibrated to these implied moves:
- The $170 March puts protect against the implied lower bound of $137
- The $165 April puts extend coverage through the $134 zone
- The $135-$140 July puts sold are at/below the implied floor - betting the stock won't go there
:circus_tent: Catalysts
:calendar: Upcoming Events (Mark Your Calendar!)
| Date | Event | Significance |
|---|---|---|
| February 25, 2026 | Q4 FY2026 Earnings Release | HIGH - Key catalyst |
| March 3, 2026 | Morgan Stanley TMT Conference | Medium - CEO/CFO presenting |
| H1 2026 | Observe Acquisition Closing | High - $1B deal completion |
| June 1-4, 2026 | Snowflake Summit 2026 | High - Major product announcements |
:rewind: Recent Events (Already Happened)
| Date | Event | Impact |
|---|---|---|
| February 2-3, 2026 | OpenAI $200M Partnership | Bullish - Major AI validation |
| February 3, 2026 | Cortex Code AI Agent Launch | Bullish - Product expansion |
| January 12, 2026 | Barclays Downgrade | Bearish - Price target cut to $250 |
| January 8, 2026 | Observe Acquisition Announced | Neutral - $1B M&A integration risk |
| December 3, 2025 | Q3 FY2026 Earnings Beat | Bullish - $100M AI revenue milestone |
:game_die: Price Targets & Probabilities
Based on gamma levels, implied moves, and the current catalyst setup:
:bear: Bear Case (30% Probability)
Target: $137-$150
If Q4 earnings disappoint or guidance falls short, SNOW could test the implied move lower bound of $137. The gamma levels show support at $150 and $155, but a break below $160 could trigger accelerated selling.
Triggers:
- Q4 product revenue misses $1.195B consensus
- Net revenue retention drops below 120%
- Observe acquisition hits regulatory snags
- Broader tech selloff continues
:balance_scale: Base Case (50% Probability)
Target: $160-$175
SNOW consolidates in current range through earnings, with moderate volatility. The $165 gamma resistance acts as a ceiling while $160 provides floor. Earnings meet expectations but don't inspire a major move.
Triggers:
- In-line Q4 results with maintained guidance
- AI revenue trajectory continues ($100M+ run rate)
- Market digests recent pullback as healthy consolidation
:bull: Bull Case (20% Probability)
Target: $180-$195
Strong Q4 beat with raised guidance triggers short squeeze through gamma resistance. The $200M OpenAI deal and Cortex AI momentum drive renewed institutional interest.
Triggers:
- Q4 revenue beats by 3%+ with raised FY27 guidance
- AI revenue accelerates toward $150M+ run rate
- Observe acquisition closes early with positive integration news
- Analyst upgrades follow earnings
:bulb: Trading Ideas
:shield: Conservative: "The Sleep Well Spread"
Strategy: Put Credit Spread (Bullish Bet with Defined Risk)
| Parameter | Value |
|---|---|
| Sell | $150 Put, March 20 expiration |
| Buy | $140 Put, March 20 expiration |
| Net Credit | ~$2.50-$3.00 per spread |
| Max Risk | $7.00-$7.50 per spread |
| Max Profit | Credit received |
| Break-even | ~$147 at expiration |
Why this works: You're selling puts at the implied move lower bound ($137) cushioned by the $150 gamma support level. If SNOW stays above $150 through earnings, you keep the premium. This is essentially betting against the institutional put buyer's worst-case scenario.
Probability of Profit: ~65-70%
:balance_scale: Balanced: "The Earnings Strangle Rider"
Strategy: Iron Condor around Implied Move
| Parameter | Value |
|---|---|
| Sell | $180 Call, March 20 expiration |
| Buy | $190 Call, March 20 expiration |
| Sell | $145 Put, March 20 expiration |
| Buy | $135 Put, March 20 expiration |
| Net Credit | ~$3.50-$4.50 per spread |
| Max Risk | $5.50-$6.50 per spread |
Why this works: The implied move through March is +/-16.7%, giving you a range of $137-$192. This iron condor sells outside that range, betting SNOW stays within the expected move. The gamma levels at $180 resistance and $150 support add confluence.
Probability of Profit: ~55-60%
:rocket: Aggressive: "Follow the Whale"
Strategy: Put Calendar Spread (Mimic the Institutional Trade)
| Parameter | Value |
|---|---|
| Buy | $165 Put, April 17 expiration |
| Sell | $165 Put, February 20 expiration |
| Net Debit | ~$4.50-$5.50 per spread |
| Max Profit | If SNOW at $165 on Feb 20 expiration |
Why this works: You're copying the institutional playbook - buying longer-dated protection while selling near-term premium. If SNOW pins near $165 (the gamma magnet) through February expiration, the short put decays while your April protection retains value. You then own cheap puts through earnings.
Risk Warning: This is a volatility play. If SNOW moves too far too fast in either direction, you lose.
Probability of Profit: ~40-45%
:warning: Risk Factors
What Could Go Wrong
Execution Risks:
- The $44M institutional trade could be hedging existing long stock position, not a directional bet
- Market makers may adjust gamma levels, changing support/resistance dynamics
- Observe acquisition ($1B) integration could face regulatory delays
Competition Risks:
- Databricks IPO in H1 2026 could draw investor attention away
- Microsoft Fabric bundling pressure in Azure accounts
- Industry pricing compression
Macro Risks:
- Consumption-based revenue model vulnerable to enterprise spending cuts
- NVIDIA GPU costs (H100/B200) may pressure AI margins
- Broader tech correction extending
Valuation Risks:
- Still trading at premium P/S despite 24% YTD decline
- Barclays downgrade cited limited upside after strong 2025 run
- Analyst consensus target ($275-$285) may be stale after recent weakness
:dart: The Bottom Line
Real talk: This $44M institutional put structure is a clear signal that big money is bracing for potential volatility around the February 25 earnings report. The trader is NOT betting on a crash below $135-$140, but they ARE willing to pay up for protection in the $165-$170 zone through April.
Here's your action plan:
If you own SNOW:
- Consider adding protective puts ahead of Feb 25 earnings
- The $160 put for March offers decent protection at current IV levels
- The institutional trade suggests smart money sees downside risk to $135-$165 range
If you're watching SNOW:
- Wait for post-earnings clarity before establishing new positions
- The $160 gamma support and $165 resistance create a tight trading range
- A break below $160 or above $170 with volume would signal the next move
If you're bearish:
- The put spread calendar structure used by institutions is capital-efficient
- Consider similar March/July put spreads to finance protection
- Avoid naked puts - the IV is elevated and could spike further
Mark your calendar: February 25 is the big day. With Q4 FY2026 earnings, AI revenue updates, and Observe acquisition progress all in focus, SNOW will likely see elevated volatility. The $27M in institutional put buying suggests the downside scenario is being actively hedged.
Trading Wisdom: When someone spends $44M on a defensive options structure, they're not doing it for fun. Whether this is portfolio hedging or a directional bet, it tells us that experienced traders see meaningful risk ahead. Position accordingly.
:page_facing_up: Sources
- Snowflake Q4 FY2026 Earnings Date
- Snowflake OpenAI $200M Partnership
- Snowflake Observe Acquisition
- Barclays Downgrade
- Q3 FY2026 Earnings Results
- Analyst Consensus
- Cortex Code Launch
Disclaimer: This analysis is for informational purposes only and does not constitute investment advice. Options trading involves significant risk of loss and is not suitable for all investors. Past performance does not guarantee future results. Always do your own research and consider your risk tolerance before trading.
Data as of February 4, 2026. Option flow data from live market tape. Gamma and implied move calculations via AInvest analytics.