🔥 SOC Put Hedge Fortress - $15M Oil Risk Protection Play!
📅 October 3, 2025 | 🔥 Unusual Activity Detected
🎯 The Quick Take
Someone just dropped $15M on SOC put protection this morning, with the largest being a $4.1M put buy on November 2025 strikes! This massive institutional hedge arrives just as Sable Offshore faces critical debt refinancing deadlines and pipeline approval uncertainties. With $873M in debt maturing January 2026, smart money is buying protection against potential downside. Translation: Big players are hedging serious risk ahead of make-or-break catalysts!
📊 Company Overview
Sable Offshore Corp. (SOC) is an independent oil and gas producer with:
- Market Cap: $1.95 Billion
- Industry: Crude Petroleum & Natural Gas
- Primary Business: Offshore oil production from Santa Ynez Unit in federal waters off California
- Key Asset: Three offshore platforms (Harmony, Heritage, Hondo) with 112 wells across 76,000 acres
- View SOC Stock Chart
- SOC Company Page
💰 The Option Flow Breakdown
📊 The Tape (October 3, 2025):
| Time | Symbol | Side | Buy/Sell | Type | Expiration | Premium | Strike | Volume | OI | Size | Spot | Option Price | Option Link |
|---|---|---|---|---|---|---|---|---|---|---|---|---|---|
| 14:03:36 | SOC | ASK | BUY | PUT | 2026-01-16 | $15M | $17.5 | 42K | 41K | 39,000 | $19.63 | $3.90 | View Chart |
| 13:13:46 | SOC | MID | BUY | PUT | 2025-11-21 | $4.1M | $12.5 | 55K | 60K | 55,000 | $19.92 | $0.75 | View Chart |
| 13:13:46 | SOC | MID | SELL | CALL | 2025-11-21 | $4.1M | $35 | 55K | 70K | 55,000 | $19.92 | $0.75 | View Chart |
🤓 What This Actually Means
This activity shows sophisticated institutional hedging! Here's the breakdown:
The January 2026 Put Fortress ($15M):
- Buying 39,000 puts at $17.50 strike for $3.90 each
- Protection kicks in below $13.60 ($17.50 - $3.90)
- Expires RIGHT AFTER the critical debt maturity deadline
- This isn't speculation - it's MASSIVE downside insurance!
The November Risk Reversal ($8.2M total):
- Sold $35 calls to finance $12.50 put purchases (collar strategy)
- Zero net cost potentially - using call premium to fund put protection
- Positioned for pipeline approval decision timeline
- Classic "protect the downside, cap the upside" institutional move
Unusual Score: 4049x average size - This happens maybe once a year in SOC!
📈 Technical Setup / Chart Analysis
YTD Performance Chart
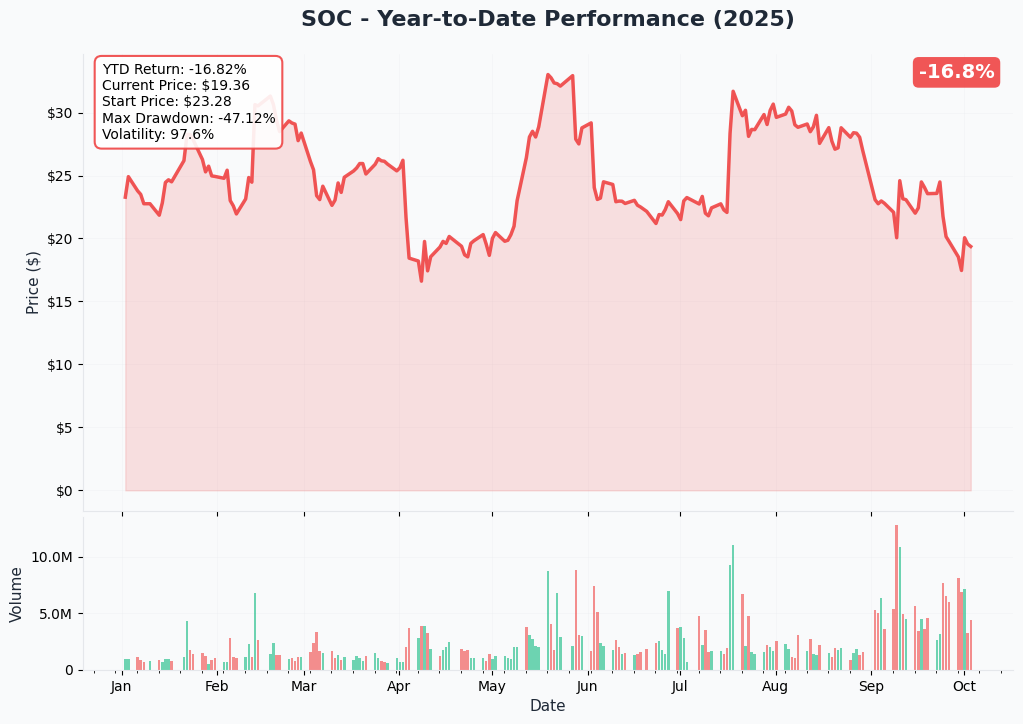
SOC has been on a volatile journey in 2025, currently trading around $19.35 after wild swings. The stock peaked near $40 in May following production restart news but has since pulled back over 50% on regulatory delays and debt concerns.
Key observations:
- High volatility: Stock has shown 100%+ swings this year
- Recent breakdown: Failed to hold $25 support in September
- Volume surges: Heavy institutional activity on news events
- 52-week range: $12.20 - $42.75 (currently near lower third)
Gamma-Based Support & Resistance Analysis
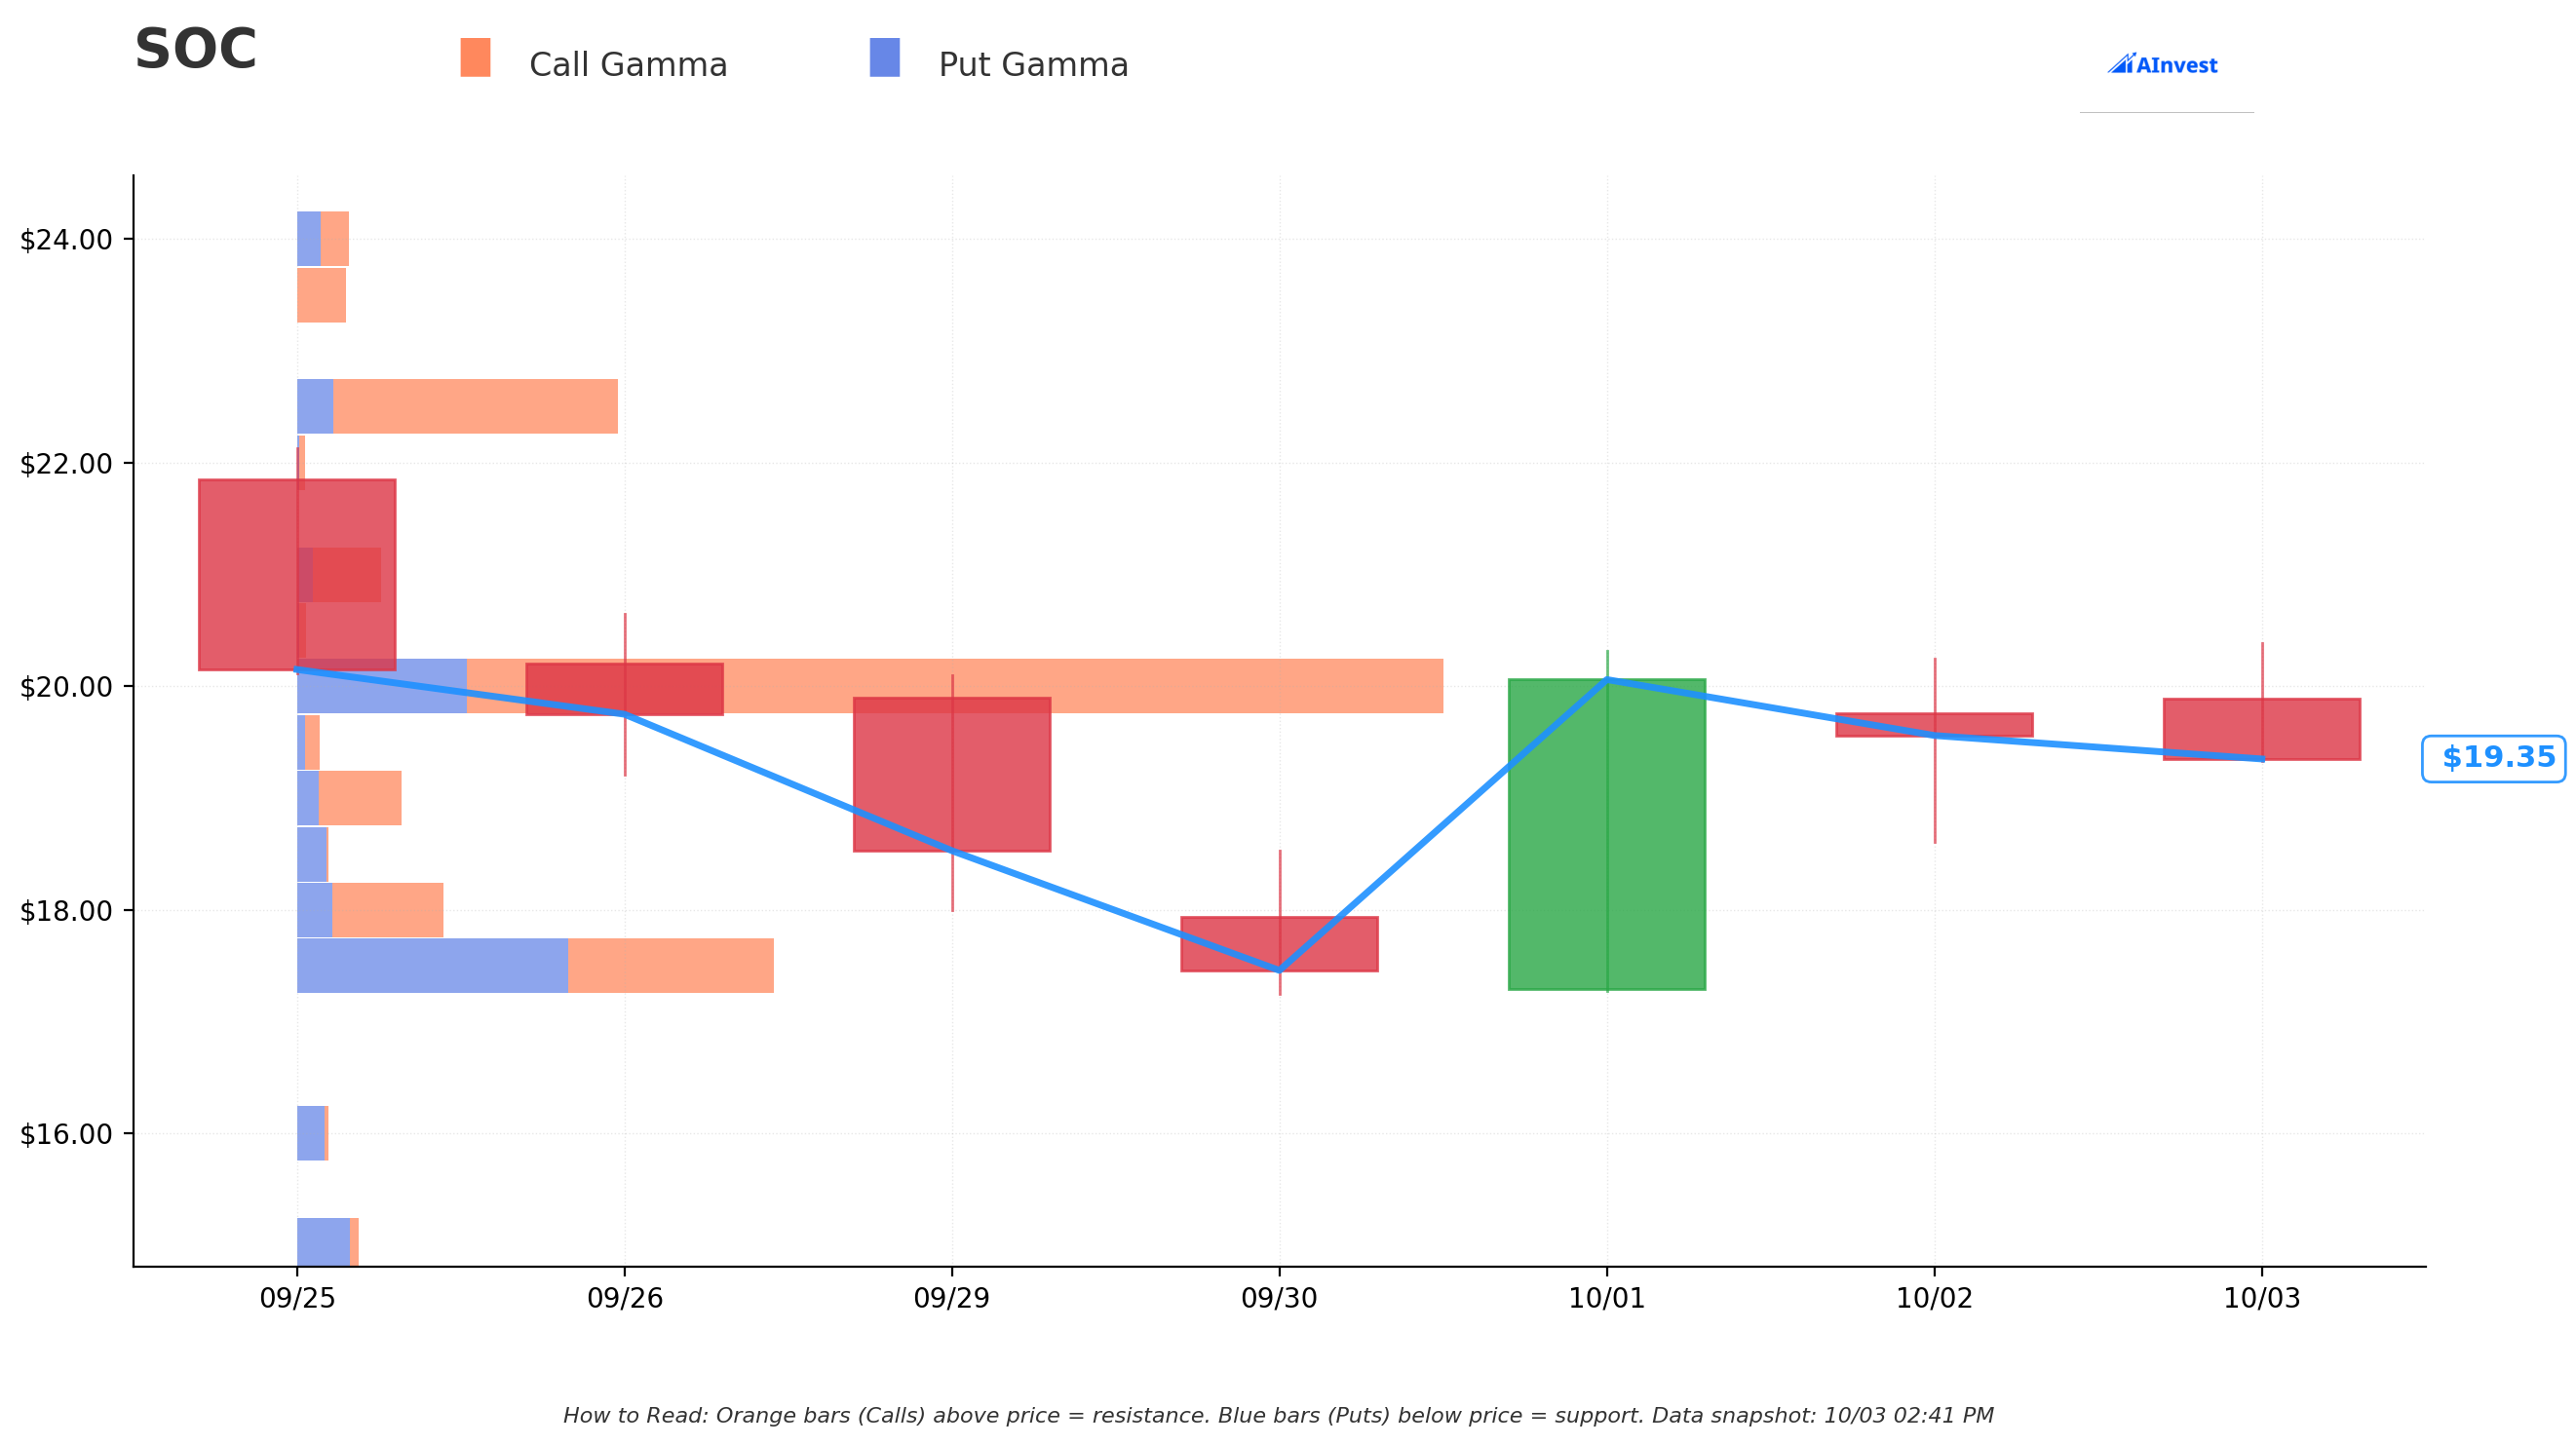
Current Price: $19.35
The gamma landscape reveals critical battlegrounds:
🔵 Support Levels (Put Gamma):
- $19.00: Minor support (1.39 total gamma) - 1.8% below current
- $18.50: Weak support (0.42 gamma) - 4.4% below
- $18.00: Moderate support (1.95 gamma) - 7.0% below
- $17.50: MASSIVE support (6.35 gamma) - 9.6% below
- $16.00: Deep support (0.41 gamma) - 17.3% below
🟠 Resistance Levels (Call Gamma):
- $19.50: Immediate resistance (0.30 gamma) - 0.8% above
- $20.00: MAJOR resistance wall (15.27 gamma) - 3.4% above
- $20.50: Light resistance (0.12 gamma) - 5.9% above
- $21.00: Secondary resistance (1.12 gamma) - 8.5% above
- $22.50: Upper resistance (4.28 gamma) - 16.3% above
The massive gamma concentration at $20 creates a magnetic price level - options activity shows heavy institutional interest here, making it difficult to break above without major catalysts.
🎪 Catalysts
⏰ Upcoming Events
Critical Debt Maturity - January 2026
- $873 million in debt comes due (Source: Ainvest analysis)
- Company reported $247M cash on hand in latest filings (Source: SEC Filing)
- Refinancing success could unlock 130%+ upside per analysts (Source: Benchmark Company)
- Failure could trigger significant downside per institutional hedging activity
Las Flores Pipeline Approval Decision - Q4 2025/Q1 2026
- Formal restart plans submitted September 2025 (Source: KEYT News)
- California Office of State Fire Marshal reviewing safety measures (Source: California State Fire Marshal)
- Approval unlocks full production potential of 40,000-50,000 BOE/d (Source: Company Guidance)
- Delays push company toward expensive Plan B alternative transport solution
Plan B Implementation - Q4 2026
- Offshore Storage & Treating vessel strategy requires $100M capex (Source: Benchmark analysis)
- Additional $3-4/barrel operating costs per company estimates (Source: Sable Offshore Investor Relations)
- Provides alternative if pipeline approval fails (Source: Company Press Release)
- Benchmark maintains $47 price target despite higher costs (Source: Benchmark Company Research)
✅ Recently Completed
Production Restart - May 15, 2025
- Platform Harmony restarted at 6,000 barrels/day (Source: World Oil)
- First oil production since 2015 shutdown
- Heritage and Hondo platforms pending pipeline approval
- Limited operations only until full transport solution approved
🎲 Price Targets & Probabilities
Based on gamma levels and catalyst analysis:
🚀 Bull Case (25% chance): Target $22.50+
- Pipeline approval comes through by year-end
- Successful debt refinancing announced
- Production ramps to 40,000+ BOE/d target
- Strong gamma resistance at $22.50 becomes support
- Benchmark's $47 target suggests massive upside if execution succeeds
😐 Base Case (50% chance): Range $17.50-$20.00
- Stock stays pinned around massive $20 gamma wall
- Pipeline delays continue but Plan B progresses
- Debt refinancing negotiations ongoing
- Heavy put gamma at $17.50 provides floor
- Options market expects range-bound action
😰 Bear Case (25% chance): Target $16.00 or below
- Pipeline approval denied or significantly delayed
- Debt refinancing fails or highly dilutive
- Legal challenges escalate with court injunctions
- Break below $17.50 triggers accelerated selling
- January put buyers profit massively
💡 Trading Ideas
🛡️ Conservative: Sell Cash-Secured Puts
- Sell $17.50 puts for November expiration
- Collect $0.50-0.75 premium (3-4% in 6 weeks)
- Happy to own at $16.75-17.00 if assigned
- Strong gamma support provides cushion
⚖️ Balanced: Put Spread for Protection
- Buy $19 puts, Sell $17 puts (January expiration)
- Net cost ~$0.75 per spread
- Protects against 10%+ downside
- Max profit $1.25 if stock drops to $17
🚀 Aggressive: Call Calendar Spread
- Sell November $22.50 calls for $0.40
- Buy January $22.50 calls for $1.20
- Net cost $0.80, profits from time decay
- Positioned for post-debt resolution rally
⚠️ Risk Factors
Real talk - here's what could go wrong:
- Binary Debt Event: $873M maturity could trigger massive volatility
- Regulatory Gridlock: California agencies moving slowly on approvals
- Legal Challenges: Multiple class-action suits allege misleading statements (Source: California Resources)
- Environmental Opposition: Groups actively fighting restart through courts
- Liquidity Concerns: Wide bid-ask spreads on options
🎯 The Bottom Line
Here's the deal: Someone just spent $15M protecting against SOC downside, and they're not messing around! The January 2026 puts align PERFECTLY with the debt maturity deadline - this isn't random speculation, it's calculated institutional risk management.
If you own SOC: Consider hedging strategies NOW. That $17.50 put wall shows where smart money draws the line.
If you're watching: Wait for clarity on pipeline approval or debt refinancing. The risk-reward improves dramatically with any positive catalyst resolution.
If you're bearish: The put buyers might be onto something. January $17.50 puts offer 2:1 risk-reward if debt concerns materialize.
Mark your calendar for: January 2026 debt maturity - that's when this massive options bet pays off or expires worthless!
Remember: Options involve risk of total loss. This unusual activity suggests institutions are seriously concerned about near-term risks. Trade accordingly! 💪
Disclaimer: This analysis is for educational purposes only. Options trading involves substantial risk and is not suitable for all investors. Always conduct your own research and consult with a financial advisor before making investment decisions.