🎵 SPOT: $12.9M Diagonal Put Spread — Smart Money Hedging Into Earnings!
📅 February 6, 2026 | 🔥 Unusual Activity Detected
🎯 The Quick Take
Someone just built a $12.9M diagonal put spread on Spotify with Q4 earnings dropping in 4 days (February 10)! They sold near-dated $410 puts for $7.9M and bought longer-dated $350 puts for $5M — a sophisticated income-generation play that profits if SPOT stays above $410 through June while maintaining downside protection through September. With the stock at $416.76 and down 28% YTD, this is a big bet that the earnings selloff is overdone. 👀
🏢 Company Overview
Spotify Technology S.A. ($85B market cap) is the world's leading music streaming platform with over 700 million monthly active users and 280 million premium subscribers. The company generates revenue through premium subscriptions and advertising, and has been expanding into podcasts, audiobooks, and AI-powered features. SPOT is down ~28% YTD as a broader tech selloff and CEO transition concerns have erased 2025 gains. Sector: Music Streaming / Digital Media | Employees: 7,691
💰 The Option Flow Breakdown
📊 What Just Happened
| Time | Symbol | Side | Buy/Sell | Type | Expiration | Premium | Strike | Volume | OI | Size | Spot | Option Price |
|---|---|---|---|---|---|---|---|---|---|---|---|---|
| 11:09 | SPOT | MID | SELL | PUT | 2026-06-18 | $7.9M | $410 | 1,800 | 2,000 | 1,830 | $416.76 | $42.99 |
| 11:09 | SPOT | MID | BUY | PUT | 2026-09-18 | $5.0M | $350 | 1,800 | 41 | 1,830 | $416.76 | $27.28 |
💵 Total Premium: $12.9M (net credit ~$2.9M)
🤓 What This Actually Means
This is a diagonal put spread — a multi-layered income and protection strategy:
🐋 The Structure:
- Sold June 18 $410 puts at $42.99 each → Collecting $7.9M in premium (income leg)
- Bought September 18 $350 puts at $27.28 each → Paying $5M for downside insurance
- Net credit: ~$15.71 per spread ($2.9M total)
Translation: The whale is saying "I don't think SPOT drops below $410 by June, but just in case everything goes wrong, I've got a floor at $350." They collect $2.9M in net premium upfront while maintaining crash protection through September. This is the kind of sophisticated play institutions run when they're cautiously bullish but want to generate income. The June puts (sold) have OI of 2,000 — this 1,830-contract trade is nearly the entire open interest!
📈 Technical Setup / Chart Check-Up
YTD Performance
SPOT has been hammered in 2026, dropping from ~$575 to ~$417 — a brutal 28% decline driven by the broader tech selloff and leadership transition concerns.
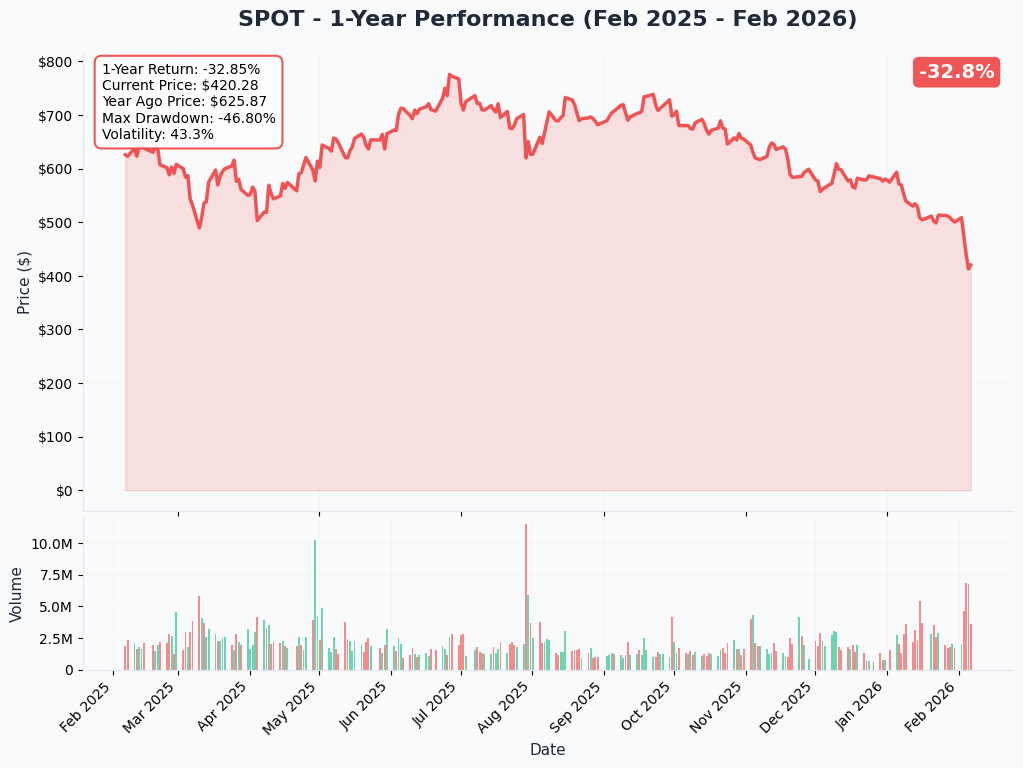
The stock is trading near 52-week lows (~$405) after dropping 7.06% on February 4 and another 6.31% on February 5 per the catalyst research. Q4 earnings on February 10 is the make-or-break moment.
🔵🟠 Gamma-Based Support & Resistance Analysis
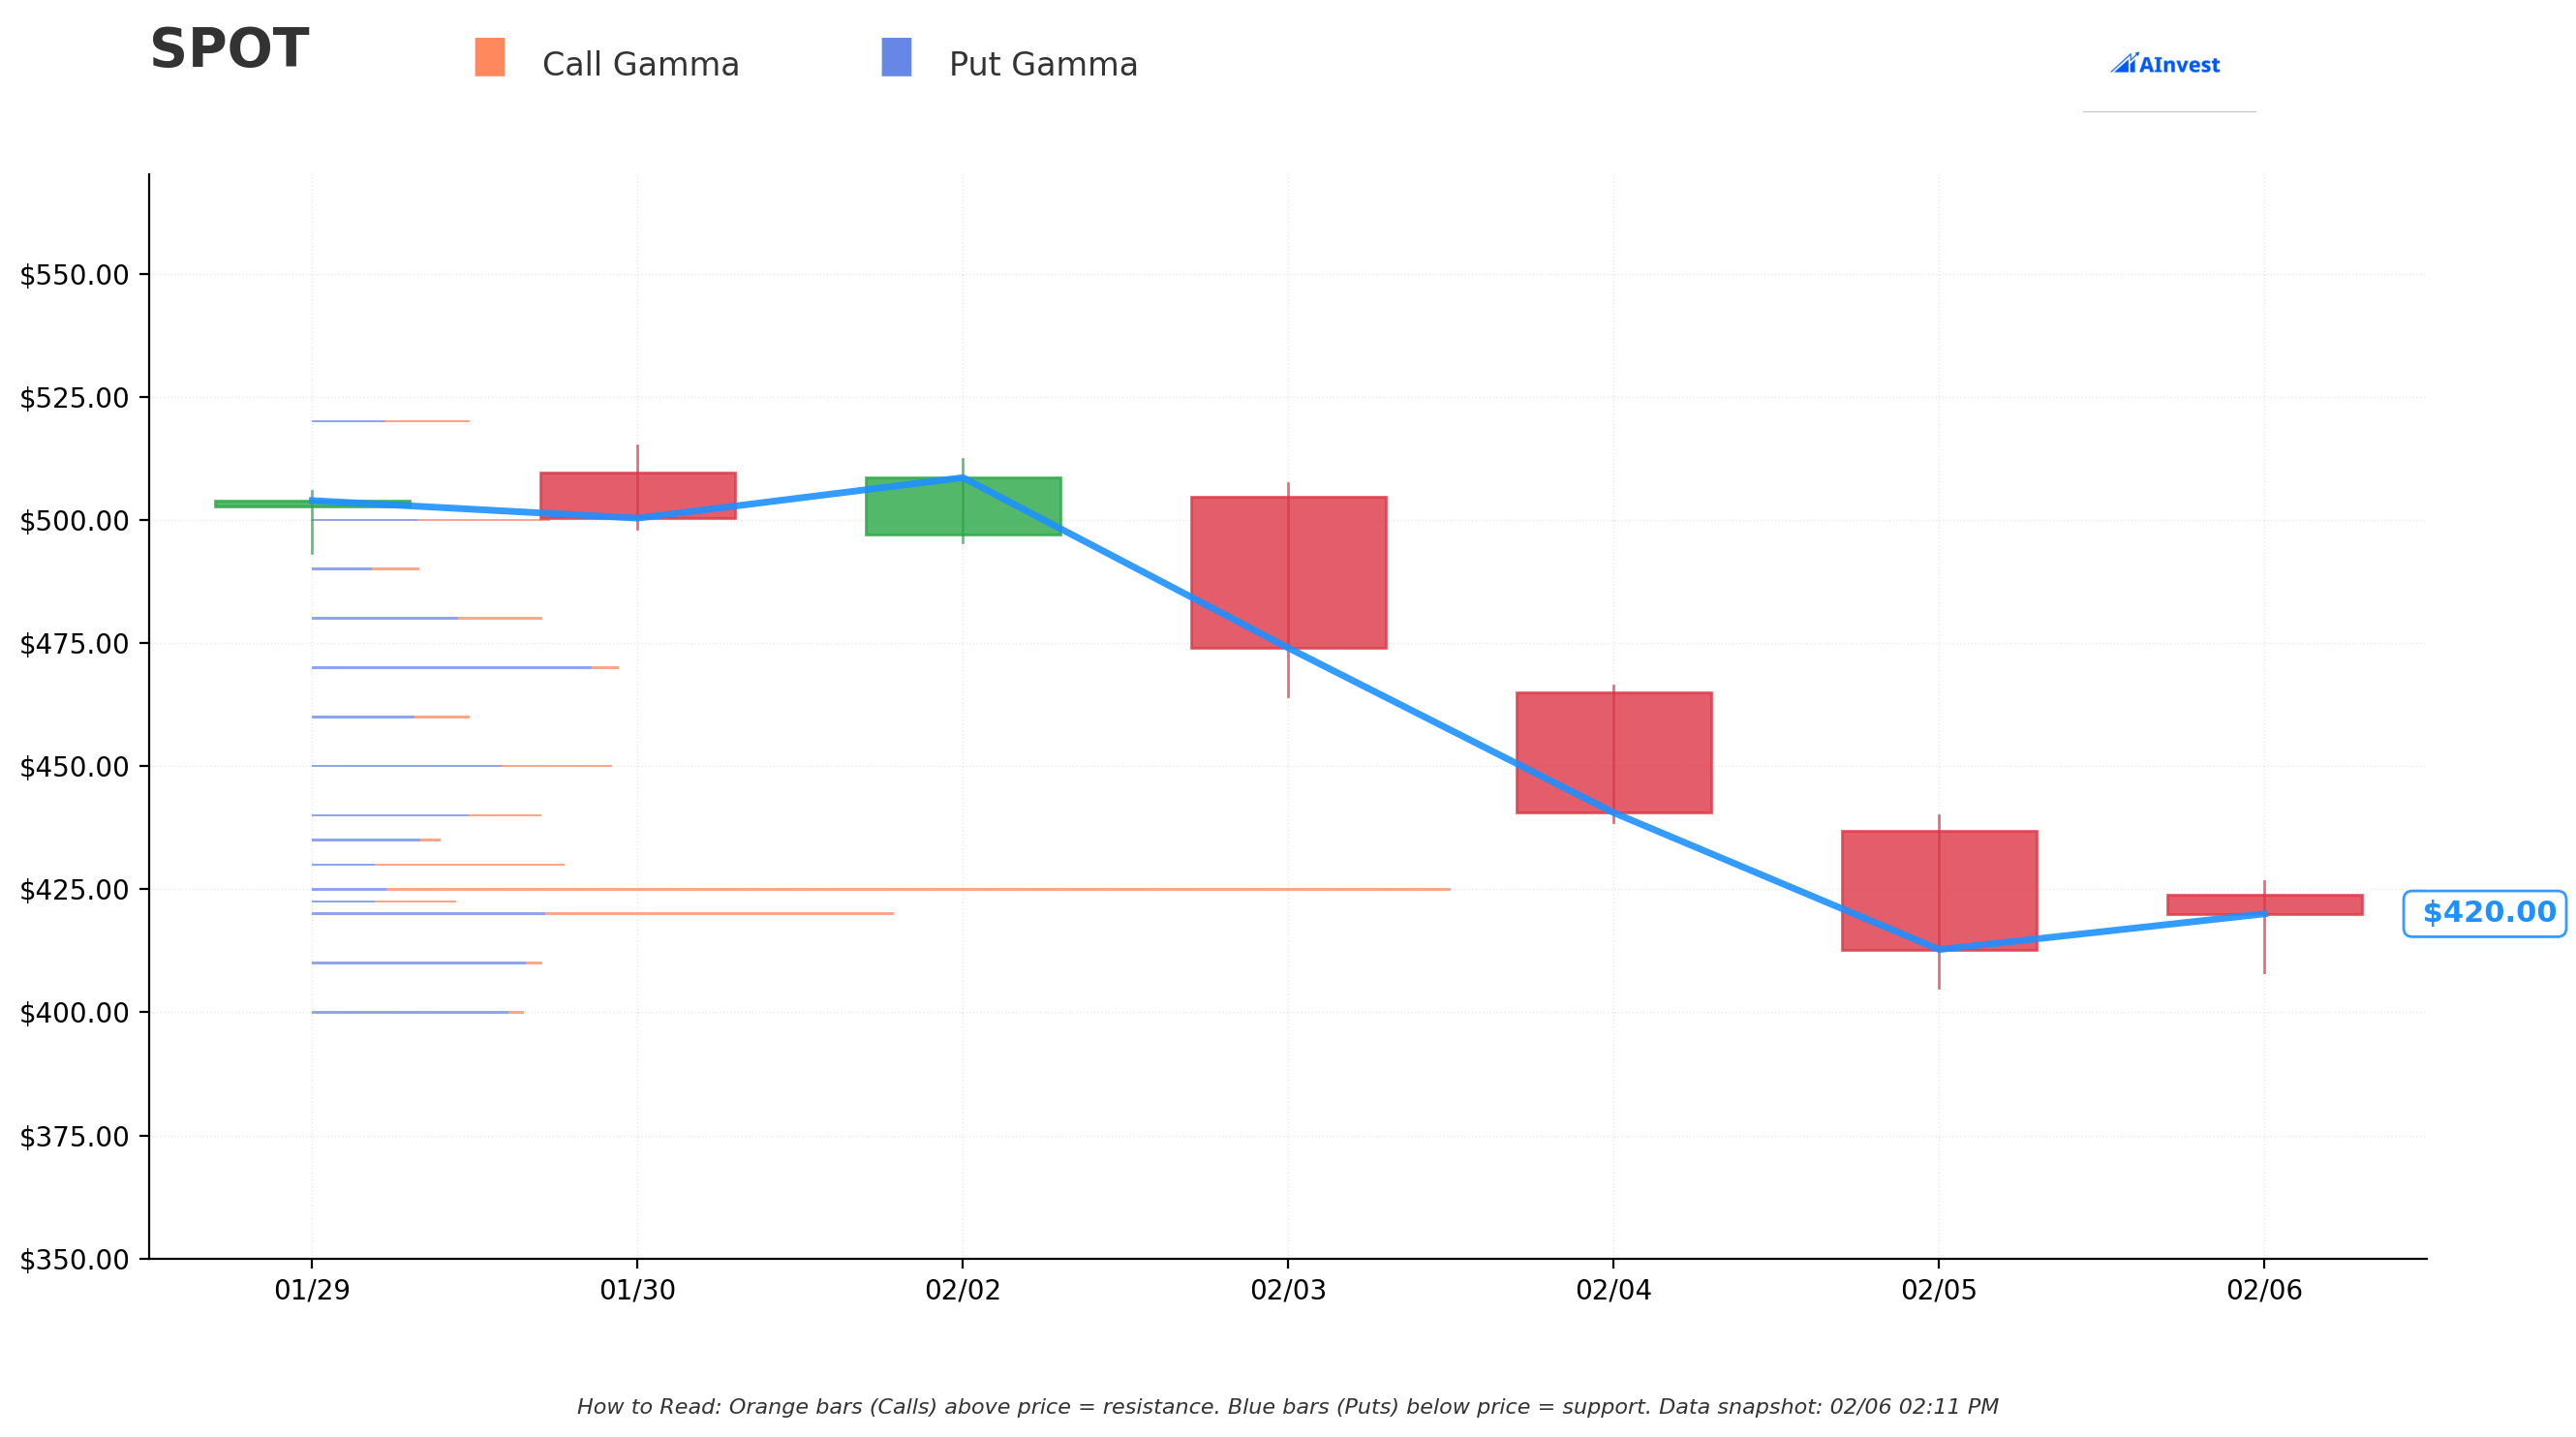
Gamma-Based Support & Resistance Analysis:
🛡️ Support Levels:
- $410 — The whale's short put strike! Moderate gamma activity here — this is the "line in the sand"
- $400 — Next support with slightly higher total GEX. Psychological round number support
🎯 Resistance Levels:
- $420 — Immediate resistance right above current price (strongest gamma level)
- $425 — Significant resistance with the highest call GEX ($4.18)
- $430 — Moderate resistance zone
- $450-$470 — Upper resistance levels
📊 GEX Bias: Bullish — Call GEX ($13.4) slightly exceeds Put GEX ($13.1), suggesting balanced positioning with a mild bullish tilt. The low overall gamma means the stock can move freely — watch out for big swings around earnings!
📊 Implied Move Analysis
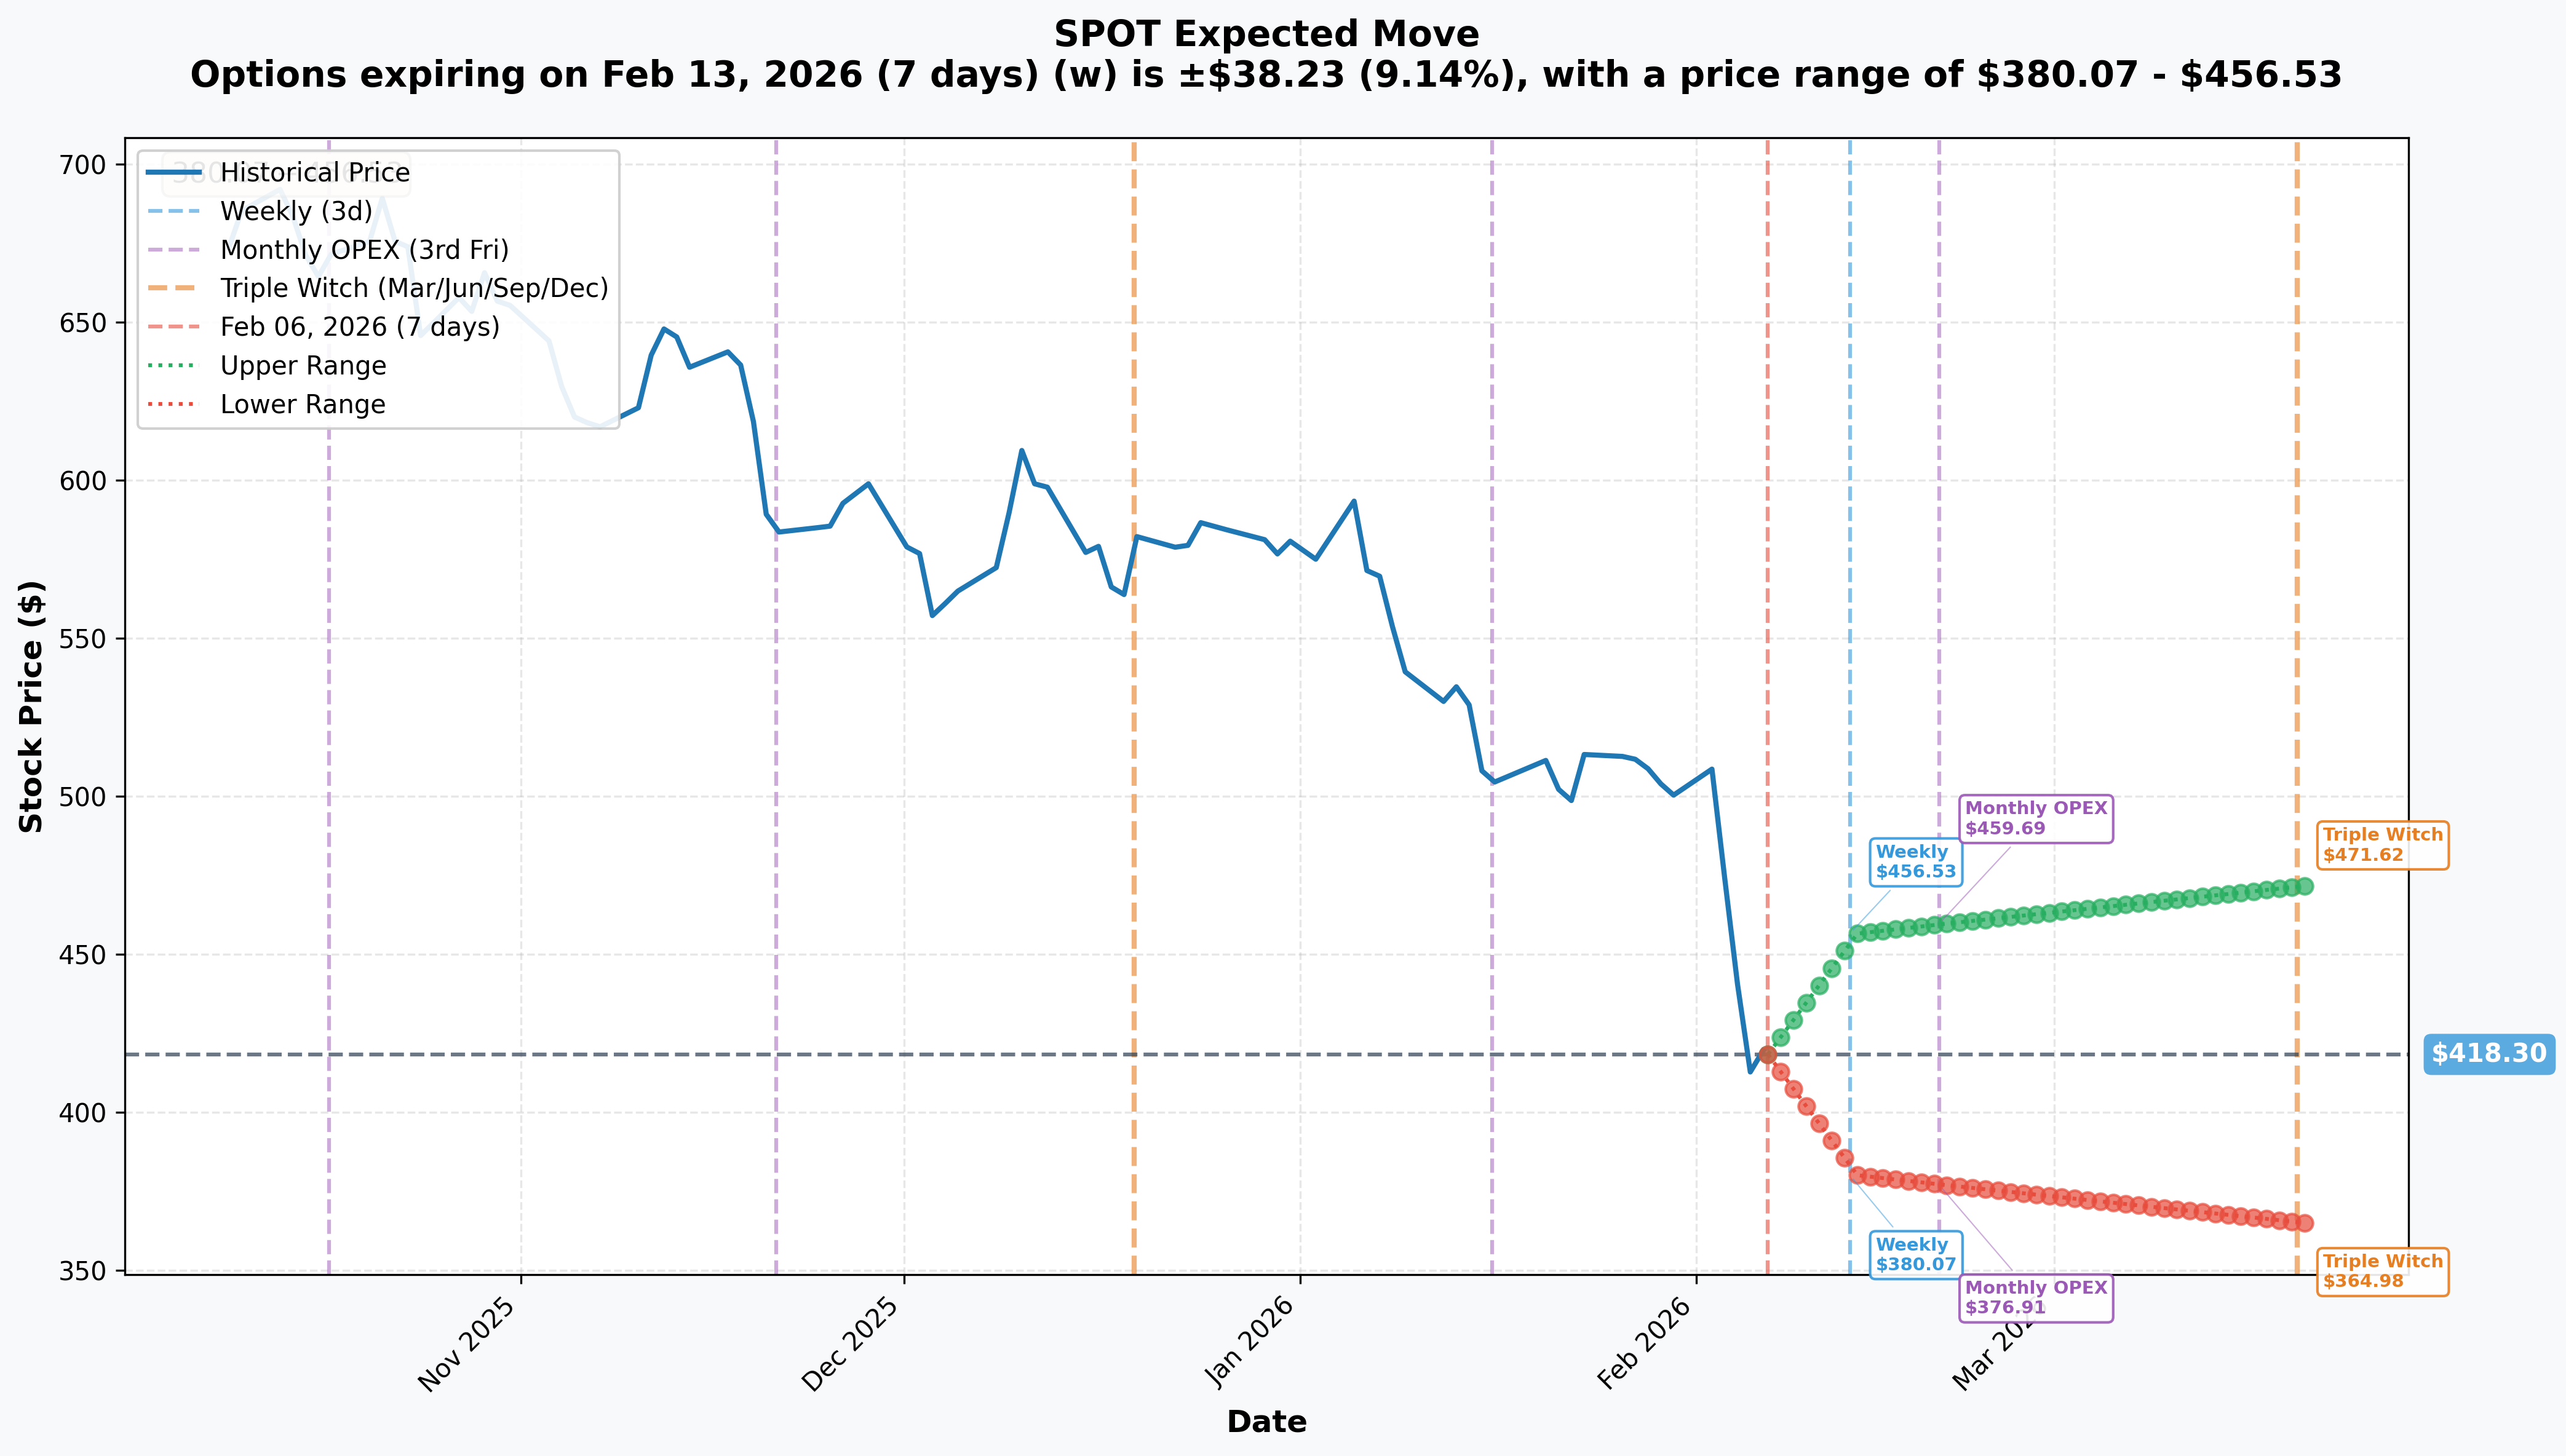
Options-Implied Price Ranges:
| Timeframe | Expiry | Implied Move | Range |
|---|---|---|---|
| 📅 Weekly | 2026-02-13 | ±9.14% | $380 - $457 |
| 📅 Monthly OPEX | 2026-02-20 | ±9.90% | $377 - $460 |
| 📅 Triple Witch | 2026-03-20 | ±12.75% | $365 - $472 |
The weekly implied move of ±9.14% is massive — reflecting the February 10 earnings event. The market expects a ±$38 move! The whale's $410 short put sits right at the lower end of the implied range, suggesting they think the downside is limited from here even with earnings risk.
🎪 Catalysts
✅ Already Happened (Recent)
- 📊 Q3 2025 Earnings Beat (Nov 4) — Revenue EUR 4.3B (+12% YoY), 713M MAU (+17M), 281M premium subscribers per the catalyst report
- 😰 Q2 Earnings Miss (Jul 29) — Revenue missed, stock dropped 11% — worst day in 2 years
- 👥 CEO Transition (Jan 1, 2026) — Daniel Ek moved to Executive Chairman, co-CEOs Gustav Soderstrom and Alex Norstrom appointed
- 📉 28% YTD Decline — Broader tech selloff + leadership uncertainty + ad monetization skepticism
- 📈 Gross Margin Expansion — Improved to 31.6% in Q3, up from 26.4% two years ago
🔮 Upcoming
- 📊 Q4 2025 Earnings — February 10, 2026 (4 days away!) — Expected: EUR 4.5B revenue, 289M subscribers, $2.95 EPS
- 💰 Price Increase Effects — Individual plan rose to $12.99/month (11%), family to $19.99 (16%) in 2025
- 🤖 AI Features Expansion — AI DJ, personalized discovery, automated podcast transcription
- 📚 Audiobook Monetization — 250K+ title library, bundled with premium subscriptions
- 🎬 Video Podcast Ramp — Competing with YouTube for creator content
🎲 Price Targets & Probabilities
Using gamma levels, implied moves, and the earnings catalyst:
🐻 Bear Case: $350-$380 (25% probability)
- Q4 earnings miss (like Q2's surprise miss)
- Ad revenue continues to disappoint
- Break below $400 triggers cascade selling to $365 (implied move floor)
- The whale's $350 long put provides floor protection here
⚖️ Base Case: $400-$440 (50% probability)
- Q4 meets or slightly beats expectations (EUR 4.5B revenue, 289M subs)
- Stock stabilizes between $410-$425 gamma range
- CEO transition proves smooth
- Whale's short $410 put expires worthless — they keep the $7.9M
🚀 Bull Case: $450-$500 (25% probability)
- Q4 subscriber growth accelerates (295M+ premium)
- Gross margin hits 33%+ (above 32.9% guidance)
- Advertising revenue finally inflects positively
- Analyst consensus target: $731 — massive 77% upside per the catalyst report
💡 Trading Ideas
🛡️ Conservative: "The Post-Earnings Dip Buyer"
- Wait for Q4 earnings (Feb 10) and buy shares on any dip to $390-$410
- Set stop-loss at $365 (implied move floor)
- Target: $450-$475 by Triple Witch (March 20)
- Risk: ~5-10% | Reward: ~10-15% | R:R = 1.5:1
- Why this works: The stock is already down 28% YTD — a lot of bad news is priced in
⚖️ Balanced: "The Premium Collector"
- Sell the March 20 $390 put after earnings (if stock holds $400+)
- Collect ~$8-12 premium per contract
- You're getting paid to buy SPOT at $378-382 if it drops further
- Risk: Assigned 100 shares at $390 | Reward: Premium income
- Why this works: Similar logic to the whale — betting the bottom is in near $400
🚀 Aggressive: "The Earnings Bounce"
- Buy February 20 $430 calls before earnings (Feb 10)
- Cost: ~$15-20 with high IV premium
- Break-even: ~$445-450
- Target: Sell at $30+ if SPOT jumps to $450+ on earnings
- Risk: Full premium (~$1,500-2,000 per contract) | Reward: 2-3x on earnings beat
- Why this works: Implied move of ±9% means a big beat could push to $450+. But IV crush will eat profits if the move is muted
⚠️ Risk Factors
- 📊 Earnings in 4 Days — Q4 results on Feb 10 could swing the stock ±9%. Previous earnings miss (Q2) caused an 11% drop
- 👥 CEO Transition Risk — New co-CEO structure is untested. Investors may sell on any execution stumbles
- 📉 Ad Revenue Weakness — CEO Ek flagged advertising as an "execution challenge" — still unresolved
- 💸 Valuation Stretch — Even at $417, SPOT trades at premium multiples relative to music industry peers
- 🌐 Tech Selloff Contagion — If the broader NASDAQ continues selling off, SPOT gets dragged down
- 📈 IV Crush — Options premiums are inflated by earnings. Post-earnings, IV collapses and option values drop
🎯 The Bottom Line
Real talk: A whale just built a $12.9M diagonal put spread on Spotify with earnings 4 days away. The structure says: "I'm cautiously bullish — I'll collect premium selling $410 puts because I think the bottom is in, but I'm protecting myself with $350 puts through September just in case." The net $2.9M credit means they get paid for the position regardless.
The game plan:
- 🟢 If you're bullish: Q4 earnings (Feb 10) is your catalyst. If they beat on subscribers and margins, the 28% YTD decline sets up a massive bounce. The $410-$420 gamma zone is the launch pad
- 🟡 If you're watching: Wait for earnings. The ±9% implied move means anything can happen. Let the dust settle before committing
- 🔴 If you're bearish: A miss on ad revenue or subscriber growth could send this to $370-$380. The whale bought $350 puts for a reason
Mark your calendar: February 10, Q4 Earnings. The whale thinks the bottom is $410. Let's see if the market agrees. 💪
⚠️ Disclaimer: This analysis is for educational purposes only and does not constitute financial advice. Options trading involves significant risk of loss. Always do your own research and consider your risk tolerance before trading.