🛡️ SPY Massive $44.9M Put Butterfly Spread - Institutional FOMC Hedge! 🦋
📅 December 15, 2025 | 🔥 Unusual Activity Detected
🎯 The Quick Take
Smart money just deployed a $44.9 MILLION complex put butterfly spread across 7 legs this morning! This massive institutional structure bought 300,000 put contracts at strikes ranging from $500 to $600, while selling 300,000 puts at $485-$585 strikes - all expiring January 2026. With the FOMC meeting December 17-18 just 2 days away and SPY trading at $607 near all-time highs, this is sophisticated portfolio insurance ahead of the Fed's hawkish pivot. Translation: Institutions are bracing for potential 5-10% downside volatility through year-end!
📊 ETF Overview
SPDR S&P 500 ETF Trust (SPY) is the world's first and largest exchange-traded fund, launched in January 1993 by State Street Global Advisors:
- Assets Under Management: ~$720 billion (TipRanks)
- Tracks: S&P 500 Index - 500 largest U.S. publicly traded companies
- Current Price: $607.00 (near all-time high of $689.70)
- Expense Ratio: 0.0945%
- 52-Week Range: $481.80 - $689.70 (TradingView)
- Dividend Yield: 1.1%
- P/E Ratio: 28.52 (Robinhood)
The S&P 500 reached an all-time high closing price of $689.17 on December 11, 2025, before pulling back -1.1% to $681.76 by December 15 as markets digested the Fed's hawkish December 10 rate decision.
💰 The Option Flow Breakdown
The Tape (December 15, 2025 @ 10:55-10:56):
| Time | Symbol | Side | Buy/Sell | Type | Expiration | Premium | Strike | Volume | OI | Size | Spot | Option Price |
|---|---|---|---|---|---|---|---|---|---|---|---|---|
| 10:55:09 | SPY | ASK | BUY | PUT $550 | 2026-01-23 | $9.5M | $550 | 150K | 50 | 150,000 | $607.00 | $0.63 |
| 10:55:09 | SPY | ASK | BUY | PUT $600 | 2026-01-23 | $10M | $600 | 75K | 206 | 75,000 | $607.00 | $1.33 |
| 10:55:09 | SPY | ASK | BUY | PUT $500 | 2026-01-23 | $1.3M | $500 | 75K | 82 | 37,500 | $607.00 | $0.35 |
| 10:55:09 | SPY | ASK | BUY | PUT $500 | 2026-01-23 | $1.3M | $500 | 38K | 82 | 37,500 | $607.00 | $0.35 |
| 10:56:21 | SPY | BID | SELL | PUT $535 | 2026-01-30 | $10M | $535 | 150K | 321 | 150,000 | $607.00 | $0.67 |
| 10:56:21 | SPY | BID | SELL | PUT $585 | 2026-01-30 | $10M | $585 | 75K | 605 | 75,000 | $607.00 | $1.33 |
| 10:56:21 | SPY | BID | SELL | PUT $485 | 2026-01-30 | $2.8M | $485 | 75K | 303 | 75,000 | $607.00 | $0.37 |
🤓 What This Actually Means
This is an advanced institutional hedging structure - specifically a complex put butterfly spread executed across two different expirations! Here's what's really happening:
The Structure Broken Down:
📊 Long Puts (Bought Protection):
- 💸 150,000 × $550 Jan 23 puts @ $0.63 = $9.5M
- 💸 75,000 × $600 Jan 23 puts @ $1.33 = $10M
- 💸 75,000 × $500 Jan 23 puts @ $0.35 = $2.6M
- Total paid: $22.1M in downside protection
📊 Short Puts (Sold to Finance):
- 💰 150,000 × $535 Jan 30 puts @ $0.67 = $10M collected
- 💰 75,000 × $585 Jan 30 puts @ $1.33 = $10M collected
- 💰 75,000 × $485 Jan 30 puts @ $0.37 = $2.8M collected
- Total collected: $22.8M in premium
Net Cost: ~$22.1M - $22.8M = Essentially a ZERO-COST COLLAR (slight credit received!)
What this genius structure accomplishes:
- 🛡️ Downside protection: Maximum protection between $550-$600 if SPY drops 5-10% from current $607
- 💰 Self-financing: The sold puts at slightly different strikes/expirations PAY for the purchased protection
- ⏰ FOMC timing: Positioned to capture December 17-18 FOMC meeting volatility
- 📊 Massive scale: 600,000 contracts total represents $36+ BILLION in notional exposure
- 🎯 Break-even zone: Profits if SPY trades $550-$600 through January, essentially neutral otherwise
Translation for regular folks: This trader likely manages a HUGE long SPY position (pension fund, sovereign wealth fund, or mega hedge fund). Instead of paying millions for insurance, they created a zero-cost hedging structure that protects against a 5-10% market drop while giving up potential profits if SPY crashes below $500 or stays above $600. Think of it like buying car insurance but agreeing to pay the first $500 of any claim to reduce your premium to zero. Brilliant risk management!
Unusual Score Analysis:
- 🔥 $550 Jan 23 puts: Z-score 13,892 - EXTREMELY UNUSUAL (3,000x average volume!)
- 🔥 $600 Jan 23 puts: Z-score 990 - EXTREMELY UNUSUAL
- 🔥 $535 Jan 30 puts: Z-score 5,454 - EXTREMELY UNUSUAL (467x average volume!)
- 🔥 $585 Jan 30 puts: Z-score 2,444 - EXTREMELY UNUSUAL
These aren't retail trades. This is sophisticated institutional portfolio management executing across 7 legs simultaneously at massive scale - happens maybe 2-3 times per year!
📈 Technical Setup / Chart Check-Up
YTD Performance Chart
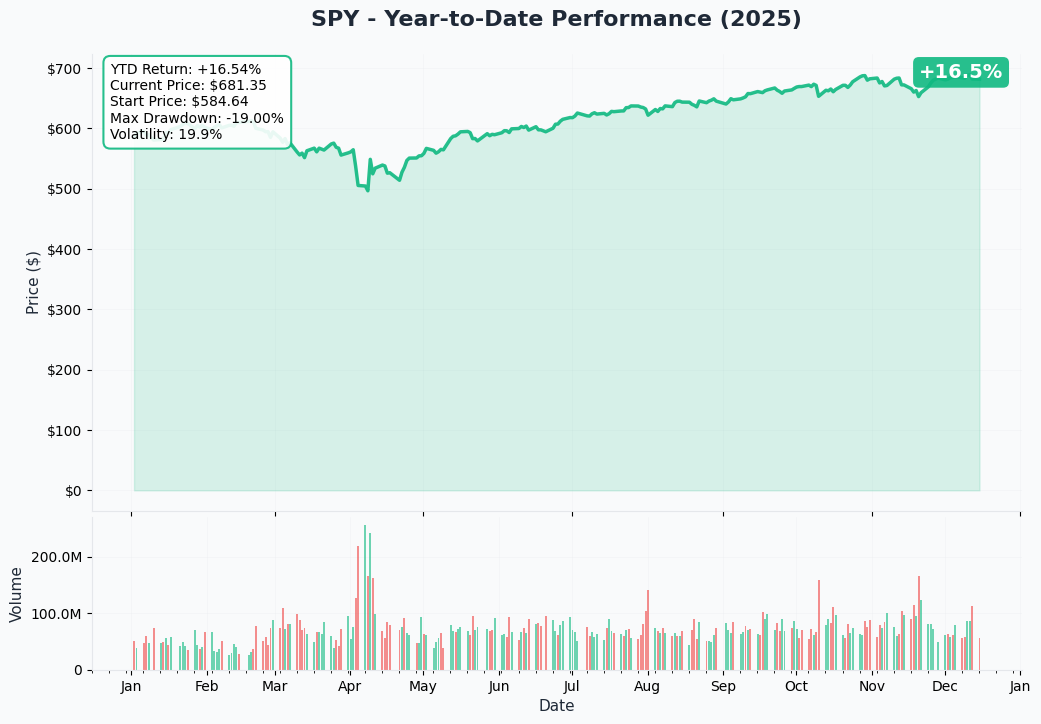
SPY has delivered an impressive run in 2025 - up +16.47% (+17.81% with dividends) through November, marking seven consecutive monthly gains from May through November. The S&P 500 hit all-time highs of $689.17 on December 11 before pulling back to $681.76 as markets absorbed the Fed's December 10 hawkish messaging.
Key chart observations:
- 🚀 Strong uptrend: Seven-month winning streak produced cumulative gains of 22.98%
- 📈 Recent consolidation: Modest +0.13% gain in November - smallest monthly gain of 2025
- 🎢 November volatility: Index declined 5.7% from October high before reversing in one of the largest intra-month reversals on record
- ⚠️ Elevated valuations: Forward P/E of 22.5 vs. 5-year average of 20.0 and 10-year average of 18.7
- 💔 Tech correction: AI stocks lost $800 billion in November, pressuring tech-heavy index
- 📊 Current price: $607.00 trading -2.4% below recent highs, consolidating pre-FOMC
Gamma-Based Support & Resistance Analysis
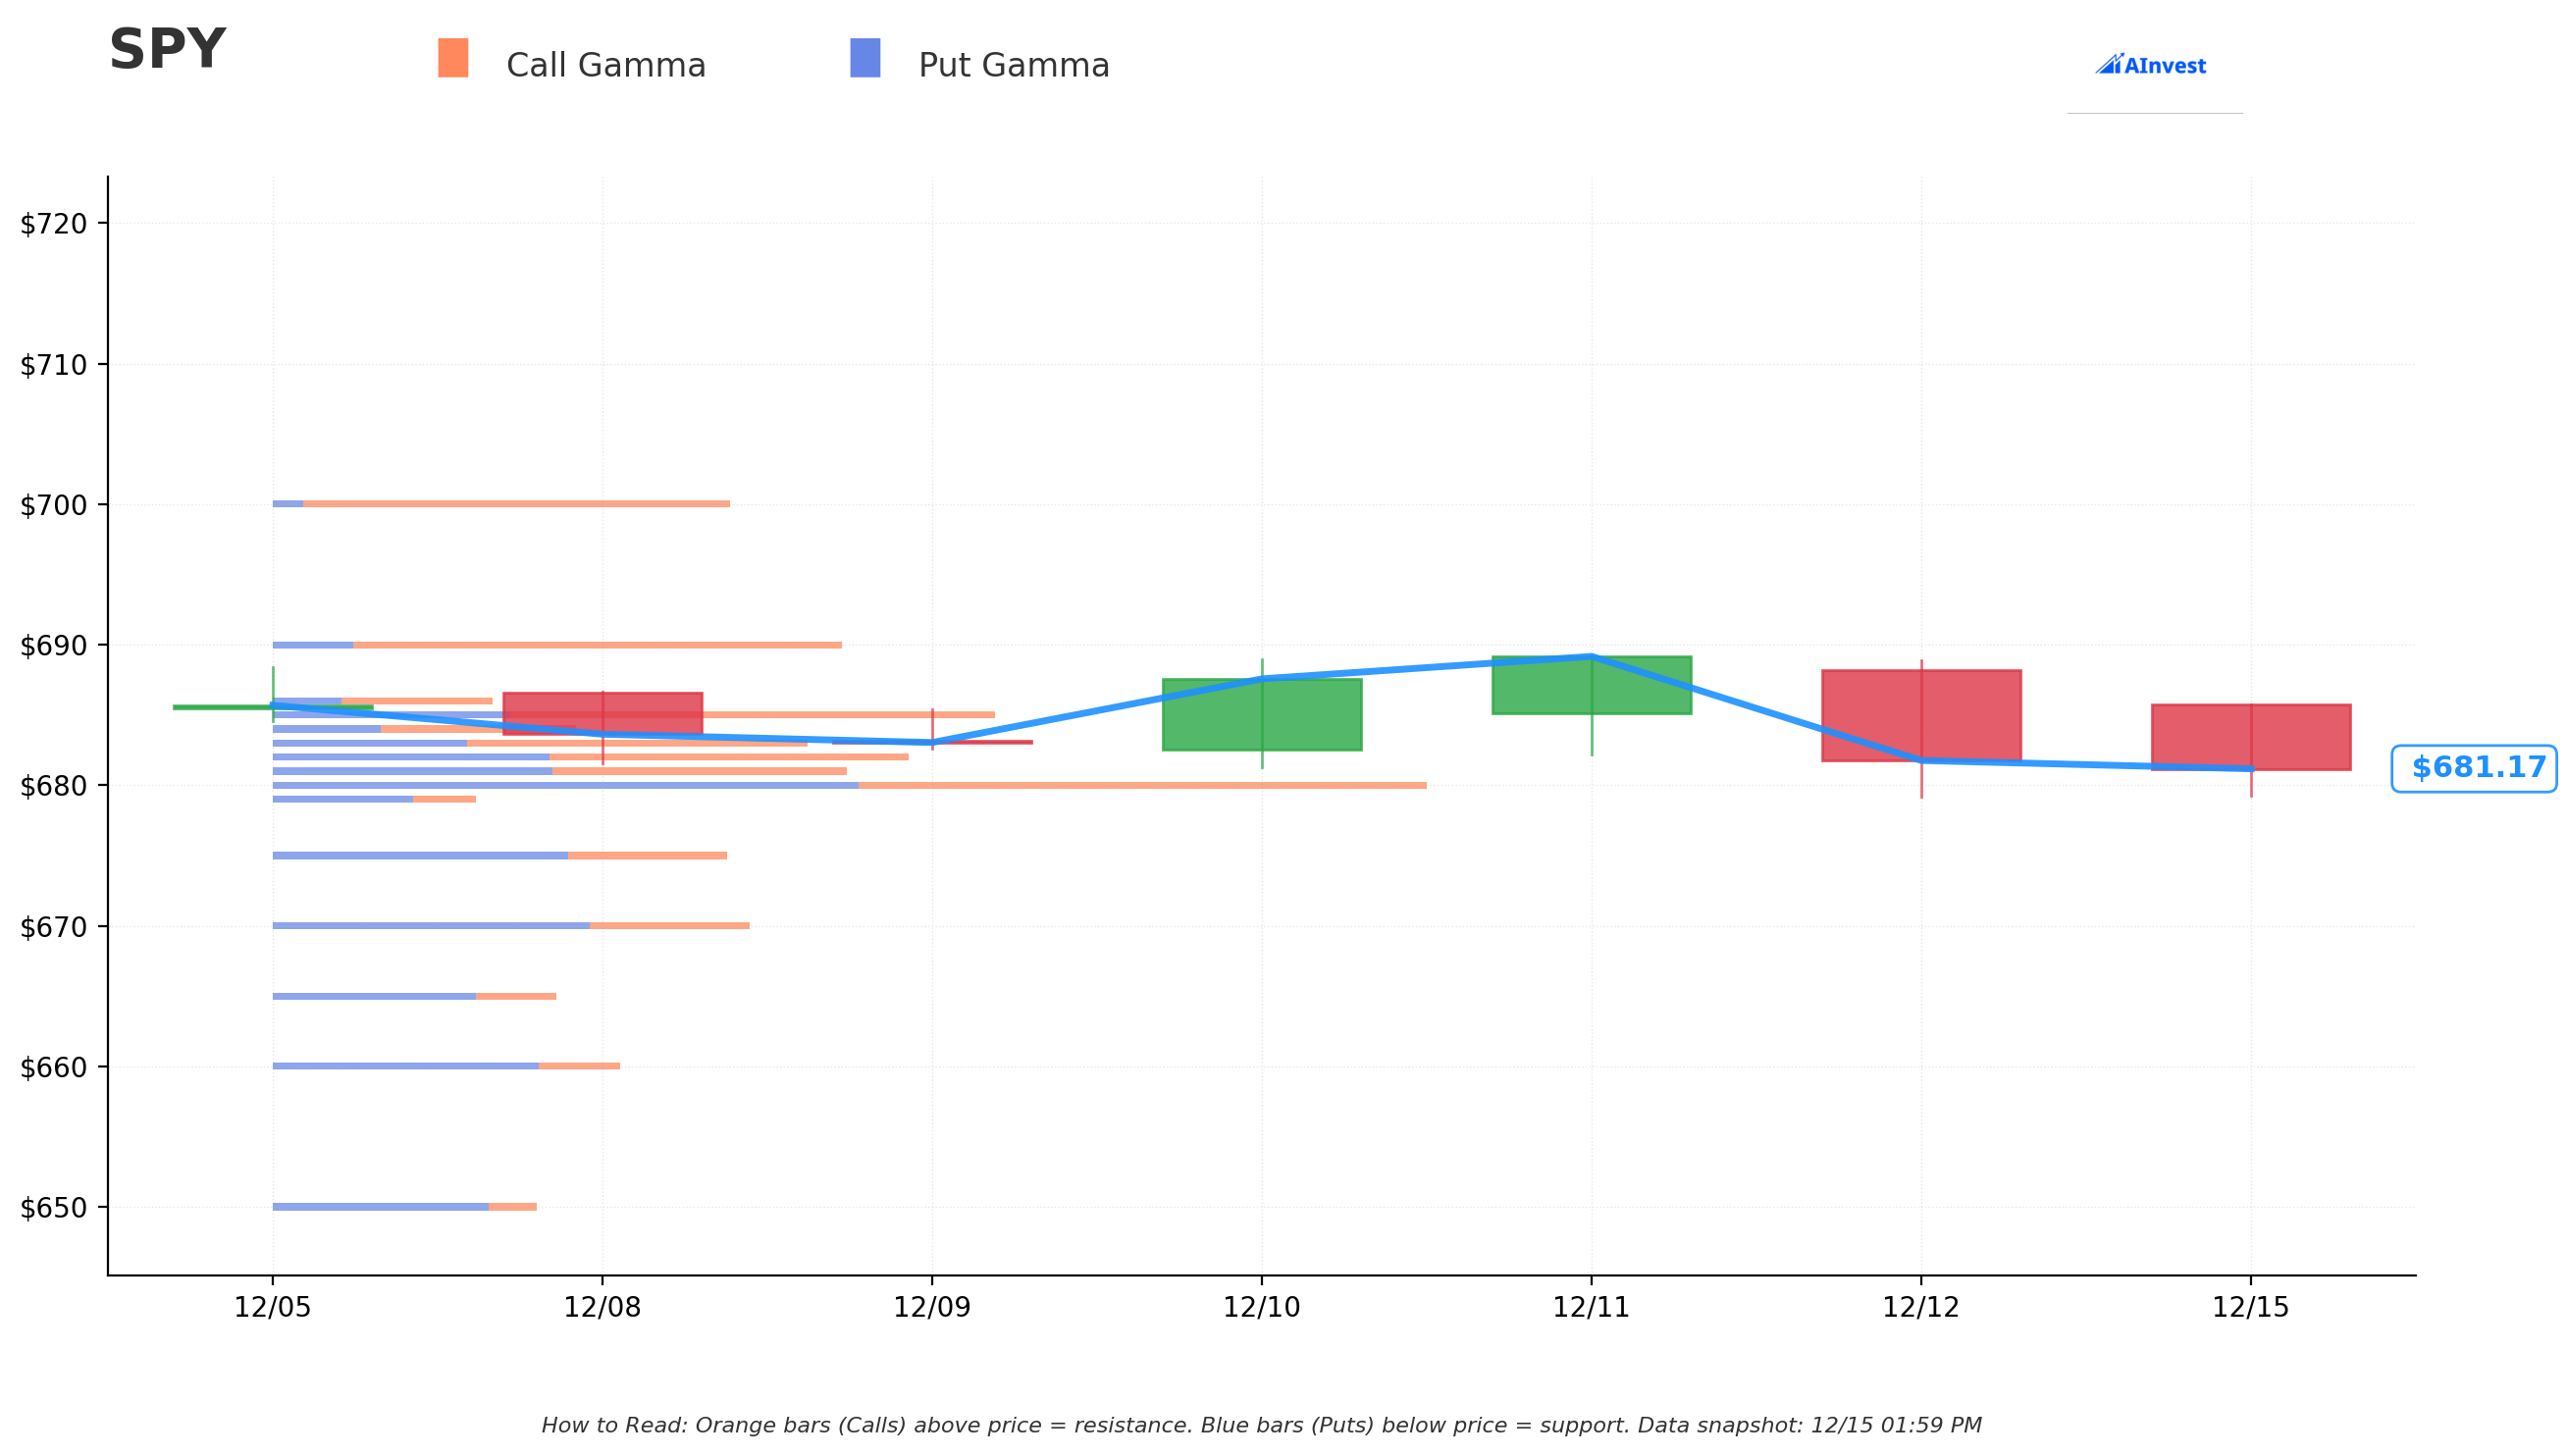
Current Price: $681.01
The gamma exposure map reveals critical price magnets that will govern near-term price action around FOMC:
🔵 Support Levels (Put Gamma Below Price):
- $681 - Immediate support with 304B total gamma exposure (0.15% distance - RIGHT HERE!)
- $680 - Strong floor with 615B gamma (0.15% below - STRONGEST NEARBY SUPPORT)
- $675 - Secondary support at 239B gamma (0.88% below)
- $670 - Significant floor with 250B gamma (1.62% below)
- $660 - Major structural support at 185B gamma (3.09% below - critical level if breakdown occurs)
🟠 Resistance Levels (Call Gamma Above Price):
- $682 - Immediate ceiling with 317B gamma (0.15% overhead - tiny resistance)
- $683 - Secondary resistance at 256B gamma (0.29% above)
- $685 - Moderate ceiling with 370B gamma (0.59% above)
- $690 - Major resistance zone at 291B gamma (1.32% above)
- $700 - Extended upside target with 235B gamma (2.79% rally required - psychological barrier)
What this means for traders: SPY is trading in a TIGHT consolidation range between $680-$682 with massive gamma walls on both sides creating a compression zone. The options market is essentially saying: "We're waiting for FOMC to tell us which direction to break." Notice the strong $680 support (615B gamma - the single largest nearby level) which should provide solid floor pre-FOMC.
Net GEX Bias: Bullish (3,135B call gamma vs 2,929B put gamma = +206B net bullish) - Overall positioning remains bullish, but immediate price action constrained in tight range awaiting Fed catalyst.
Key insight: The butterfly spread strikes ($500, $535, $550, $585, $600) all fall WELL BELOW current support levels, confirming this is tail-risk hedging for a significant market decline (5-15%), not a base-case scenario.
Implied Move Analysis
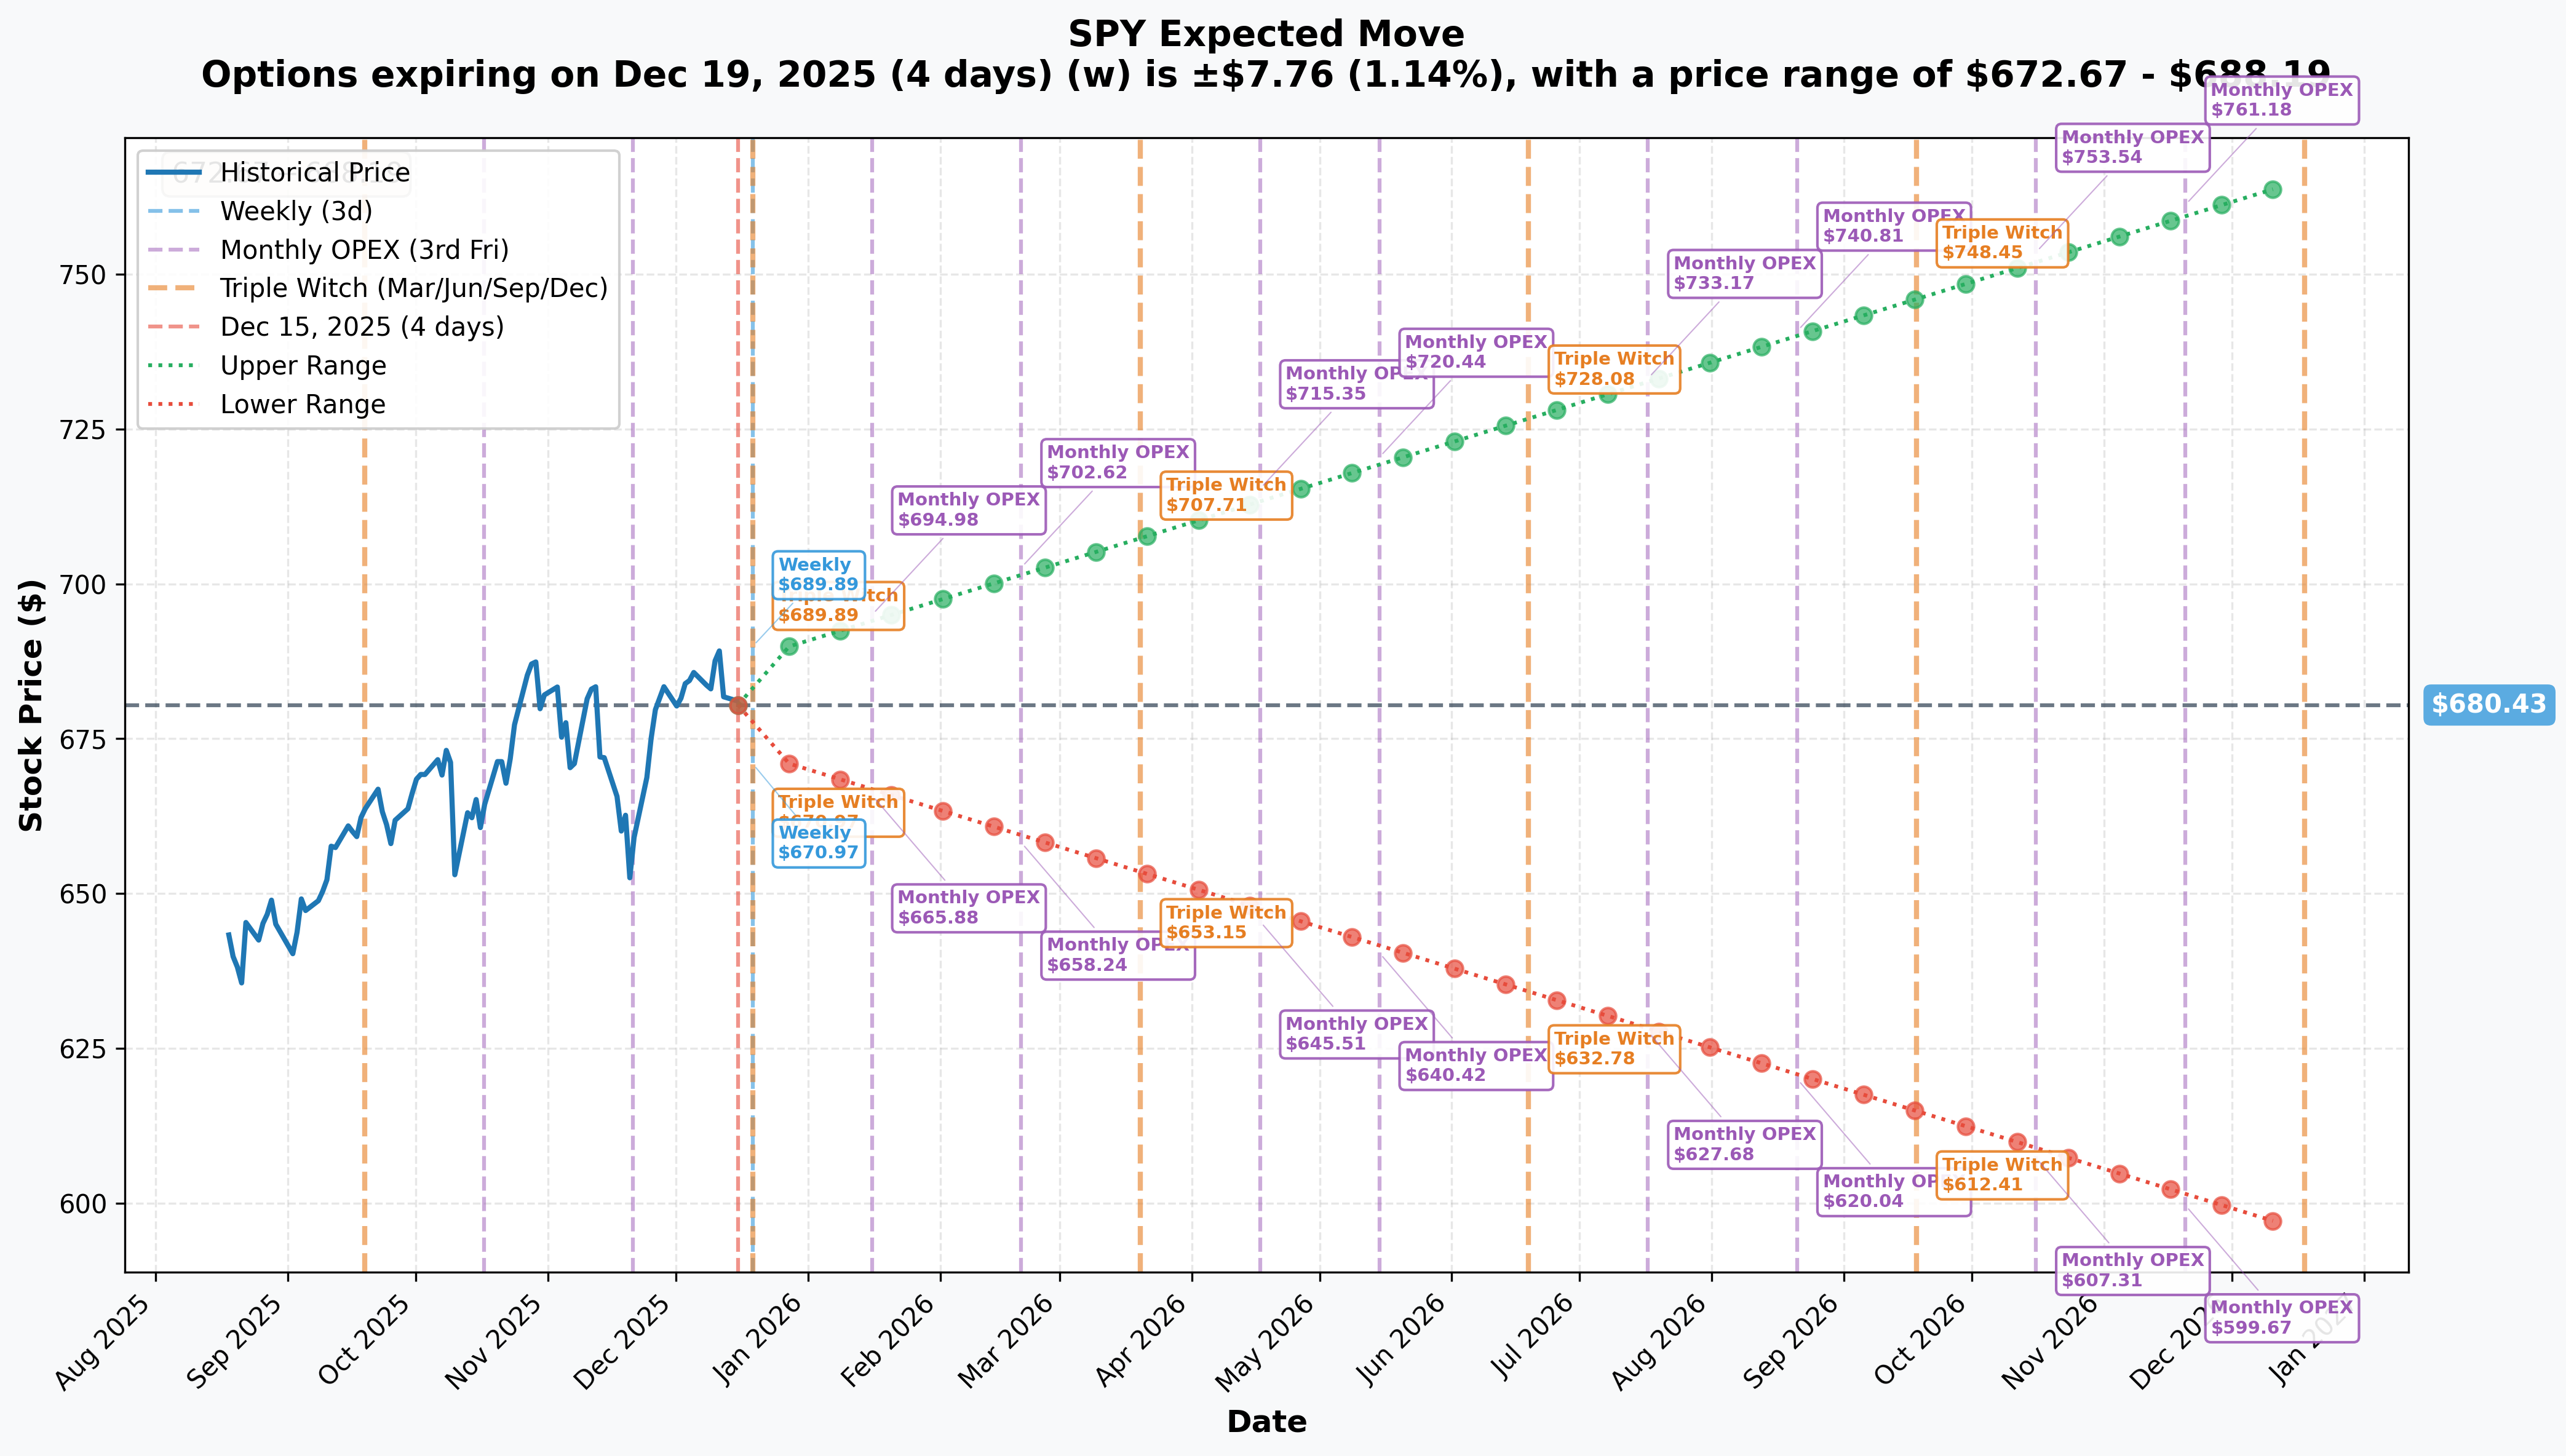
Options market pricing for upcoming expirations:
- 📅 Weekly (Dec 19 - 4 days - TRIPLE WITCHING!): ±$7.76 (±1.14%) → Range: $672.67 - $688.19
- 📅 Monthly OPEX (Jan 16 - 32 days): ±$14.53 (±2.14%) → Range: $665.88 - $694.98
- 📅 Quarterly Triple Witch (Mar 20 - 95 days): ±$27.28 (±4.01%) → Range: $653.15 - $707.71
- 📅 Yearly LEAPS (Dec 18, 2026 - 368 days): ±$85.00 (±12.49%) → Range: $595.43 - $765.42
Translation for regular folks: Options traders are pricing in a 1.14% move ($7.76) by December 19 which includes the FOMC meeting and triple witching expiration. That's relatively modest volatility expectations given the magnitude of the catalyst! The market thinks SPY will trade in a $672-$688 range through Friday.
Critical observation: The January expiration (when the butterfly spread long puts expire) has a lower range of $665.88 - well above the $550 and $600 strike protection zone. This confirms the put structure is tail-risk insurance, not a base-case bearish bet. The trader is protecting against a move BEYOND normal expectations.
FOMC volatility insight: The relatively low 1.14% implied move for this week suggests the market already priced in the December 10 rate cut. However, any surprise in forward guidance, inflation commentary, or 2026 rate path could trigger outsized moves.
🎪 Catalysts
🔥 Already Happened - Recent Catalysts
Federal Reserve Rate Decision - December 10, 2025 ✅
The FOMC concluded its final meeting of 2025 with a 25 basis point rate cut announced on December 10, bringing the federal funds rate to 3.50%-3.75%:
- 🗳️ Unusual dissent: Decision passed 9-3, with Stephen I. Miran voting for larger 50bp cut, while Austan D. Goolsbee and Jeffrey R. Schmid preferred no change
- 📊 Hawkish dot plot: Indicated just one cut in 2026 and another in 2027, significantly fewer than markets priced
- 💬 Powell's caution: Fed Chair stated Fed is "well positioned to wait and see how the economy evolves"
- 📉 Market reaction: SPY declined from December 11 high of $689.17 to $681.76 by December 15 (-1.1%) as markets recalibrated 2026 expectations
AI/Technology Sector Correction - November 2025 ✅
The AI-driven tech sector experienced significant correction serving as major headwind for SPY given tech's 31% index weighting:
- 💸 AI-focused stocks lost $800 billion in November
- 📉 Nvidia fell 12.6%, AMD and Micron each slumped >16%
- ⚖️ Tech companies: 31.1% of S&P 500 market value but only 20.8% of earnings
- 🔻 December pressure continued: Oracle plunged 11% on AI spending concerns
S&P 500 November Performance ✅
- 📊 Modest +0.13% gain - smallest monthly gain of 2025
- 🎢 Declined 5.7% from October high before reversing
- 🔄 Sector rotation: Healthcare led with +9.14%, while Tech fell -4.36%
🚀 Immediate Catalysts (This Week!)
November 2025 Employment Report - December 16, 2025 (TOMORROW!) 📊
Release: Monday, December 16, 2025, at 8:30 AM ET
The first comprehensive labor market update in over two months due to October government shutdown:
- 🎯 Unemployment expected near 4.4% - highest in nearly four years but not recessionary
- ⚠️ ADP showed unexpected -32,000 job decline in November raising concerns
- 📊 Print >100,000 supports "still tight" narrative; <50,000 accelerates "soft landing" concerns
- 💡 Market impact: Critical for validating Fed policy stance - weak data could pressure equities on growth concerns
November 2025 CPI Report - December 18, 2025 (WEDNESDAY!) 🔥
Release: Wednesday, December 18, 2025, at 8:30 AM ET
The first inflation reading in two months following government shutdown:
- 🎯 Consensus: 2.9%-3.1% YoY - drifting away from Fed's 2% target
- ⚠️ October month-over-month data permanently missing - complicates Fed assessment
- 📊 Above 3.1% validates Fed's cautious 2026 stance (bearish for equities)
- 📉 Below 2.9% supports more 2026 cuts (bullish for risk assets)
- ⏰ Lands AFTER butterfly spread execution - trader positioned BEFORE this major catalyst
Options Expiration - December 19, 2025 (FRIDAY - TRIPLE WITCHING!) 🔮
Friday, December 19 marks quarterly "Triple Witching" when stock options, index options, and futures expire together:
- 🌪️ Elevated trading volumes and potential short-term volatility
- 🎯 Heavy options positioning at $680-$685 could create price magnetism
- 📊 Year-end rebalancing flows overlap with expiration creating complex dynamics
📅 Near-Term Catalysts (Next 30 Days)
Santa Claus Rally - December 24-January 5 🎅
The traditional Santa Rally encompasses last five trading days of December and first two of January:
- 📈 S&P 500 averages 1.3% return, 79% success rate since 1950
- 🎁 December averages +1.5% gains
- ⚠️ 2024 anomaly: SPY declined -2.4% in December despite 23.3% annual gain
- 💰 Driven by: Low volumes, tax-loss harvesting completion, window dressing, bonus deployment
- 🎯 This is the UPSIDE scenario that makes the butterfly spread expire worthless (trader's likely outcome)
Year-End Portfolio Rebalancing Flows 🔄
Final trading days of December 2025:
- 💸 ~$20 trillion in pension/target-date funds subject to rebalancing
- 📊 Stocks outperformed bonds by >20 points for two consecutive years
- ⚖️ Could create $250+ billion in equity selling pressure
- ⏰ Activity peaks in final 2-3 trading days of month
🎯 Medium-Term Catalysts (Q1 2026)
Q4 2025 Earnings Season - January-February 2026 📊
- 📈 S&P 500 expected to report +8.1% YoY earnings growth
- 💰 Q4 bottom-up EPS estimate: $70.41
- 🎯 Forward P/E: 22.5 vs. 5-year average 20.0
- 🏦 Financials expected +12.7% growth
- ⚠️ Tech sector facing elevated expectations after November correction
🎲 Price Targets & Probabilities
Using gamma levels, implied move data, and catalyst timeline through January expiration:
📈 Bull Case (35% probability)
Target: $700-$710
How we get there:
- 🎯 December 16 employment data shows stabilization (100,000+ payrolls, unemployment steady at 4.4%)
- 📊 December 18 CPI prints below 2.9% - validates disinflationary trend
- 🎅 Santa Rally materializes delivering historical 1.3% gain into year-end
- 💰 Year-end pension rebalancing less severe than feared as institutions frontloaded sales
- 🤖 Tech sector stabilizes after November correction - rotation back into growth
- 🌍 No geopolitical surprises or policy shocks
- 📈 Breakout above $690 gamma resistance triggers technical rally to $700
- 🎊 Low-volume holiday trading reduces selling pressure
Key levels to watch:
- Break and hold above $690 confirms bullish momentum
- $700 psychological barrier becomes next magnet
- Implied move upper range of $694.98 (Jan OPEX) would be tested
Butterfly P&L: Spread expires worthless, trader loses net ~$0-500K (essentially break-even on $45M structure) - This is their TARGET scenario! Insurance served its purpose, no payout needed.
🎯 Base Case (45% probability)
Target: $665-$685 range (CHOPPY CONSOLIDATION)
Most likely scenario:
- ✅ Economic data mixed: Employment okay but not strong, CPI sticky around 3.0%
- 📊 Markets digest Fed's hawkish 2026 guidance (only one cut projected)
- 🎢 Trading within gamma support ($675-$680) and resistance ($685-$690) bands
- 🤝 Modest Santa Rally (+0.5-1.0%) but muted by elevated valuations
- 💤 Volume drops into holidays creating range-bound action
- 🔄 Sector rotation continues: defensive sectors outperform tech
- ⚖️ Rebalancing flows create some pressure but absorbed by year-end buyers
- 📉 Tech sector remains weak but doesn't cascade lower
- 🎯 Triple witching December 19 creates volatility spike then quick reversion to range
What this means: SPY consolidates in tight $665-$685 range through January expiration. The butterfly spread sees minimal profit (market didn't break down) but insurance premium was well-spent for peace of mind during uncertain FOMC period.
Butterfly P&L: Spread expires with small profit if SPY $665-$675, small loss if $685+, break-even around $680 - essentially neutral outcome validating zero-cost structure brilliance.
Why 45% probability: Most institutional players positioned for "muddle through" scenario - growth slowing but not collapsing, inflation sticky but not accelerating, Fed on hold. Current valuations (22.5x P/E) make big upside unlikely without multiple expansion catalyst.
📉 Bear Case (20% probability)
Target: $620-$650 (TEST THE PROTECTION ZONE!)
What could go wrong:
- 😰 December 16 employment misses badly (<50K payrolls) - recession fears spike
- 🚨 December 18 CPI above 3.2% - sticky inflation forces Fed to delay 2026 cuts entirely
- 🇨🇳 Geopolitical shock: China/Taiwan tensions, Middle East escalation
- 💸 Tech selloff accelerates - Oracle/AI spending concerns spread to broader market
- 📊 Tech sector comprises 31.1% of market cap but 20.8% of earnings - multiple compression
- 🏦 Financial sector weakness on prolonged higher-for-longer rates
- 💰 Year-end rebalancing flows hit harder than expected - $250B+ selling
- 🔨 Break below $670 gamma support triggers cascade selling
- ⚠️ "Santa Rally failure" - historically bearish signal for January returns
Critical support levels:
- 🛡️ $675-$680: First major gamma floor (615B at $680) - MUST HOLD
- 🛡️ $670: Secondary floor (250B gamma) - important psychological level
- 🛡️ $660: Deep support (185B gamma) - 3% pullback from current
- 🛡️ $650: Disaster scenario - tests recent November lows
- 🎯 $600-$550: BUTTERFLY PROFIT ZONE - trader's puts maximize value here!
Butterfly P&L in Bear Case:
- 📊 SPY at $580 on Jan 23: $600 puts worth $20, $550 puts worth ~$0 = ~$15M profit
- 📊 SPY at $550 on Jan 23: Maximum profit zone = $600 puts worth $50 = $37.5M profit!
- 📊 SPY at $520 on Jan 23: Profit declines as $500 puts activate limiting upside
Probability assessment: Only 20% because requires multiple negative catalysts to align. S&P 500 fundamentals remain solid (8.1% Q4 earnings growth expected), Fed cutting rates, and historical Santa Rally seasonality provides tailwind. The butterfly buyer clearly thinks this has ~15-20% odds or they wouldn't structure $45M of protection.
💡 Trading Ideas
🛡️ Conservative: Cash Secure Puts at Support
Play: Sell cash-secured puts at major gamma support AFTER this week's catalysts clear
Structure: Sell $675 puts (January 30 expiration - same as short leg of butterfly)
Why this works:
- 🎯 $675 represents major gamma support (239B) - 0.9% below current price
- 💰 Collect premium for obligation to buy SPY at levels institutions are defending
- 📊 IF assigned, acquire SPY at -1.5% discount with strong technical support
- ⏰ Wait until after Dec 16 employment and Dec 18 CPI to see market reaction
- 🛡️ Cash-secured = defined risk, can hold SPY long-term if assigned
- 📈 Probability of profit ~70% based on 1-sigma implied move
Estimated P&L:
- 💰 Collect ~$3.00-4.00 premium per contract (~0.5% return in 45 days)
- 📊 Annual return if rolled monthly: ~6-8% on cash
- 🎯 Assigned at $675: Effective cost basis $671-672 after premium (1.5% discount)
- ⚠️ Max risk: Obligated to buy SPY at $675 (must have cash available)
Entry timing:
- ⏰ Wait until December 18 AFTER CPI print (see market reaction)
- 🎯 Only enter if SPY trading $680+ (gives cushion)
- ❌ Skip if SPY already below $675 (too close to strike)
Position sizing: Only commit capital you're comfortable deploying into SPY at $675
Risk level: Low-Moderate (cash-secured, willing to own SPY) | Skill level: Intermediate
Expected outcome: Collect premium most likely as SPY stays above $675. If assigned, own SPY at attractive level with strong support underneath.
⚖️ Balanced: Post-Catalyst Bull Put Spread
Play: After this week's data releases, sell bull put spread betting SPY holds support
Structure: Sell $670 puts / Buy $660 puts (January 16 expiration)
Why this works:
- 🎢 Volatility elevated pre-FOMC/CPI - wait for IV crush after catalysts pass
- 📊 Defined risk spread ($10 wide = $1,000 max risk per spread)
- 🎯 $670 represents solid gamma support (250B) - 1.6% below current
- 🤝 $660 deep support (185B gamma) - 3% pullback would be healthy consolidation
- 📈 Probability of profit ~75% - bullish bias but protected below $660
- 💰 Credit received provides cushion and income
Estimated P&L (adjust after seeing post-catalyst IV):
- 💰 Collect ~$2.50-3.50 credit per spread (after IV drops)
- 📈 Max profit: $250-350 if SPY above $670 at expiration
- 📉 Max loss: $650-750 if SPY below $660
- 🎯 Breakeven: ~$667-668
- 📊 Risk/Reward: ~2:1 (favorable for bullish outlook)
Entry timing:
- ⏰ Wait until December 19 (after employment, CPI, and FOMC uncertainty clears)
- 🎯 Only enter if SPY trading $678+ (gives room to work)
- ❌ Skip if SPY already below $672 (spread too close to risk)
Position sizing: Risk only 3-5% of portfolio per spread
Risk level: Moderate (defined risk, bullish directional) | Skill level: Intermediate
🚀 Aggressive: Ride the Santa Rally - Call Debit Spread (TIMING CRITICAL!)
Play: IF data comes in benign, play for Santa Rally with leveraged call spread
Structure: Buy $690 calls / Sell $700 calls (January 16 expiration - captures full Santa Rally window)
Why this could work:
- 🎅 Santa Rally averages 1.3% with 79% success rate
- 📊 SPY currently $681 - $690 target only 1.3% rally (matches historical Santa average!)
- 💰 Defined risk call spread caps cost while maintaining upside leverage
- 🎯 $690 gamma resistance becomes support if broken - momentum trade
- 📈 Low holiday volumes could accelerate moves on light buying
- 🎊 Year-end "window dressing" by institutions boosts blue-chip stocks
- ⚡ If CPI comes in cool and employment stable, sets up perfect bullish setup
Why this could blow up (SERIOUS RISKS):
- ⚠️ TIMING DEPENDENT: Only works if Dec 16-18 data benign - bad prints kill thesis instantly
- 💸 Expensive: Call spread costs $4-5 ($400-500 per spread)
- 🎢 Tech weakness: If November tech correction continues, drags SPY lower
- 📊 Rebalancing pressure: $250B institutional selling could overpower Santa buyers
- 😱 Gamma ceiling: $690 has 291B resistance - hard level to break without catalyst
- 🚨 Geopolitical risk: Holiday period historically sees unexpected news events
- ⏰ Time decay: Theta burns daily if SPY stays range-bound
Estimated P&L:
- 💰 Cost: ~$4.50-5.00 per spread (mid-point of $690/$700 strikes)
- 📈 Max profit: $5.00-5.50 if SPY above $700 (50-100% ROI)
- 🎯 Breakeven: ~$694-695 (need 2% rally from current $681)
- 💀 Max loss: $4.50-5.00 if SPY below $690 (100% loss)
CRITICAL REQUIREMENTS - DO NOT attempt unless:
- ✅ December 16 employment data shows ≥100K payrolls, unemployment stable
- ✅ December 18 CPI prints ≤3.0% (validates disinflationary trend)
- ✅ SPY holds above $680 after both releases (confirms buyers stepping in)
- ✅ You can monitor position daily and take profits at $695-697 (don't wait for $700)
- ✅ You accept 100% loss if data disappoints or geopolitical shock occurs
Entry timing:
- ⏰ ONLY enter AFTER December 18 CPI if both employment and inflation data benign
- 🎯 Need SPY $682-685 range to have room to run to $690-700
- ❌ Skip entirely if either data point disappoints expectations
Exit discipline:
- 📈 Take 50% profits at SPY $692-693 (lock in gains, reduce risk)
- 🎯 Take remaining 50% at SPY $697-698 (don't be greedy waiting for $700)
- ⏰ Exit entirely by January 10 regardless of profit/loss (don't hold to expiration)
Risk level: HIGH (directional, timing-dependent, can lose 100%) | Skill level: Advanced only
Probability of profit: ~40% (need multiple things to go right: benign data + Santa Rally + break overhead resistance)
⚠️ Risk Factors
Don't get caught by these potential landmines:
-
🚨 FOMC Forward Guidance Risk: While the December 10 rate cut is done, the dot plot showing only one 2026 cut could pressure valuations further if Powell reiterates hawkish stance in upcoming communications. Markets priced in 3-4 cuts for 2026 earlier this year - massive recalibration creates downside risk. Any hint of ZERO 2026 cuts would be catastrophic for equity multiples.
-
📊 Sticky Inflation Regime: Inflation drifting toward 3% away from Fed's 2% target. December 18 CPI print above 3.2% validates "higher for longer" narrative. Tariff passthrough and fiscal expansion pose 2026 price stability risks. Persistent 3%+ inflation forces Fed to maintain restrictive policy = multiple compression for equities. Current P/E of 22.5 vs historical 18.7 avg means 17% downside from multiple compression alone.
-
💸 Valuation Stretched at Cycle Highs: Forward P/E of 22.5 is 13% above 5-year average (20.0) and 20% above 10-year average (18.7). Tech sector 31.1% of market cap vs only 20.8% of earnings is unsustainable. Already up 16.47% YTD - significant gains captured. Zero margin of safety at current levels. ANY disappointment in Q4 earnings (expected +8.1% growth) triggers valuation reset.
-
🤖 Tech Concentration Risk Remains: Despite November's $800B AI stock selloff, concentration risk persists. Nvidia accounts for 8% of S&P 500 with its gains representing 18% of index's 2025 return. Magnificent 7 dominance creates single-stock risk. Oracle's -11% plunge on AI spending concerns ($10B negative free cash flow) shows AI bubble vulnerability. If monetization disappoints broadly, tech's 31% weighting creates massive SPY downside.
-
📉 Labor Market Deterioration Accelerating: Unemployment at 4.4% - highest in nearly four years. ADP showing unexpected -32,000 jobs decline in November. Further weakness shifts narrative from "soft landing" to "recession." Consumer spending (70% of GDP) vulnerable if labor market cracks. December 16 employment report CRITICAL - miss below 50K payrolls triggers growth scare selloff.
-
💰 Year-End Rebalancing Tsunami: ~$20 trillion in pensions/target-date funds need rebalancing. Stocks outperformed bonds by >20 points for two years - extreme divergence requires large equity sales. Estimated $250+ billion selling pressure concentrated in final 2-3 trading days of December. Sophisticated traders front-run these flows, amplifying downside.
-
🐋 Smart Money Hedging at Scale: This $44.9M butterfly spread signals sophisticated institutions are WORRIED despite bullish fundamentals. When funds managing billions structure zero-cost tail-risk protection into FOMC rather than staying fully long, it's a major caution flag. The 3,000x unusual volume on some legs (literally unprecedented) shows this isn't routine hedging - this is defensive positioning by players with superior information and resources.
-
🎢 Government Shutdown Data Gaps Create Uncertainty: 43-day federal shutdown starting October 1 created permanent gaps in economic data. October employment and CPI never collected and won't be retroactively available. CBO projected -1.0% Q4 GDP reduction. Fed making policy decisions with incomplete information increases execution risk and potential for policy errors.
-
🌍 Geopolitical Wildcards into Year-End: Holiday periods historically see unexpected geopolitical events when decision-makers have limited staff. China/Taiwan tensions, Middle East instability, Russia/Ukraine conflict all remain unresolved. Any major flare-up during thin holiday trading could create outsized market moves. Current VIX of 17-19 suggests complacency - actual realized volatility could spike quickly.
-
📊 Santa Rally Failure = Bearish Omen: While historical 79% success rate is strong, 2024 saw -2.4% December decline despite 23.3% annual gain. When Santa window is negative, January and full-year returns weaker historically. Failed Santa Rally at current elevated valuations could trigger January cascade as "sell in January" becomes self-fulfilling.
-
🔨 Triple Witching Volatility December 19: Quarterly options/futures expiration creates elevated volatility. Massive gamma positioning at $680-$685 could create violent intraday swings as market makers hedge. Combined with FOMC/CPI uncertainty creates potential for gap moves that stop out positions before reversing.
🎯 The Bottom Line
Real talk: Someone just structured a $44.9 MILLION zero-cost butterfly spread protecting against 5-10% downside through January while remaining essentially neutral on cost. This isn't a bearish bet on America - it's sophisticated institutional risk management by a fund that's made MASSIVE returns in 2025's 16.5% rally and doesn't want to give it back during the highest-uncertainty period of the year.
What this trade tells us:
- 🎯 Tail-risk protection: The $550-$600 strike zone is 5-10% below current $607 - they're protecting against moves BEYOND normal ranges
- 💰 Zero-cost brilliance: Selling puts at slightly different strikes/expirations PAYS for downside insurance - genius structuring
- ⚖️ FOMC timing: Positioned 2 days before December 17-18 FOMC meeting suggests major policy uncertainty
- 📊 Capture all catalysts: Structure captures employment (Dec 16), CPI (Dec 18), FOMC, triple witching (Dec 19), Santa Rally, year-end rebalancing, AND Q4 earnings preview
- ⏰ Expires Jan 23/30: Perfectly timed to protect through highest-volatility period then exit
This is NOT a "sell everything and hide" signal - it's a "we've won big, let's protect those gains through uncertainty" signal.
If you own SPY or S&P 500 stocks:
- ✅ Take partial profits: Lock in 15-20% of 2025 gains at current $607 levels (up 16.5% YTD is EXCELLENT)
- 📊 Wait for catalysts: December 16-18 will DEFINE the January setup - don't front-run major data
- 🛡️ Consider protection: 2-3 month put spreads at $660-$670 provide defined-risk insurance (small cost for huge peace of mind)
- 🎯 Re-entry plan: Post-catalyst pullback to $665-$675 would be healthy consolidation offering better risk/reward
- ⚠️ Mental stop: $670 breaks and holds below = time to reduce risk significantly
If you're on the sidelines with cash:
- ⏰ Patience rewarded: Do NOT chase SPY at $607 with P/E of 22.5 before major catalysts
- 📅 Mark December 16-18: Employment + CPI will set the tone for Q1 2026
- 🎯 Best entry: Pullback to $665-$675 (gamma support zone) offers 2-3% better pricing with technical floor
- 📈 Bullish scenario: Data benign + Santa Rally pushes $690-700 = missed move but preserved capital for Q1 opportunities
- 📉 Bearish scenario: Data disappoints, breaks $670 = you avoided 5-7% drawdown, can enter $640-650 with conviction
If you're bearish:
- ⚠️ Don't fight the Fed YET: Three rate cuts in 2025 still provides accommodation - premature shorts get squeezed
- 📊 Wait for technical breakdown: Need decisive break below $670 to confirm trend change
- 🎯 Best bearish structure: Post-data put spreads ($670/$660 or $660/$650) offer defined risk after IV normalizes
- ⏰ Timing is everything: Santa Rally can melt up even overvalued markets - better to be late than early on shorts
Mark your calendar - Critical catalyst cascade:
- 📅 December 16 (Monday) 8:30 AM ET - November employment report (first clean data in 2 months!)
- 📅 December 18 (Wednesday) 8:30 AM ET - November CPI report (inflation trajectory critical)
- 📅 December 19 (Friday) - Triple witching options expiration (volatility spike likely)
- 📅 December 24 - January 5 - Santa Rally window (last 5 days Dec + first 2 days Jan)
- 📅 December 27-31 - Year-end rebalancing flows (watch for institutional selling pressure)
- 📅 January 16, 2026 - Monthly OPEX, $670/$660 put spread expiration
- 📅 January 23, 2026 - Long put leg of butterfly expires
- 📅 January 30, 2026 - Short put leg of butterfly expires
Final verdict: SPY's 16.5% YTD gain reflects legitimate strength - three Fed rate cuts, expected 8.1% Q4 earnings growth, stable economy, and historical Santa seasonality all support current levels. BUT, at 22.5x forward P/E with three major data releases in 4 days, multiple geopolitical risks, $250B rebalancing headwinds, and sticky 3% inflation, the risk/reward is NO LONGER favorable for aggressive new positioning.
The $44.9M institutional butterfly spread is a CLEAR signal: Enjoy your 2025 gains, but protect them through this minefield of catalysts.
Be smart. Let the data clear. Take some chips off the table. The market will still be here in January, and you'll sleep better having de-risked into uncertainty. 💪
This is a marathon, not a sprint. Protect your 2025 profits.
Disclaimer: Options trading involves substantial risk of loss and is not suitable for all investors. This analysis is for educational purposes only and not financial advice. Past performance doesn't guarantee future results. The extreme unusual scores (3,000x+ average volume) reflect trade size relative to recent SPY history - they do not imply trades will be profitable or that you should follow them. Complex multi-leg strategies like butterfly spreads require sophisticated understanding of options Greeks, expiration mechanics, and risk management. The FOMC meeting, employment data, and CPI create binary event risk with potential for 2-5% gaps. The butterfly spread trader may have complex institutional hedging needs not applicable to retail investors. Always do your own research and consider consulting a licensed financial advisor before trading. Santa Claus Rally historical statistics do not guarantee 2025 performance.
About SPDR S&P 500 ETF Trust: The world's first and largest ETF with ~$720 billion in assets, tracking the S&P 500 Index's 500 largest U.S. publicly traded companies across all sectors. Expense ratio: 0.0945%.