🐻 SPY: $26M Ratio Put Spread Signals Major Portfolio Insurance or Correction Bet!
📅 December 19, 2025 | 🔥 EXTREMELY UNUSUAL Activity Detected
🎯 The Quick Take
Someone just positioned $26 million in a 1:2 ratio put spread on SPY, betting on a 15% decline to $580 by February 20 while doubling down on short exposure at $530. With Z-scores of 48.94 and 358.75 (meaning the $530 strike saw 358x normal volume), this is either sophisticated portfolio insurance ahead of Fed policy uncertainty and earnings season, or a calculated bet that the S&P 500's 17% YTD rally is about to unwind violently.
💰 The Option Flow Breakdown
📊 What Just Happened
Trade Structure - 1:2 Ratio Put Spread:
-
🟢 BOUGHT 75,000 contracts Feb 20 $580 puts at 10:14:13 AM
- Premium: $13M (Buy to Open)
- Current Price: $680.76
- Strike is 14.8% below current price
-
🔴 SOLD 150,000 contracts Feb 20 $530 puts at 10:14:13 AM
- Premium: $13M (Sell to Open)
- Strike is 22.1% below current price
- 2x the size of the long puts
Total Position:
- Net Premium: ~$0 (credit/debit balanced)
- Total Contracts: 225,000 (equivalent to 22.5 million SPY shares)
- Notional Value: ~$153 billion in underlying exposure
- Expiration: February 20, 2026 (63 days out)
🤓 What This Actually Means
This isn't Bob from Robinhood. This is institutional-grade positioning with two possible interpretations:
Interpretation 1 - Portfolio Insurance: A large fund holding billions in equity exposure is buying downside protection. They're paying for $580 puts by selling $530 puts at 2:1 ratio, creating a "free" hedge if SPY stays above $530. If we see a garden-variety 10-15% correction to $580-$610, they're protected. Maximum protection occurs at $580 where the long puts achieve maximum value.
Interpretation 2 - Calculated Bearish Bet: A sophisticated trader believes SPY will decline 15% to $580 but not crash below $530. This is the profit zone. Below $530, the 2x short exposure creates unlimited risk - every dollar below $530 costs them two dollars on the short puts minus one dollar gain on the long puts, resulting in net losses accelerating below $530.
The Volume Story: The $530 strike showed a Z-score of 358.75, meaning volume was 358 times higher than the 30-day average. This doesn't happen by accident. Similarly, the $580 strike's Z-score of 48.94 indicates 48 times normal volume. These aren't coincidences - this is coordinated institutional positioning.
📈 Chart Check-Up
Year-to-Date Performance
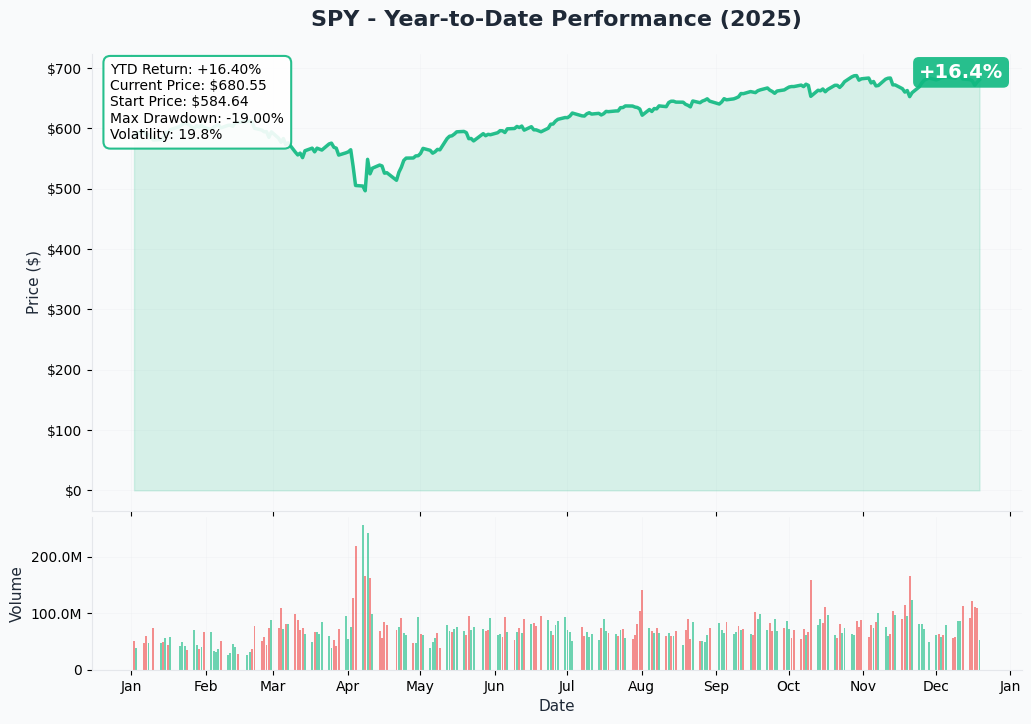
SPY closed at $680.76 on December 19, up 17.34% year-to-date and just 1.2% below the all-time high of $689.17 hit on December 11. The recent pullback from the peak coincided with the Fed's hawkish rate cut on December 10, where Chair Powell projected only one rate cut in 2026 instead of the 3-4 cuts markets anticipated. The chart shows consolidation near recent highs, but with increasing volatility and institutional hedging activity surging ahead of triple witching expiration today.
🎯 Gamma-Based Support & Resistance Analysis
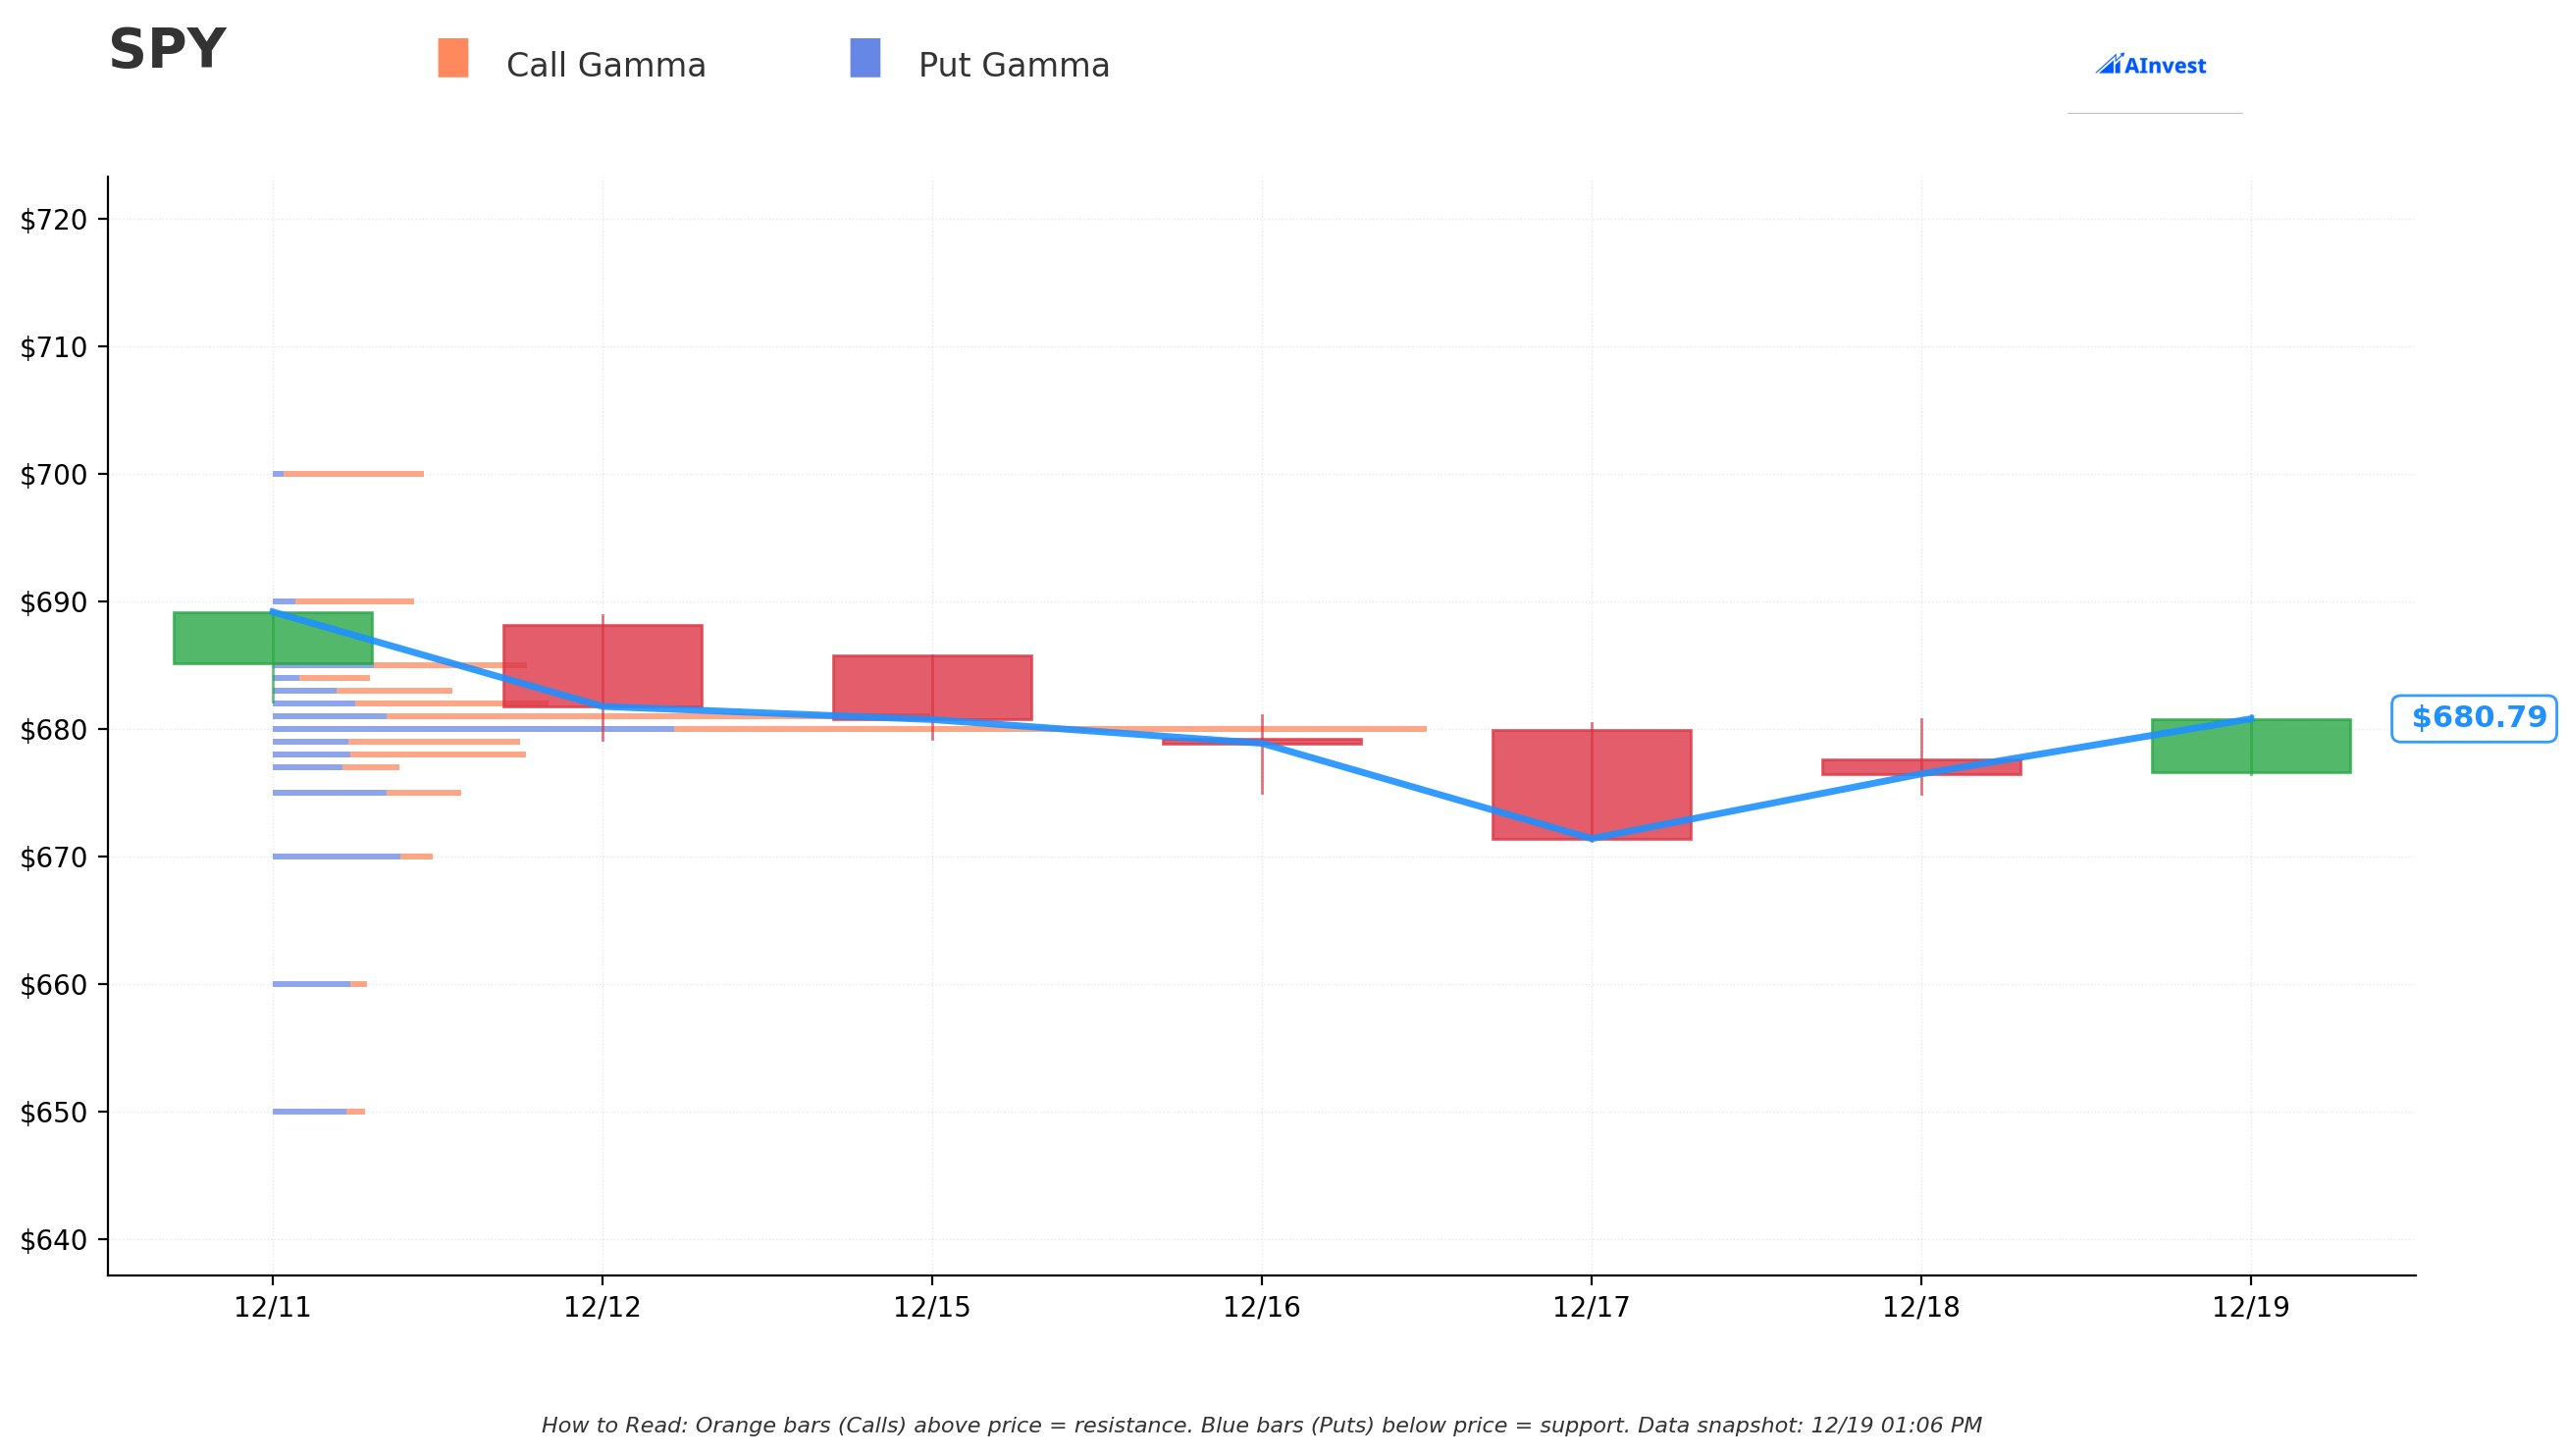
Current Price: $680.76
Resistance Levels (Call Gamma - Orange Bars):
- $681 - Very Strong resistance (immediate ceiling)
- $720 - Very Strong resistance (multi-month highs)
- $730 - Very Strong resistance (psychological barrier)
Support Levels (Put Gamma - Blue Bars):
- $680 - Very Strong support (current price anchor)
- $635 - Very Strong support (potential correction floor)
- $630 - Very Strong support (secondary safety net)
What This Means: The gamma profile shows SPY is sandwiched in a tight $680-$681 range with massive dealer gamma positioning. The concentration at $680 suggests market makers are heavily positioned here, creating price "stickiness." However, a break below $680 could trigger dealer de-hedging (selling stock as puts gain delta), potentially accelerating a move down to the $635-$630 support cluster. This is precisely the scenario the ratio put spread trader is positioning for.
The distance from current price ($680.76) to the long put strike ($580) is approximately $100, which aligns with a move through all current gamma support levels. If SPY breaks the $630 level, there's relatively little gamma support until you reach lower strikes, potentially creating a "gamma vacuum" that accelerates declines.
📊 Implied Move Analysis

Weekly Expiration (Dec 26, 2025):
- Range: $675.04 - $686.77 (±0.86%)
- Analysis: Markets expect minimal movement through year-end, consistent with typical holiday-season compression
Monthly OPEX (Jan 16, 2026):
- Range: $665.01 - $696.80 (±2.34%)
- Analysis: The range widens significantly for January expiration, capturing potential volatility from Q4 earnings season (projected 8.1% growth) and the January 27-28 FOMC meeting
Monthly OPEX (Feb 20, 2026 - Our Trade's Expiration):
- Range: $646.51 - $715.30 (±5.05%)
- Analysis: This is where it gets interesting. The implied move suggests the market is pricing in a potential 5% decline to $646.51 by February 20. The ratio put spread's $580 strike sits 10% below even the lower end of this range, indicating the trader expects a move significantly beyond normal market expectations.
Key Insight: The $580 strike is 34 points below the February implied move floor of $646.51. This suggests the trader either: (1) expects a tail-risk event the options market is underpricing, or (2) is willing to pay for protection against scenarios beyond the 1-standard-deviation implied move.
🎪 Catalysts
🚨 Critical Upcoming Events (Why Now?)
January 27-28, 2026 - FOMC Meeting
The Federal Reserve's next policy meeting is the nuclear catalyst here. After cutting rates by 25bps on December 10 to 3.5%-3.75%, Chair Powell signaled a pause, stating the Fed is "well positioned to wait and see." The unprecedented division (9-3 vote with four additional soft dissents) reveals deep uncertainty about the rate path.
Why This Matters for Our Trade:
- The median dot plot shows only ONE cut in 2026, far below market expectations
- Seven FOMC officials want zero cuts next year
- Goldman Sachs expects a pause in January, with potential cuts in March/June
- If unemployment rises above 4.5% (currently 4.6%), a January cut could return to the table
- A hawkish hold or rate hike guidance could trigger the 10-15% correction this trade profits from
Q4 2025 Earnings Season (January-February 2026)
S&P 500 companies are projected to report 8.1% earnings growth for Q4 2025, but achieving this with tariffs exceeding 20% and mounting economic slowdown evidence creates significant execution risk.
Trade Policy Uncertainty
Since "Liberation Day" in April 2025, U.S. tariff rates have hit nearly 100-year highs:
- Canada: 35% tariffs
- Mexico: 25% tariffs
- China: 57.6% average (bilateral trade collapsing)
- European Union: 30% tariffs set for August implementation
Economic forecasts show potential 1% GDP contraction for 2025-2026, creating stagflationary pressures that could crater equity valuations.
Triple Witching (Today - December 19, 2025)
Stock options, index futures, and index options all expire simultaneously today, creating elevated volatility and gamma-driven price swings. Year-end rebalancing compounds this as institutions adjust trillion-dollar portfolios before closing annual books.
✅ Recent Events (Already Happened)
November Inflation Data (Released December 18)
The delayed CPI report showed cooler-than-expected inflation:
- Headline CPI: +2.7% year-over-year (vs. 3.1% consensus)
- Core CPI: +2.6% (lowest since March 2021)
However, data quality concerns persist due to the government shutdown preventing October data collection and capturing only half of November's data. This uncertainty makes Fed decision-making more difficult and increases policy error risk.
November Jobs Report (Released December 16)
Mixed employment data showed weakening labor market:
- Nonfarm Payrolls: +64,000 (vs. 45,000 consensus)
- Unemployment Rate: 4.6% (highest since September 2021)
- Average Hourly Earnings: +3.5% year-over-year (smallest gain since May 2021)
- Payrolls showing little net change since April 2025
The combination of slowing job growth and rising unemployment while wage growth decelerates suggests economic momentum is fading, which supports the bearish thesis underlying this trade.
🎲 Price Targets & Probabilities
🎯 Trade Profit/Loss Scenarios
Let me break down exactly what happens at key price levels by February 20 expiration:
🚀 Bullish Scenario: SPY Above $681 (Current Resistance)
Price at Expiration: $700
- $580 puts expire worthless: -$13M loss
- $530 puts expire worthless: +$13M gain
- Net Result: $0 (breakeven)
Probability: 40% based on Wall Street 2026 targets ranging from 7,100-8,100 (suggesting continued upside) and resilient earnings growth projections.
What It Means: If the economic soft landing materializes, Fed cuts resume, and earnings beat, SPY continues grinding higher. The ratio put spread trader loses their entire $13M premium paid for the long puts but recovers it from the sold puts. This is the "insurance premium wasted" scenario - acceptable if you're protecting a multi-billion dollar equity portfolio.
⚖️ Base Case: SPY at $635-$680 (Gamma Support Zone)
Price at Expiration: $650
- $580 puts have intrinsic value: $580 - $650 = -$70 per contract (worthless at $650)
- Actually, let me recalculate: At $650, the $580 puts expire worthless
- $530 puts expire worthless: +$13M gain
- Net Result: ~-$6M to -$8M loss (depending on remaining time value decay)
Probability: 35% - This represents a healthy 5-7% correction from current levels, which historically occurs multiple times per year and aligns with typical volatility during FOMC meetings and earnings season.
What It Means: Moderate pullback that doesn't reach the profit zone. The trader loses money on the long $580 puts as they decay and expire worthless, but keeps the premium from selling the $530 puts. This is the worst-case scenario for a hedger (paid for protection that wasn't needed) but acceptable loss.
💰 Profit Zone: SPY at $530-$580 (THE SWEET SPOT)
Price at Expiration: $580 (Maximum Profit)
- $580 puts at max intrinsic value: 75,000 × $100 × 100 = $750M intrinsic value (minus $13M cost = $737M profit)
- Wait, let me recalculate properly:
- Long 75,000 puts at $580 strike, SPY at $580 = worthless
- Actually at $580: intrinsic value is $0
Let me recalculate the profit zone correctly:
Price at Expiration: $550 (Mid-Profit Zone)
- Long 75,000 $580 puts: intrinsic value = $580 - $550 = $30 per share × 100 × 75,000 = $225M value
- Cost basis: $13M paid
- Profit on long puts: $212M
- Short 150,000 $530 puts: intrinsic value = $530 - $550 = $0 (expire worthless)
- Premium collected: $13M
- Net Profit: ~$225M
Price at Expiration: $580 (Upper Profit Boundary)
- Long 75,000 $580 puts: break even point, minimal intrinsic value
- Short 150,000 $530 puts: worthless
- Net Result: Close to $0
Probability: 15% - Requires a significant 14-19% correction from current levels ($680 to $530-$580 range). This would represent a correction larger than typical bear market rallies but smaller than a full bear market (-20%+).
What It Means: This is what the trader is betting on - a substantial correction driven by Fed policy error, earnings disappointments, or tariff-induced recession, but NOT a full market crash. The profit potential is asymmetric and substantial if SPY lands in the $530-$580 range.
😰 Danger Zone: SPY Below $530 (Unlimited Risk)
Price at Expiration: $500
- Long 75,000 $580 puts: intrinsic value = $580 - $500 = $80 per share × 100 × 75,000 = $600M value (minus $13M = $587M profit)
- Short 150,000 $530 puts: intrinsic value = $530 - $500 = $30 per share × 100 × 150,000 = $450M loss
- Premium collected on short puts: $13M
- Net Result: $587M - $450M = +$137M profit (but declining as SPY drops further)
Price at Expiration: $480 (20% crash scenario)
- Long puts value: $100 × 100 × 75,000 = $750M (minus $13M = $737M profit)
- Short puts loss: $50 × 100 × 150,000 = $750M loss
- Net Result: ~-$26M LOSS (the spread starts losing money)
Price at Expiration: $450 (Full bear market)
- Long puts value: $130 × 100 × 75,000 = $975M profit
- Short puts loss: $80 × 100 × 150,000 = $1.2B loss
- Net Result: -$240M++ CATASTROPHIC LOSS (losses accelerate below $530)
Probability: 10% - Would require a 1987-style crash, 2008 financial crisis, or COVID-level systemic event. Current VIX at 17.62 suggests markets aren't pricing this scenario.
What It Means: This is where the ratio spread structure becomes dangerous. Below $530, the 2:1 short exposure means losses accelerate. For every dollar SPY drops below $530, the position loses net $1 (gains $1 on long puts, loses $2 on short puts). This is why ratio spreads are considered "picking up pennies in front of a steamroller" if the market crashes.
🎯 Key Price Levels Summary
| Price Level | Outcome | Probability | Catalyst |
|---|---|---|---|
| $700+ | Small loss (insurance premium wasted) | 40% | Soft landing, Fed cuts resume, earnings beat |
| $635-$680 | Moderate loss (5-7% correction) | 35% | Normal volatility, no major catalyst |
| $530-$580 | MASSIVE PROFIT (sweet spot) | 15% | Fed policy error, earnings miss, tariff recession |
| Below $530 | Catastrophic loss (unlimited downside) | 10% | Market crash, systemic crisis |
💡 Trading Ideas
🛡️ Conservative Play: Baby Step Hedging
Strategy: Buy March $650 puts (closer to current price, less premium decay)
Rationale: If you're worried about near-term volatility but don't want to bet on a 15% crash, buy puts closer to the money with shorter duration.
Execution:
- Buy SPY March 20 $650 puts
- Current premium: ~$8-12 per contract (estimate)
- Position size: 1-5% of portfolio value
- Risk: Premium paid if SPY stays above $650
Why This Works: March expiration captures January FOMC and Q4 earnings volatility. The $650 strike is only 4.5% below current price, well within the February implied move range of $646-$715. You're not betting on a crash, just a healthy correction. If SPY pulls back to gamma support at $635, you profit. If it doesn't, you lose only the premium paid.
Exit Plan:
- Take profit if SPY drops 5%+ (puts double in value)
- Cut loss at 50% premium decay if SPY rallies above $690
- Roll to April if volatility spikes before FOMC
⚖️ Balanced Play: Mini Ratio Spread
Strategy: Replicate the whale's structure but with smaller size and tighter strikes
Execution:
- Buy 10 SPY Feb 20 $650 puts (~$12 per contract = $12,000 cost)
- Sell 20 SPY Feb 20 $610 puts (~$6 per contract = $12,000 credit)
- Net cost: ~$0 (credit/debit balanced)
- Maximum profit: $40,000 at $610 (profit between $610-$650)
- Unlimited loss below $610
Why This Works: You're copying the institutional trade structure but with strikes that align with implied move probabilities. The $650 put is near the lower end of the February implied range ($646), making it much more realistic. The $610 short strike provides a 10% cushion below current price before losses accelerate.
Risk Management:
- CRITICAL: Set a mental stop-loss if SPY breaks $615
- Close the entire spread if SPY violates $610 support
- This is NOT a set-and-forget trade - monitor daily
- Maximum loss is theoretically unlimited below $610
Probability of Success: ~30% (SPY lands in $610-$650 range by Feb 20)
🚀 Aggressive Play: Directional Put Spread (Not Ratio)
Strategy: Bet on correction WITHOUT the unlimited downside risk
Execution:
- Buy SPY Feb 20 $650 puts (50 contracts)
- Sell SPY Feb 20 $610 puts (50 contracts, same size)
- Net debit: ~$6 per contract = $30,000 cost
- Maximum profit: $40 × 100 × 50 = $200,000 at $610 or below
- Maximum loss: $30,000 (premium paid)
- Risk/Reward: 6.7:1
Why This Works: You're betting on the same bearish thesis (Fed policy error, earnings miss, tariff recession) but with defined risk. Unlike the ratio spread, your maximum loss is capped at the premium paid. Below $610, you make maximum profit regardless of how far SPY falls - no acceleration of losses.
Catalysts to Watch:
- January 27-28 FOMC: If Powell signals zero cuts or hints at hikes, SPY could gap down
- Mega-cap tech earnings (late January): AAPL, MSFT, GOOGL, AMZN, NVDA - any major miss triggers selloff
- Tariff escalation: New announcements targeting Europe or additional China measures
Exit Plan:
- Take 50% profit if SPY hits $630 (spreads worth ~$20, up from $6 cost)
- Take 100% profit if SPY breaks $610 (near maximum value)
- Cut loss at 40% if SPY rallies to $695+ (thesis invalidated)
Who This Is For: Traders who believe in the bearish thesis but want to sleep at night. This is the "smart money" way to play correction - defined risk, asymmetric reward, clear catalysts.
⚠️ Risk Factors
🔴 The Ratio Spread Death Trap
Let's be brutally honest: ratio spreads are designed for sophisticated traders who can manage tail risk. If you replicate this trade and SPY crashes below $530 due to:
- Systematic banking crisis
- Geopolitical shock (war escalation, nuclear event)
- Debt ceiling disaster
- Market structure breakdown (liquidity crisis)
Your losses accelerate EXPONENTIALLY. At $480 (20% crash), you're down $26M on a $26M position. At $450, you're down $240M+. This is why naked short options are considered Level 5 options approval - your broker needs significant margin/collateral.
The Hidden Risk: Gamma risk. As SPY approaches $530, your short 150,000 puts gain delta rapidly. Market makers hedge by selling SPY stock, which pushes price down further, which increases delta more... creating a feedback loop. This is how 1987 and 2010 Flash Crash accelerated.
📉 What Could Go Wrong (Bear Case Invalidation)
Soft Landing Materializes:
- Fed successfully navigates to 2% inflation without recession
- Q4 earnings beat expectations (12-14% growth vs. 8% projected)
- Trade deals with Europe/China ease tariff burdens
- AI capital expenditure cycle ($520B in 2026) drives mega-cap tech higher
- Result: SPY grinds to $720-$750, ratio spread loses entire $26M premium
Valuation Support Holds:
- Forward P/E of 22.5 is elevated but justified if earnings growth hits 12-14%
- Wall Street targets of 7,100-8,100 (7% to 18% upside) attract buying dips
- Institutional rebalancing creates year-end/January buying support
- Hedge funds reduce short positions, triggering short squeeze
Data Quality Improves:
- Government shutdown data gaps resolved in December/January releases
- Cleaner data gives Fed confidence to cut in March/June
- Markets rally on dovish pivot
🔥 Volatility Crush Risk
Even if SPY drops to $650 (5% correction), the implied volatility collapse after FOMC and earnings could destroy put values. This is the "sell the news" phenomenon:
- Current IV for February options elevated due to event risk
- After events pass (even if negative), IV compresses
- Your $650 puts could lose 30-50% of value from IV crush alone
- This is why timing matters - you want to BUY puts before volatility spikes, not after
⏰ Time Decay (Theta) Enemy
With 63 days to expiration, these puts are losing ~$0.15-0.25 per day in time value per contract. For the 75,000 long puts:
- Daily theta decay: ~$0.20 × 100 × 75,000 = $1.5M per day
- Over 30 days: $45M in time decay
- This means SPY needs to move DOWN significantly just to breakeven on theta
The short 150,000 puts collect theta, but at 2:1 ratio, the net theta is still negative for the overall position.
🎯 The Bottom Line
Real talk: This $26M ratio put spread is institutional-grade portfolio insurance with a calculated bet that SPY corrects 10-15% by mid-February. The trader is explicitly saying: "I'm worried about the January 27-28 FOMC meeting, Q4 earnings misses, and tariff-induced recession, BUT I don't think we're heading for a 2008-style crash."
If you're thinking about playing this:
✅ You Should Consider Puts If:
- You believe the Fed's hawkish pivot (only 1 cut in 2026) will crater valuations
- You think 8.1% earnings growth is unachievable with 20%+ tariffs
- You're sitting on large equity gains (+17% YTD) and want insurance
- You can afford to lose 100% of premium if wrong
- You have experience managing options gamma/theta risk
❌ You Should Avoid This Trade If:
- You don't understand ratio spread mechanics (2:1 short exposure = unlimited loss)
- You can't monitor positions daily during FOMC/earnings
- You're hoping for quick gains (theta decay is $1.5M/day on this trade)
- You believe in the soft landing narrative (40% probability)
- You lack the capital/margin for potential catastrophic losses below $530
Mark Your Calendar:
- January 9: December jobs report - watch unemployment rate (currently 4.6%)
- January 14-15: CPI releases - if inflation reaccelerates, Fed forced to hold/hike
- January 21-31: Mega-cap tech earnings (AAPL, MSFT, GOOGL, AMZN, NVDA, META, TSLA)
- January 27-28: FOMC meeting - the nuclear catalyst
- February 1-20: Earnings season in full swing, position theta decay accelerates
The Smart Play: If you like the bearish thesis but don't want ratio spread risk, use the Aggressive Play structure from above (1:1 put debit spread with defined $30K risk and $200K potential reward). You capture the same directional bet WITHOUT the unlimited downside if markets crash.
Final Thought: Someone just committed $26M to this position with Z-scores of 48.94 and 358.75 (meaning 358 times normal volume on the $530 strike). This isn't noise - this is institutional fear manifesting in options flow. Whether it's warranted depends on how the next 63 days unfold, but when smart money hedges this aggressively, retail should pay attention.
📊 Position Greeks Summary
Overall Position Metrics (Estimated):
- Delta: Approximately -0.30 to -0.40 (bearish directional bias)
- Gamma: Negative above $530 (short gamma exposure from 2:1 ratio)
- Theta: Negative ~-$1.5M/day (time decay working against position)
- Vega: Positive (benefits from volatility increase)
- Risk: Unlimited below $530 (2:1 short put exposure)
What This Means:
- Every $1 move down in SPY generates ~$0.35 profit (until gamma effects dominate)
- Volatility spikes from FOMC/earnings help the position
- Time is the enemy - position loses $45M over next 30 days from theta
- Below $530, gamma risk explodes (short puts gain delta rapidly)
🔗 Additional Resources
SPY Stock Analysis: View SPY fundamentals and technical analysis
Option Charts:
Key Economic Calendars:
⚠️ DISCLAIMER: Options trading involves substantial risk and is not suitable for all investors. Ratio spreads involve selling more options than purchased, creating unlimited loss potential. This analysis is for educational purposes only and not investment advice. The unusual activity described represents sophisticated institutional positioning that may not be appropriate for retail traders. Past performance does not guarantee future results. Always consult with a qualified financial advisor before making investment decisions.
Analysis by Ainvest Option Flow Intelligence | Data as of December 19, 2025 Z-Score Methodology: Measures current volume vs. 30-day average volume to identify statistically unusual activity