📊 SPY Bears Spread Big Into Year-End - $28.7M Position on Santa Rally Fade!
📅 December 22, 2025 | 🔥 Unusual Activity Detected
🎯 The Quick Take
A sophisticated trader just laid out $28.7 million in a bearish call spread on SPY, betting the traditional Santa Claus Rally might fizzle out by January 2nd. This isn't your typical year-end positioning - someone with serious capital is hedging against further upside or outright betting on a pullback despite the S&P 500 sitting near all-time highs. With the Fed's hawkish pivot still fresh in traders' minds, this defensive posture makes sense.
💰 The Option Flow Breakdown
📊 What Just Happened
Here's the actual trade that crossed the tape at 11:37:56 AM ET:
| Time | Type | Strike | Expiry | Volume | Premium | Details |
|---|---|---|---|---|---|---|
| 11:37:56 | 🔴 SELL CALL | $678 | Jan 2, 2026 | 22,000 | $21.0M | Sold @ $9.84 |
| 11:37:56 | 🟢 BUY CALL | $687 | Jan 2, 2026 | 27,000 | $7.7M | Bought @ $3.59 |
Total Position Size: $28.7 million in premium
🤓 What This Actually Means
Translation for regular folks: This is a bear call spread - a defined-risk bearish strategy where you sell a lower strike call and buy a higher strike call to cap your risk. The trader:
- ✅ Collected $21M by selling 22,000 contracts of the $678 calls
- ✅ Paid $7.7M to buy 27,000 contracts of the $687 calls (protection)
- ✅ Net credit received: approximately $13.3M
- ✅ Maximum risk: Capped at the $9 strike width minus net credit
Why this matters: With SPY at $684.55 when this trade went on, the short $678 strike is already in-the-money by $6.55. This is aggressive positioning that suggests the trader believes SPY won't rally much further - or might even pull back - by January 2nd expiration (just 11 days away).
The volume here is massive - 22,000 contracts on the short side represents $1.5 billion in notional exposure (22,000 x 100 shares x $678). This is institutional money making a calculated bet, not retail YOLO trades.
📈 Technical Setup
YTD Chart Analysis
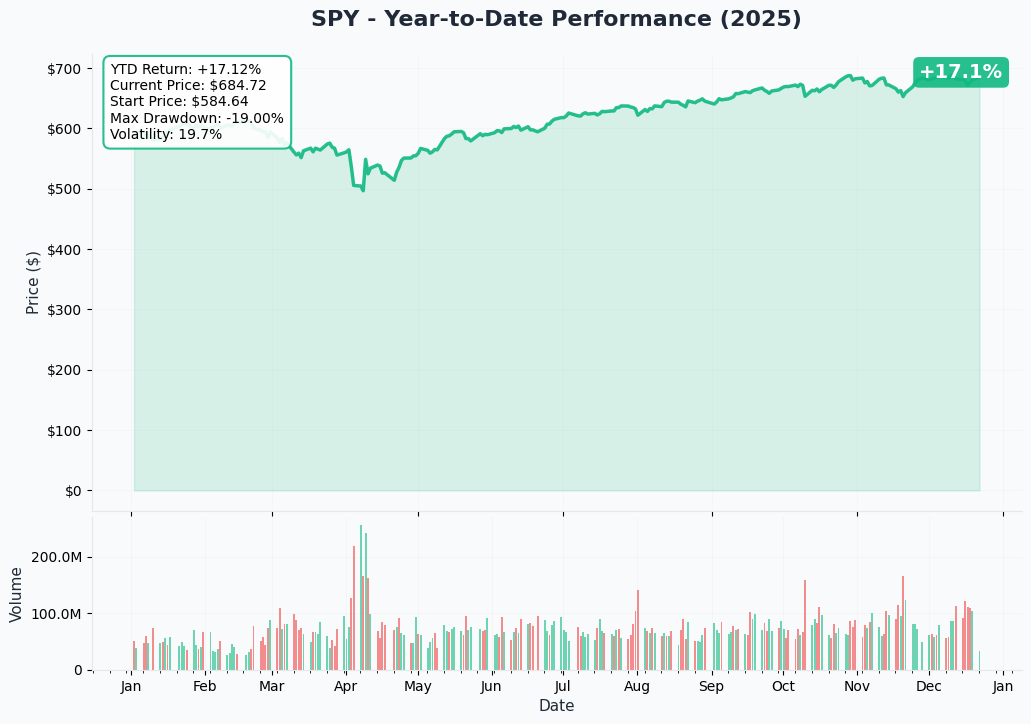
SPY has delivered a solid 16.33% year-to-date return through December 19th, climbing from around $580 at the start of 2025 to the current $684 level1. The ETF hit its all-time high of $689.17 on December 11th2, just days before the Fed's hawkish rate decision that signaled only one more cut in 2026 instead of the multiple cuts markets had priced in3.
The recent price action shows SPY consolidating in the $680-685 range after that December 11th peak. This sideways chop suggests the market is digesting the Fed's message - bulls and bears are in a standoff. The fact that a big trader is selling call spreads right here tells you they don't expect a breakout to new highs before year-end.
Gamma-Based Support & Resistance Analysis
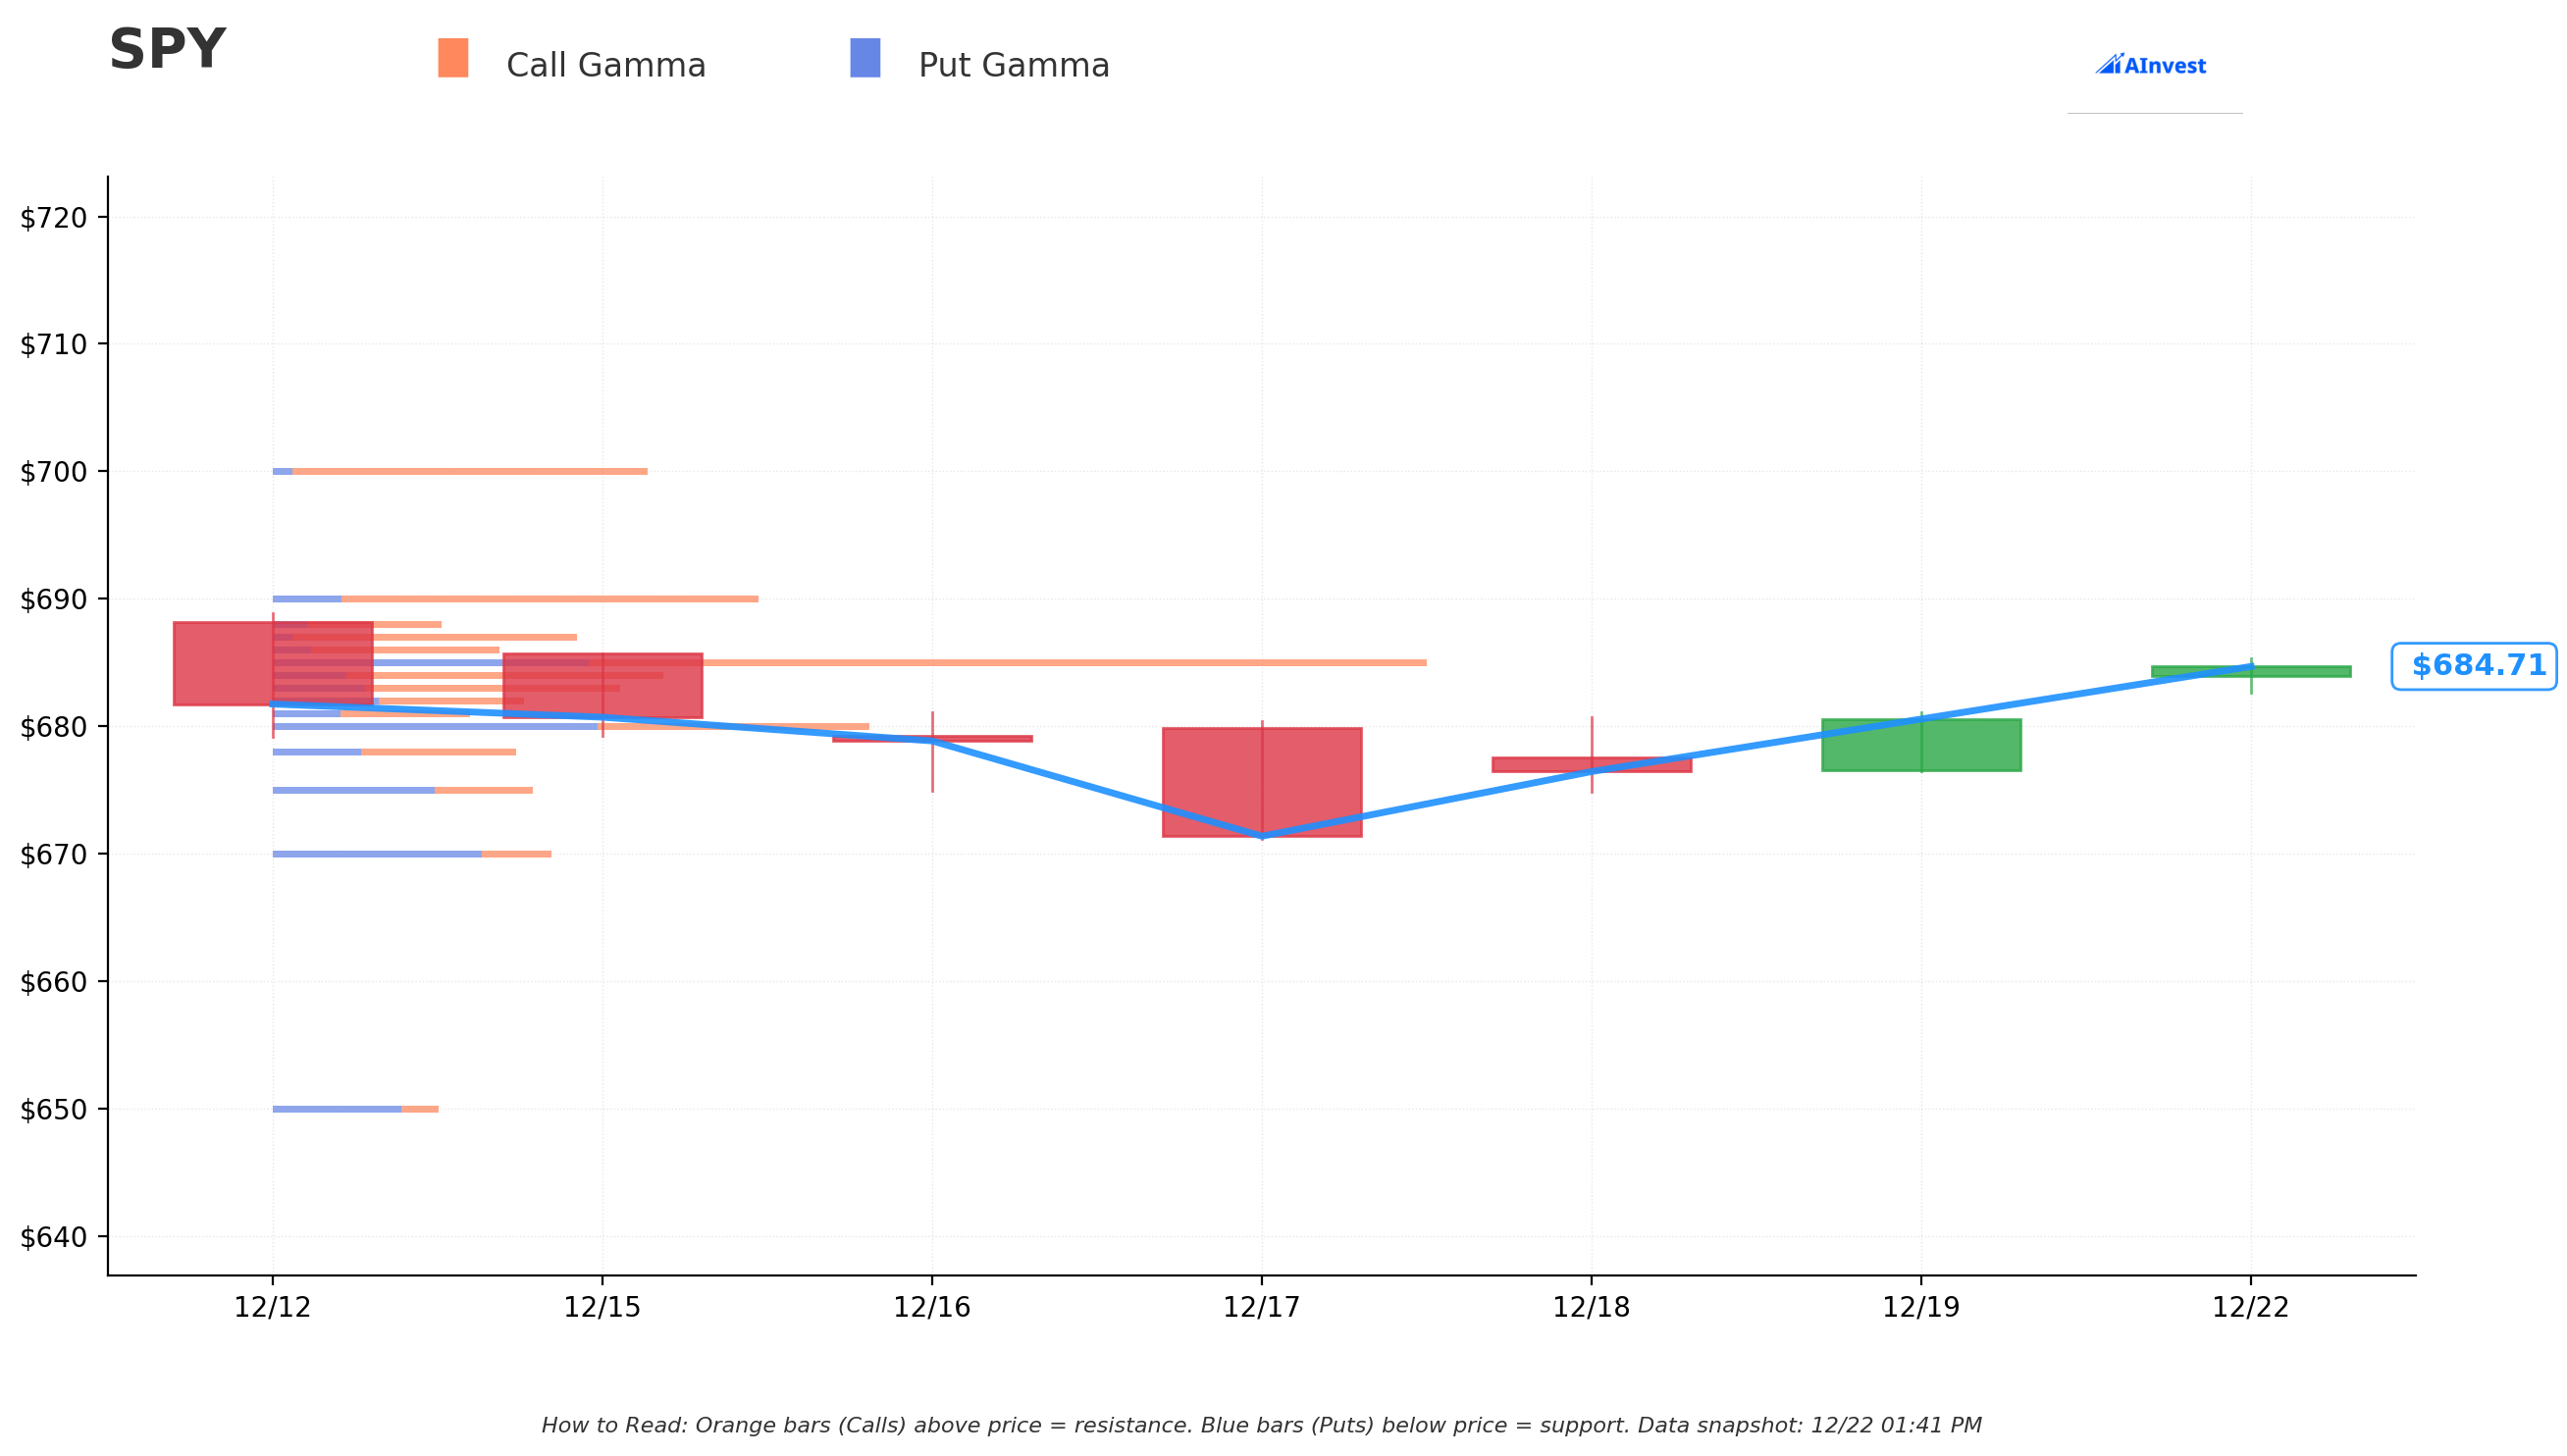
The gamma exposure map reveals some critical insights about how options positioning will affect SPY's price action:
Key Resistance Levels (Call Gamma Walls):
- 🟠 $685 Strike - THE MONSTER WALL: This is the strongest resistance level with $882M in total gamma exposure and a massive net positive gamma of $409M. The dealer hedging at this level will create serious selling pressure as SPY approaches $685. Currently just 0.02% away from this strike.
- 🟠 $690 Strike: Another significant barrier with $365M in total gamma. Market makers will be hedging aggressively here.
- 🟠 $700 Strike: The psychological round number carries $279M in gamma, marking the bull case ceiling.
Key Support Levels (Put Gamma Floors):
- 🔵 $684 Strike: Modest support with $268M total gamma, right near current price
- 🔵 $680 Strike: The first real support zone with $418M in total gamma and net negative gamma of -$45M. This creates a put gamma "cushion" where dealers will buy dips.
- 🔵 $675 Strike: Secondary support at $187M total gamma
Net Gamma Bias: BULLISH - Total call gamma of $3.88 billion vs. put gamma of $2.38 billion means dealer hedging overall favors upside, BUT that massive wall at $685 is going to be tough to crack in the next 11 days.
The bear call spread trader clearly sees this gamma setup: they're short the $678 strike (below current price, below the $680 support) and long the $687 strike (above the $685 resistance wall). Smart positioning if you think SPY gets stuck in this range or drifts lower.
Implied Move Analysis
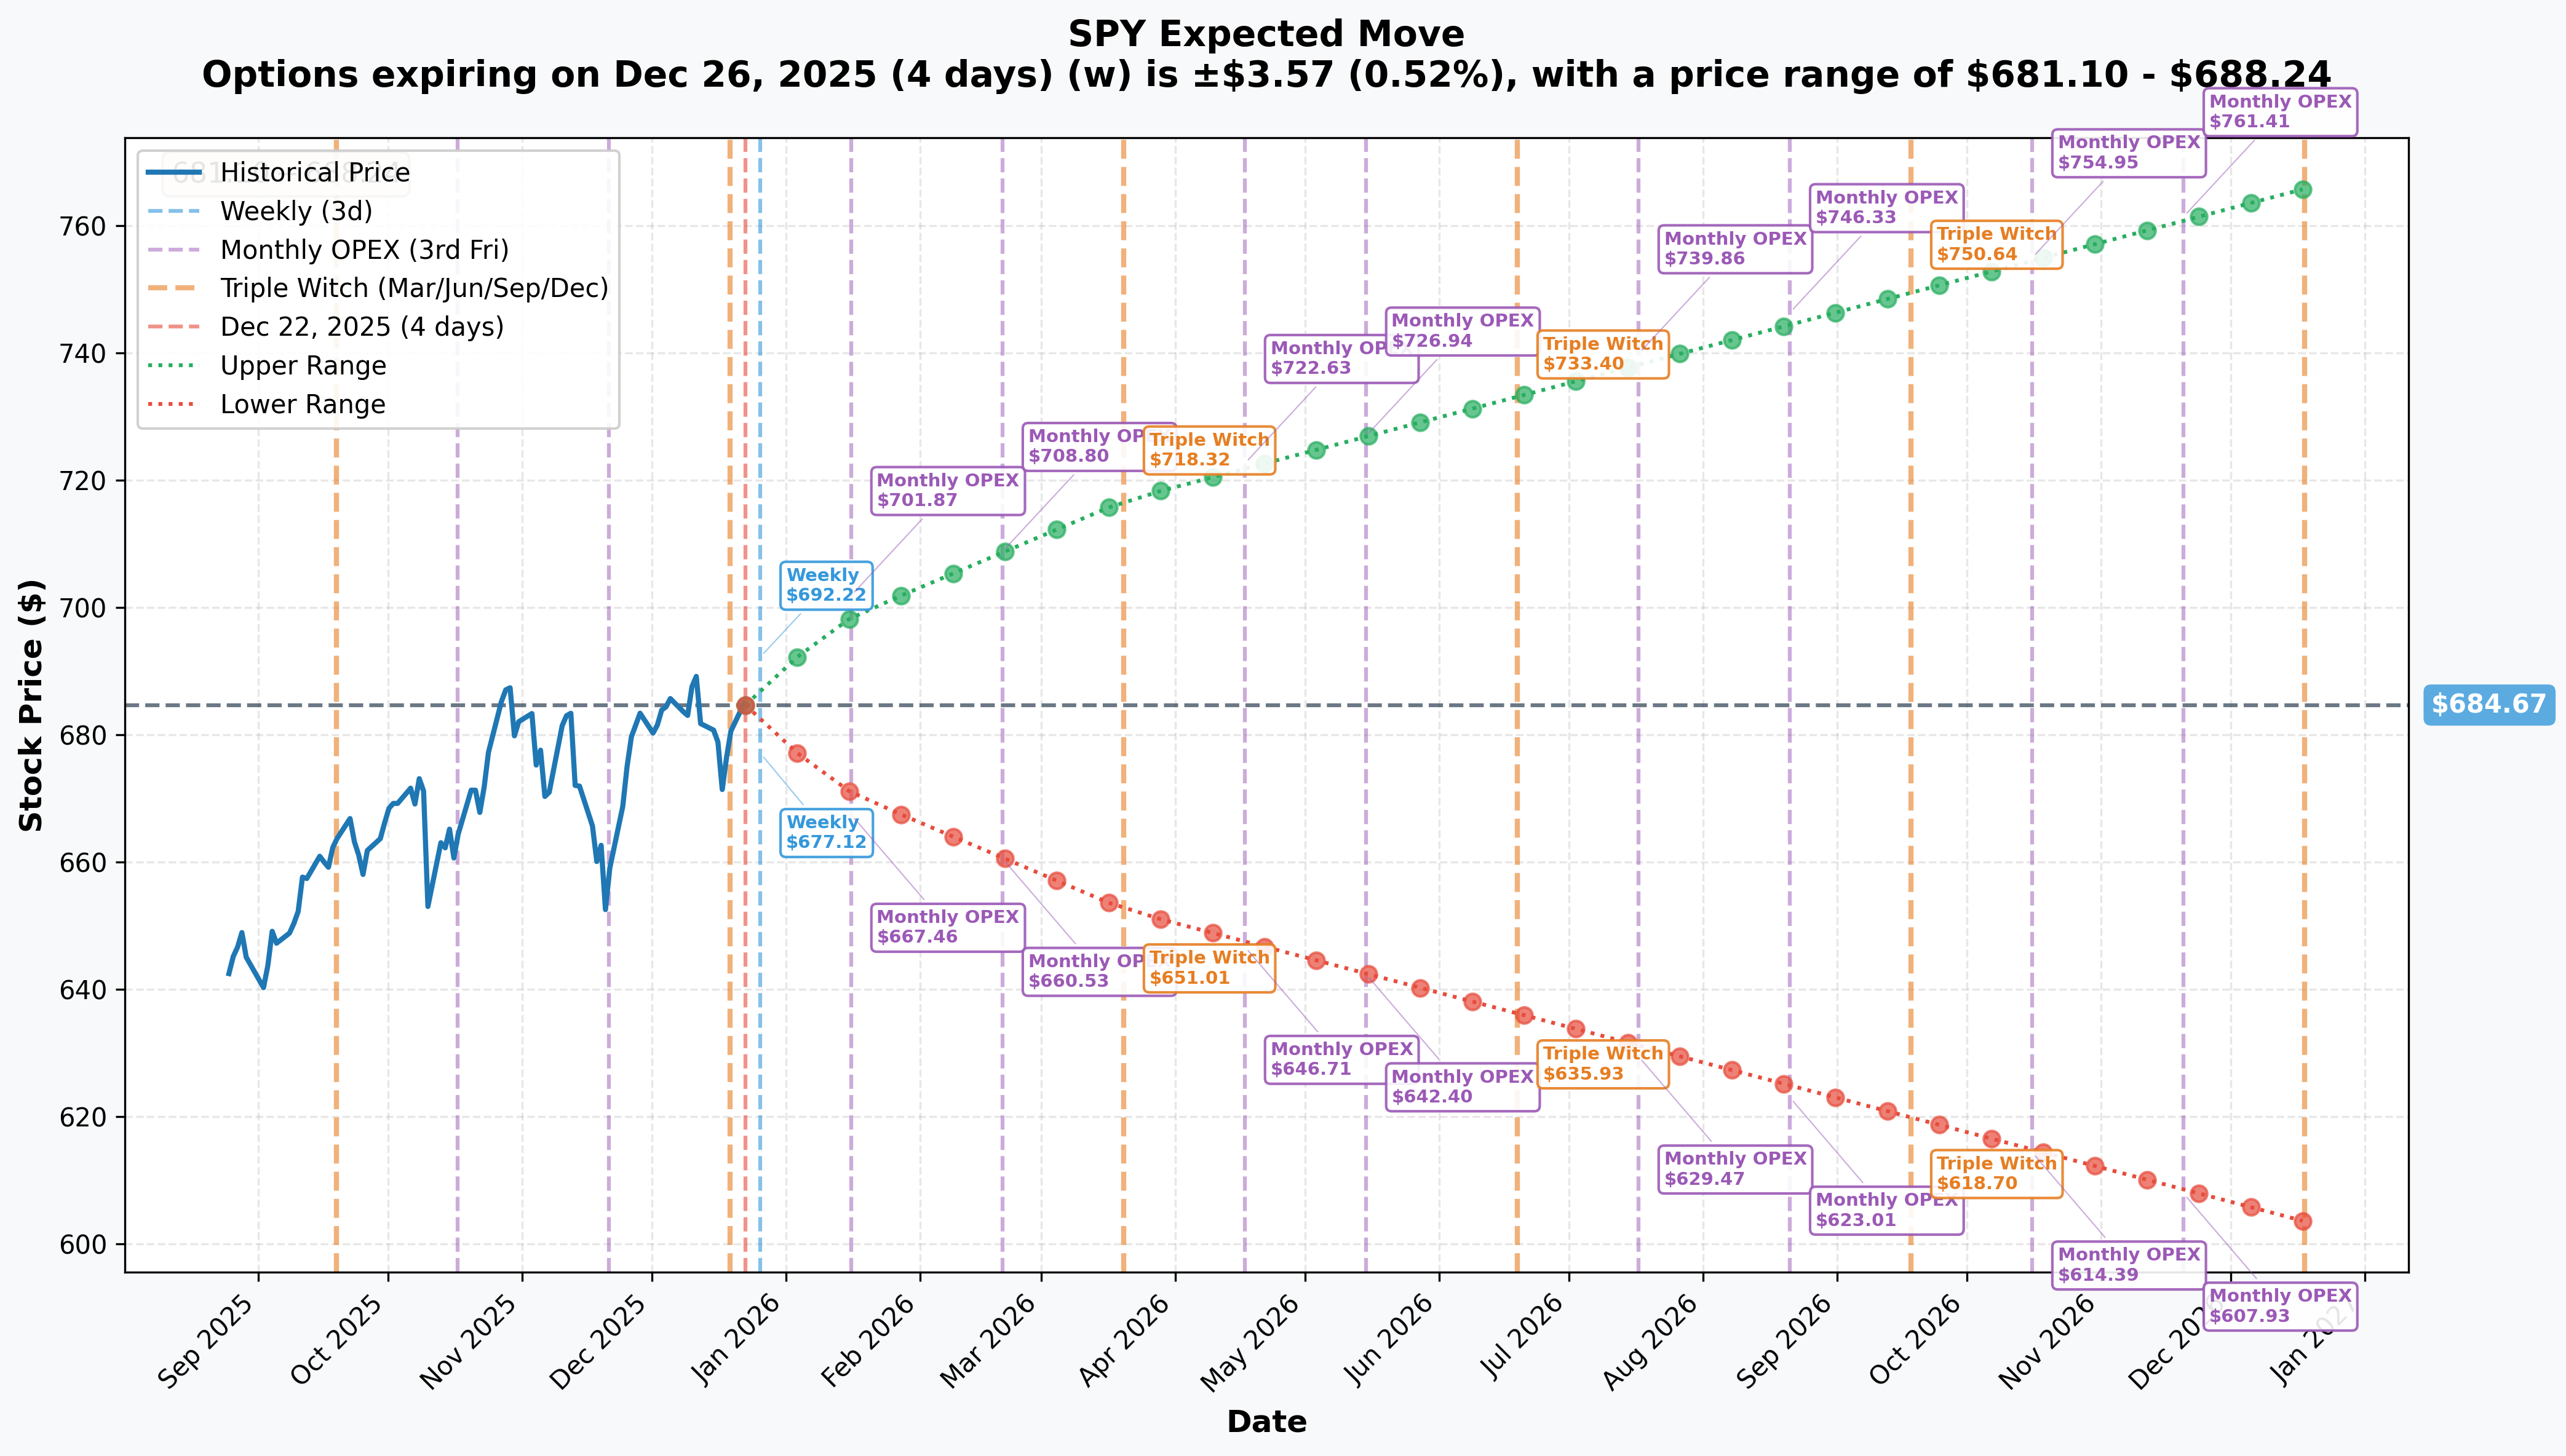
The options market is pricing in the following moves:
Weekly (Exp: Dec 26, 2025 - 4 days out):
- Implied Move: ±0.52% or ±$3.57
- Range: $681.10 - $688.24
- This is a tight range, suggesting low volatility expectations for the holiday-shortened week
Monthly OPEX (Exp: Jan 16, 2026 - 25 days out):
- Implied Move: ±2.05% or ±$14.03
- Range: $670.64 - $698.70
- This captures our January 2nd options expiration plus the next few weeks
Key Insight: The implied move for the weekly expiration includes the Santa Claus Rally period (last 5 trading days of December + first 2 of January). Historically, SPY rises 1.3% on average during this window4, but the options market is only pricing ±0.52% - suggesting skepticism about the traditional year-end melt-up.
The bear call spread maxes out at $687, which is right at the upper end of the weekly expected range ($688.24). If the trader's thesis plays out and SPY stays range-bound or pulls back, they keep the full $13.3M credit. If SPY rockets higher (unlikely given the gamma wall and Fed headwinds), their loss is capped.
🎪 Catalysts
Past Events (Already Happened)
✅ December 10, 2025 - Fed Rate Cut & Hawkish Pivot The Federal Reserve delivered a 25 basis point rate cut to 3.50%-3.75% but shocked markets by signaling only one more cut in 2026 versus expectations for more aggressive easing3. The contentious 9-3 vote included dissents from both hawks wanting to hold steady and a dove wanting a 50bp cut5. This hawkish surprise removed a key bullish catalyst for equities.
✅ Q4 2024 Earnings Season - Strong But Priced In With 77% of S&P 500 companies reporting, earnings growth hit 16.9% year-over-year - the strongest since Q4 20216. Nine of eleven sectors showed positive growth, with Financials, Tech, and Healthcare leading7. However, SPY's peak on December 11th came right after these results, suggesting the good news is fully reflected in prices.
✅ November 2025 Inflation Data CPI came in at 2.7% year-over-year in November, slightly better than expected but still "stubbornly stuck at one percent higher than the 2% target rate"8. This persistent inflation is why the Fed stayed hawkish despite cutting rates.
✅ December "Great Rotation" The month saw significant sector rotation as investors experienced "AI fatigue" and rotated out of high-valuation Technology stocks into Financials, Utilities, and Industrials9. Information Technology fell 4.36% in November, its worst month since March's -8.87% drop10. This rotation reflects changing market leadership rather than broad market strength.
✅ SPY Outflows Continue SPY has seen $30.2 billion in outflows in 2025, nearly matching the second-largest annual outflow on record11. While recent tactical buying brought $446M in five-day net inflows through December 15th12, the broader trend shows investors moving to competitors like VOO (which overtook SPY as the world's largest ETF with $732B in AUM)13.
Upcoming Events (Watch These)
📅 December 23-26, 2025 - Santa Claus Rally Window The traditional Santa Claus Rally covers the last 5 trading days of December plus first 2 of January. Historically, SPY rises about 1.3% on average during this seven-day window with a 76%-80% win rate4. However, 2025's unique setup - hawkish Fed, elevated valuations, and sector rotation - may disrupt this seasonal pattern.
📅 January 27-28, 2026 - FOMC Meeting The next Fed meeting will be critical to confirm whether the "one more cut in 2026" guidance sticks or evolves. Market odds currently show 75.6% probability of no change to the 3.5%-3.75% range14. If the Fed sounds more dovish, it could reignite the rally; if they lean even more hawkish, expect downside pressure.
📅 January 2026 - Q1 Earnings Season Kicks Off Analysts project 13.1% earnings growth for Q1 2026 with 8.2% revenue growth15. For full-year 2026, expectations are for 15% earnings growth - the third consecutive year of double-digit growth16. However, 39% of companies issuing guidance have given negative outlooks versus 61% positive17, suggesting management teams see headwinds ahead.
📅 Ongoing - Geopolitical & Trade Tensions Tariffs have been "a dominant driver of financial volatility in 2025"18, with President Trump's trade policies triggering sharp Treasury sell-offs. KPMG worst-case scenarios model US GDP falling by as much as 1.5% from escalating trade wars19. Any new tariff announcements or China tensions could spark volatility.
🎲 Price Targets & Probabilities
Based on gamma levels, implied moves, and fundamental catalysts, here are the realistic scenarios for SPY through January 2nd expiration:
🐻 Bear Case: $675-680 (-0.7% to -1.4%)
Probability: 30%
What needs to happen:
- Santa Claus Rally fails to materialize (unusual but possible given Fed headwinds)
- Profit-taking accelerates as funds lock in 2025's 16%+ gains
- Negative news flow (geopolitical flare-up, weak economic data, or hawkish Fed speak)
- VIX spikes from current 14.91 level to 18-20 range
Technical Support:
- $680 strike has $418M in total gamma providing put support
- $675 strike is secondary floor with $187M gamma
- These levels align with the monthly implied move lower band ($670.64)
Why the bear call spread wins here: If SPY drops to $675-680, both the $678 short calls and $687 long calls expire worthless. The trader keeps the full $13.3M net credit. Maximum profit scenario.
🦘 Base Case: $680-685 (-0.7% to flat)
Probability: 50%
What needs to happen:
- Market trades sideways in year-end consolidation
- Santa Claus Rally delivers modest 0.5%-1% gains but not enough to break resistance
- Low volume holiday trading keeps price range-bound
- No major catalyst to drive breakout either direction
Technical Factors:
- Massive $685 gamma wall with $882M exposure acts as ceiling
- $684 and $680 strikes provide support cushion below
- Weekly implied move of ±$3.57 centers around current $684.89 price
Bear Call Spread Performance: If SPY stays in the $680-685 range at January 2nd expiration:
- The $678 short calls finish in-the-money and get assigned
- The $687 long calls expire worthless
- Net result: Small loss but far less than the maximum
This is the most likely outcome based on gamma positioning and post-Fed consolidation pattern.
🚀 Bull Case: $690-700 (+0.7% to +2.2%)
Probability: 20%
What needs to happen:
- Unexpected dovish Fed commentary sparks risk-on rally
- Santa Claus Rally delivers above-average 2%+ gains
- Major breakthrough on trade negotiations removes tariff overhang
- Tech sector rebounds as AI fears subside
Technical Resistance:
- Must break through $685 gamma wall ($882M exposure)
- $690 strike presents next resistance ($365M gamma)
- $700 psychological level is bull case ceiling ($279M gamma)
Bear Call Spread Impact: This is the worst-case scenario for the trader. If SPY rallies to $690-700:
- Both legs finish in-the-money
- Maximum loss = ($9 strike width - $6.05 net credit) × 22,000 contracts
- Still, loss is capped and defined - no unlimited risk
Why this is unlikely: The combination of hawkish Fed, elevated valuations at 22.2x forward P/E (vs. 10-year average of 18.3x)20, ongoing SPY outflows, and the massive gamma resistance at $685 make a strong rally low probability in just 11 days.
💡 Trading Ideas
🛡️ Conservative: Cash Gang & Sell Premium
The "Year-End Theta Collector"
If you believe SPY stays range-bound like the base case suggests, don't fight it - profit from it:
Strategy: Sell a $682/$679 put credit spread expiring January 2nd
- Sell the $682 put (collect premium)
- Buy the $679 put (define max risk at $3 width)
- Target credit: ~$0.80-1.00 per spread
- Max profit: $80-100 per spread (if SPY stays above $682)
- Max risk: $200-220 per spread (if SPY crashes below $679)
Risk/Reward: Approximately 1:2.5 with 70%+ probability of profit
Why this works: You're selling put premium in the support zone where gamma will provide a cushion. As long as SPY doesn't collapse below $679 (which would require a -0.8% move), you win. With only 11 days to expiration, theta decay works in your favor.
Position sizing: Risk no more than 1-2% of portfolio on this trade. If you have a $50,000 account, trade 2-3 spreads max ($400-600 risk).
⚖️ Balanced: Play the Gamma Walls
The "Range Rider"
For those comfortable with more active management, exploit the known gamma levels:
Strategy: Iron Condor using the gamma map
- Sell $690 call / Buy $692 call (upper wing)
- Sell $678 put / Buy $676 put (lower wing)
- Expiration: January 2nd
- Target credit: $1.20-1.50 per iron condor
Profit Zone: SPY between $678-690 at expiration (96% range from current price)
Why this works: You're selling premium at the identified resistance ($690) and support ($678) levels where gamma positioning suggests price will struggle to break through. The 11-day timeframe limits your risk, and you profit from the sideways grind.
Management: If SPY touches $688 or $680, consider closing the threatened side for a small loss and letting the other side ride. Don't be a hero holding through breakouts.
Max profit: $120-150 per IC if SPY stays in the wide range Max risk: $80-50 per IC at the edges
🚀 Aggressive: Copy the Whale (With Less Size)
The "Scaled-Down Bear Spread"
Want to follow the smart money's bearish lean but with appropriate sizing?
Strategy: Replicate the $678/$687 bear call spread at retail scale
- Sell 1 contract of the $678 call (January 2nd)
- Buy 1 contract of the $687 call (January 2nd)
- Net credit: ~$600 (based on current pricing)
How this plays out:
- If SPY stays below $678: Keep full $600 credit (unlikely, price is at $684)
- If SPY between $678-687: Profit decreases dollar-for-dollar above $678
- If SPY above $687: Maximum loss of $300 ($9 width minus $6 credit)
Why do this? You're betting the same thesis as the institutional trader: SPY won't rally through $687 in the next 11 days. Your defined max risk is $300 per spread, so you can sleep at night even if you're wrong.
Sizing: Only allocate 2-3% of portfolio to this directional bet. If you have $25,000, trade 1-2 spreads max ($300-600 max risk).
YOLO Version (Not Recommended): Sell the $678 calls naked if you have portfolio margin and hate money. But seriously, don't do this unless you have $150K+ in capital and understand the unlimited risk of naked short calls.
⚠️ Risk Factors
The Santa Rally Could Surprise
Historically, this period has a 76%-80% win rate with average gains of 1.3%4. Despite the hawkish Fed and elevated valuations, seasonality is real. If institutional buying programs kick in for year-end window dressing, SPY could gap through the $685-687 resistance faster than expected. That massive gamma wall at $685 flips from resistance to support once broken.
Year-End Liquidity Evaporates
We're heading into the lightest trading volume week of the year. With many traders on vacation, prices can make outsized moves on thin volume. A few large orders could push SPY $5+ in either direction without much liquidity to absorb the flow. The VIX at 14.91 suggests complacency21 - this could spike quickly if anything unexpected happens.
The Fed Could Walk Back Hawkishness
If economic data weakens in the next two weeks (unlikely but possible), Fed officials might soften their "only one more cut" stance in media appearances. Any hint of renewed dovishness would spark an immediate rally, crushing bearish positions. Watch for Fed speakers between now and January 2nd.
Geopolitical Wild Cards
Tariff announcements, China tensions, or Middle East developments could spark volatility from nowhere. KPMG analysis shows tariffs have been "a dominant driver of financial volatility in 2025"18. President Trump could tweet a new tariff policy on Christmas Day (he's done weirder things), and SPY could gap down 2% on the next trading session.
Warren Buffett Knows Something
Berkshire Hathaway has been a net seller for 12 consecutive quarters through Q3 2025, with cash hitting $381.7 billion22. When the Oracle of Omaha is this cautious while markets sit near all-time highs, it's worth paying attention. He doesn't sell because he's bored - he sells because he sees limited upside and prefers dry powder.
Elevated Valuations Leave No Margin for Error
SPY's forward P/E of 22.2x is 12% above the 5-year average and 22% above the 10-year average20. Bank of America's 7,100 target for 2026 (most cautious on Wall Street) explicitly models multiple compression despite healthy earnings23. If any catalyst triggers a de-rating, the downside could be swift and painful.
Employment Slowdown Threatens Consumer Spending
Employment growth is "headed toward zero" with unemployment rising half a percentage point in 20252425. The U.S. consumer drives 70% of GDP - if spending slows materially in Q1 2026, those rosy 15% earnings growth expectations will get slashed fast.
🎯 The Bottom Line
Here's the deal: A sophisticated institutional trader just put $28.7 million to work betting SPY doesn't rally past $687 by January 2nd. They're not betting on a crash - they're betting on a grind or modest pullback. The technical setup supports this thesis: a massive gamma wall at $685, hawkish Fed removing a key bullish catalyst, elevated valuations leaving no room for multiple expansion, and seasonal Santa Rally skepticism baked into low implied volatility.
For traders already long SPY or tech: Consider taking some profits after a 16%+ year. You don't have to sell everything, but trimming 10-20% into year-end and redeploying in January at better levels makes sense. The risk/reward is not attractive at 22.2x forward earnings with the Fed hitting the brakes.
For active options traders: The range-bound environment favors premium sellers. Iron condors, put credit spreads in the support zone, and theta-positive strategies should outperform directional bets. Avoid buying expensive calls chasing the Santa Rally - you're fighting gamma, the Fed, and valuation gravity.
For those watching from the sidelines: Patience pays. If you missed 2025's rally, don't FOMO in at the highs. Wait for the January FOMC meeting on the 27th-28th and Q1 earnings guidance to get clarity on 2026's trajectory. Cash is earning 4%+ in money markets - you're not missing out by sitting tight.
Mark your calendar:
- ✅ December 26th - End of Santa Rally window
- ✅ January 2nd - This bear call spread expires (watch SPY's close)
- ✅ January 27-28 - FOMC meeting (next major catalyst)
The smart money is playing defense. In a market this extended with this many crosscurrents, sometimes the best trade is the one you don't make. But if you do trade, keep it small, keep it defined-risk, and don't fight the gamma walls.
Stay sharp out there. 📊
📚 References
Disclaimer: This analysis is for educational and informational purposes only. Options trading involves substantial risk and is not suitable for all investors. Past performance does not guarantee future results. Always conduct your own research and consult with a licensed financial advisor before making investment decisions.