💼 Massive $13.6M SPY Put Spread Unwind: Year-End Positioning Signals 2026 Caution
🎯 Quick Take
A sophisticated institutional player just unwound a massive $13.6 million put spread position in 0DTE SPY options, closing 27,200 contracts split across four simultaneous trades. With SPY trading at $686.72—below both strikes of the 689/688 put spread—the trader chose to close the position 24 hours before expiration rather than risk assignment and pin risk. This defensive move comes as the S&P 500 consolidates near all-time highs following a 17-19% YTD gain, while facing extreme valuations and a challenging 2026 setup marked by the January 27-28 FOMC meeting, tariff uncertainties, and the January 1 tariff implementation. Someone's betting that clean books matter more than overnight hope.
📊 Option Flow Breakdown
The Trade:
The Tape (December 29, 2025):
| Time | Symbol | Side | Buy/Sell | Type | Expiration | Premium | Strike | Volume | OI | Size | Spot | Option Price |
|---|---|---|---|---|---|---|---|---|---|---|---|---|
| 11:41:43 | SPY | BID | SELL | PUT $689 | 2025-12-30 | $4.9M | $689 | 35,000 | 34,000 | 17,400 | $686.72 | $2.83 |
| 11:41:43 | SPY | ASK | BUY | PUT $688 | 2025-12-30 | $3.8M | $688 | 56,000 | 33,000 | 17,400 | $686.72 | $2.19 |
| 11:41:43 | SPY | BID | SELL | PUT $689 | 2025-12-30 | $2.8M | $689 | 17,000 | 34,000 | 9,800 | $686.72 | $2.83 |
| 11:41:43 | SPY | ASK | BUY | PUT $688 | 2025-12-30 | $2.1M | $688 | 38,000 | 33,000 | 9,800 | $686.72 | $2.19 |
Trade Details:
| Field | Value |
|---|---|
| Date/Time | December 29, 2025 at 11:41:43 AM ET |
| Strategy | Closing 689/688 Put Spread (4 legs) |
| Leg 1 | SELL 17,400 × $689 PUT @ $2.83 = $4.9M |
| Leg 2 | BUY 17,400 × $688 PUT @ $2.19 = $3.8M |
| Leg 3 | SELL 9,800 × $689 PUT @ $2.83 = $2.8M |
| Leg 4 | BUY 9,800 × $688 PUT @ $2.19 = $2.1M |
| Expiration | December 30, 2025 (0DTE/1DTE) |
| Total Contracts | 27,200 (split: 17,400 + 9,800) |
| Total Premium | $13,600,000 |
| Current Spot | $686.72 |
| Net Credit on Close | $0.64 per spread × 27,200 = $1.74M |
| Notional Value | ~$187M in SPY exposure |
What This Means: This is a closing transaction of a bull put spread that was likely established when SPY traded above $689. The simultaneous execution of four legs at identical timestamps across two different lot sizes (17,400 and 9,800) indicates sophisticated institutional order routing designed to minimize market impact. With SPY at $686.72, both strikes are in-the-money, creating maximum gamma exposure and pin risk heading into December 30 expiration.
Why Close Instead of Hold to Expiration?
- Capture Remaining Value: Locked in $0.64 credit vs. potential $1.00 max loss at expiration
- Avoid Pin Risk: At $686.72 spot between $688/$689 strikes, assignment uncertainty is maximum
- Year-End Book Management: Institutional portfolios prefer clean year-end books without gamma exposure into new calendar year
- Risk Reduction: Eliminated approximately $2M in potential adverse swing from overnight movement
Volume Analysis: The 689 put traded 52K contracts against 34K open interest (1.5x ratio), while the 688 put traded 94K against 33K OI (2.8x ratio). This volume-to-OI ratio suggests significant position closing activity, not new speculation.
📈 Technical Setup
Key Technical Levels:
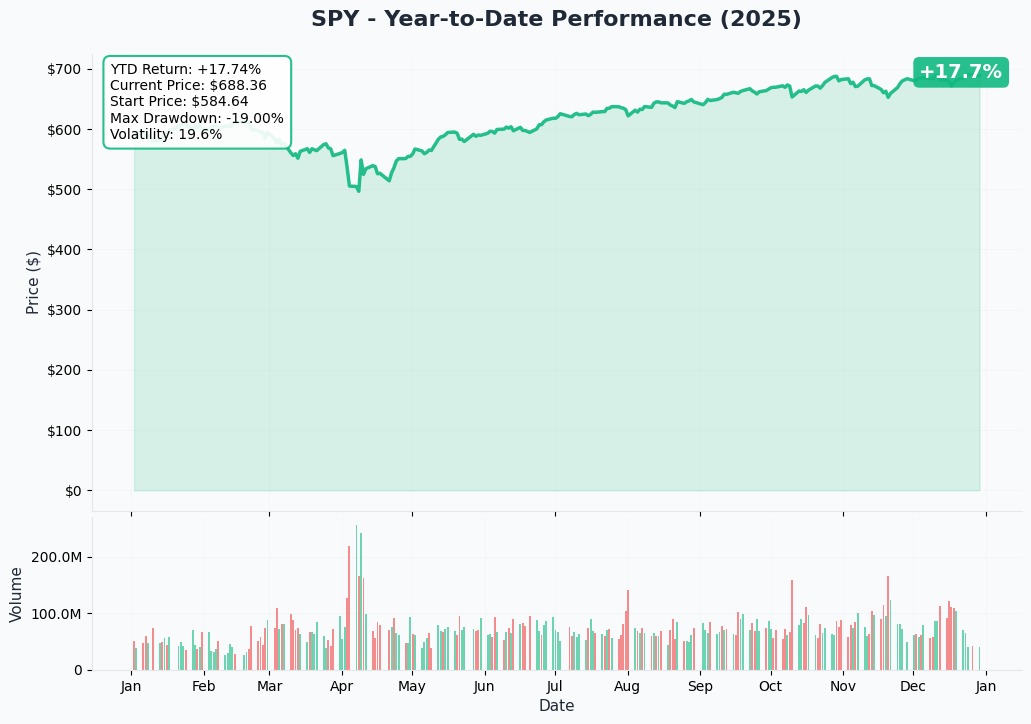
- 52-Week High: $691.66 (December 24, 2025) per Yahoo Finance
- Current Price: $686.72
- 52-Week Low: $481.80 (April 7, 2025 - tariff shock) per FinancialContent
- YTD Performance: +17% to +19% according to 24/7 Wall St.
- VIX: 13.60 (within 52-week range of 13.38 - 60.13) per Yahoo Finance
Recent Price Action: The S&P 500 reached its third consecutive year of 17-19% gains, achieving record highs above 6,900 in late December according to Seeking Alpha. However, the index has since retreated from the December 24 peak of $691.66, stalling the traditional Santa Claus Rally period. This consolidation near all-time highs occurs amid extreme valuations, with the forward P/E of 22.4 approximately 40% above historical averages per Current Market Valuation.
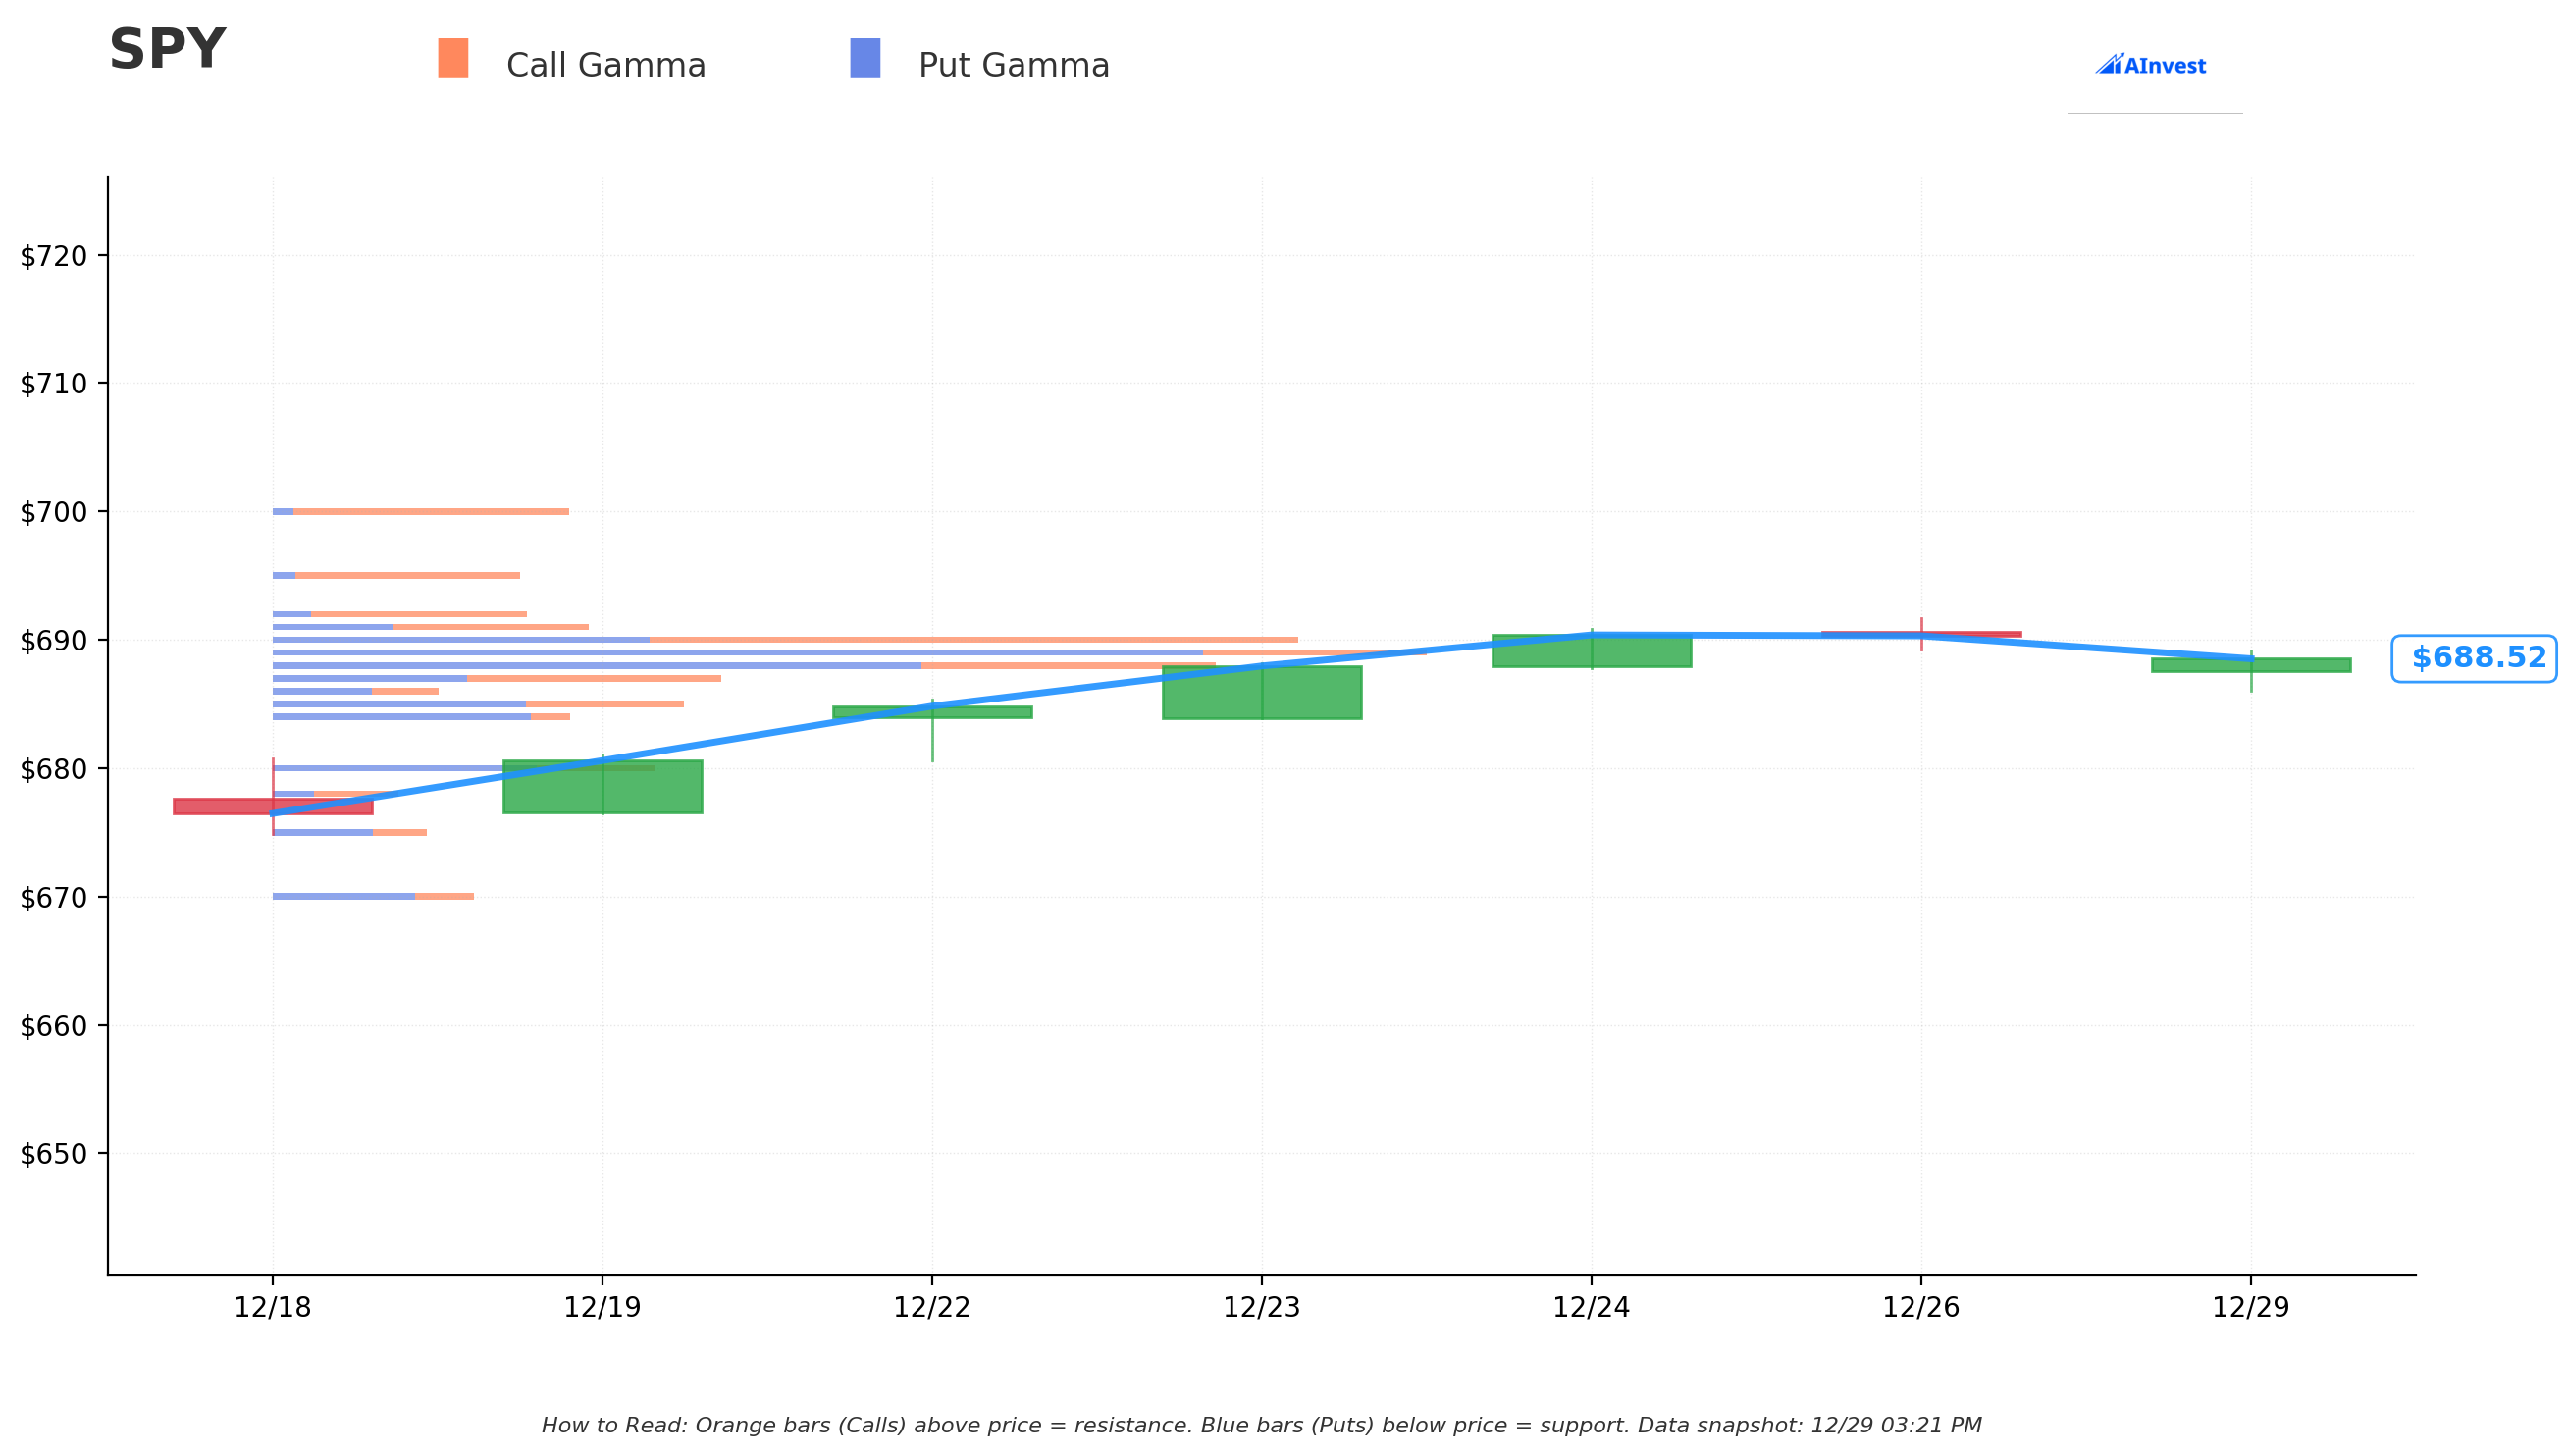
Gamma Exposure Analysis: The absence of significant GEX levels in recent data suggests dealers are relatively neutral heading into year-end, with most gamma exposure having decayed from December OPEX. This creates a lower-friction environment for directional moves, potentially explaining why the trader chose to eliminate gamma risk rather than rely on dealer support.
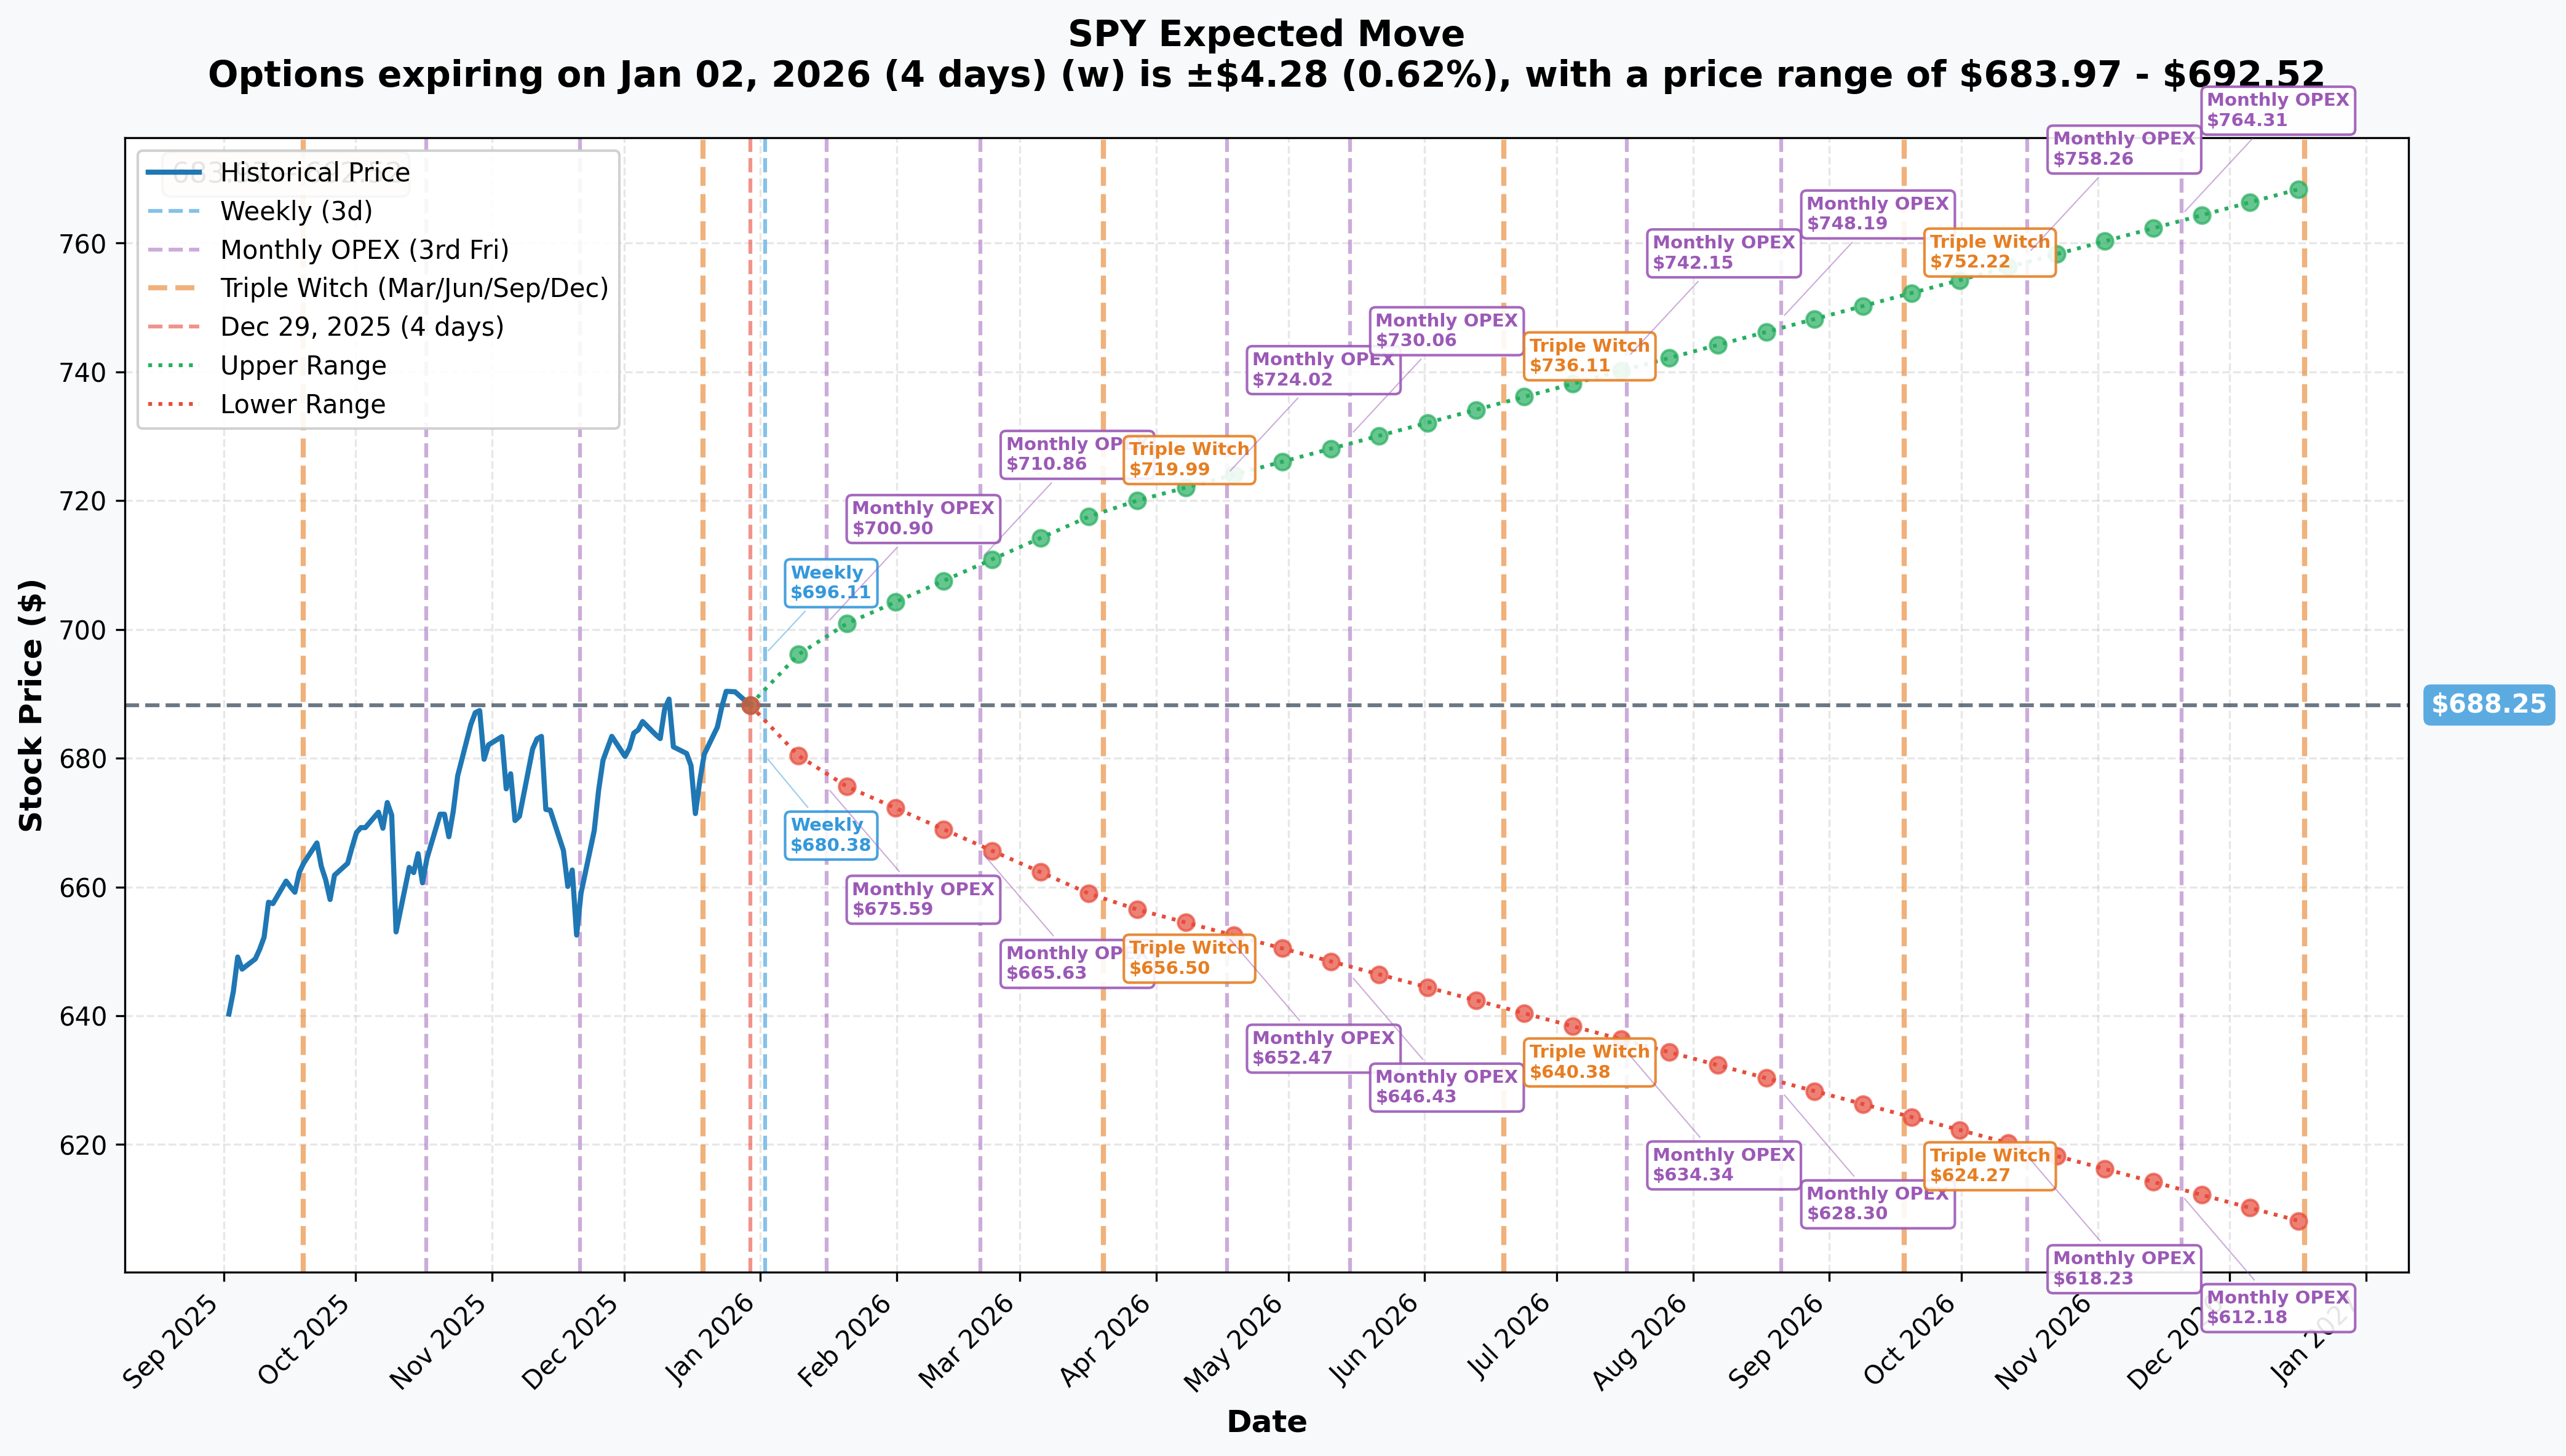
Implied Volatility & Expected Moves:
| Timeframe | Expiration | Implied Move | Price Range |
|---|---|---|---|
| Weekly | Jan 2, 2026 | ±0.62% | $683.97 - $692.52 |
| Monthly | Jan 16, 2026 | ±1.66% | $676.80 - $699.69 |
| Quarterly | Mar 20, 2026 | ±4.43% | $657.78 - $718.71 |
| Annual | Dec 18, 2026 | ±11.69% | $607.79 - $768.70 |
Analysis: The annual implied move of 11.69% appears conservative relative to Wall Street's 2026 year-end targets of 7,500-8,000 for the S&P 500 (equivalent to SPY $750-$800, representing 9-16% upside) according to TheStreet analyst consensus. This IV-target divergence suggests either the options market is pricing lower probability of extreme upside, or there's an opportunity for volatility sellers if the market meets Street targets.
🔥 Catalysts: What's Driving This Trade
🗓️ IMMEDIATE: January 27-28, 2026 FOMC Meeting
The Setup: After a contentious December meeting featuring an unusual 9-3 vote split according to the Federal Reserve Board, the Fed cut rates to 3.5-3.75% but signaled only one additional cut in 2026 per CNBC. Bond futures markets, however, price in two or more cuts—a significant divergence that must resolve according to TheStreet.
Market Implication: Fed policy uncertainty creates elevated option premiums. The monthly implied move of 1.66% ($11.45) through January 16 OPEX reflects this elevated volatility expectation. NPR reports this was the Fed's third consecutive rate cut in 2025, marking a potential pause in the easing cycle.
Historical Context: Yahoo Finance notes that internal Fed divisions that defined 2025 are expected to carry into 2026, with Chair Powell's term running through May 2026 creating additional uncertainty.
📈 MAJOR: Q4 2025 Earnings Season (Mid-January Start)
Consensus Estimates: FactSet's Earnings Insight projects 8.3% YoY earnings growth for Q4 2025, with Information Technology and Communication Services leading. However, these estimates assume no significant tariff-related margin compression.
2026 Full-Year Outlook: According to Investing.com, consensus S&P 500 EPS is projected at $306 for 2026 (vs. $272 in 2025 = 12.5% growth):
- Q1 2026: +13.1% YoY
- Q2 2026: +14.6% YoY
- Q3 2026: +14.7% YoY
- Q4 2026: +18.1% YoY
Big Tech Earnings (Late January): The Magnificent Seven, which contributed 75% of bull market gains since October 2022 per Fidelity, face increasingly difficult year-over-year comparisons. Microsoft, Alphabet, Amazon, and Meta have collectively projected $600B in AI capex for 2026 according to Seeking Alpha, and investors will scrutinize ROI evidence.
Major Bank Earnings (Week of January 13-17): Financial sector earnings will provide critical commentary on 2026 economic outlook and loan demand, with FactSet projecting earnings growth exceeding 6% for financials.
💰 CRITICAL: January 1 Tariff Implementation
New Tariff Rates: According to The Motley Fool, new tariff rates of 30-50% on select imports take effect January 1, 2026, with average tariff rates projected to reach 15.8% across 2026. Research from BlackRock shows U.S. companies and consumers bear 82% of tariff costs.
Economic Impact:
- GDP Drag: Projected 0.62% GDP reduction in 2026 per FX Empire
- Manufacturing Activity: U.S. manufacturing has fallen 9 straight months according to Visual Capitalist
- Market Impact: JPMorgan reduced long-term economic growth forecast by 0.2 percentage points due to trade policies
Historical Context: The April 7, 2025 "Liberation Day" tariff announcement drove SPY from $691 to a low of $481.80—a 30% decline—while VIX spiked above 60 according to FinancialContent. Current VIX at 13.60 suggests markets are underpricing tariff implementation risk.
🎅 Santa Claus Rally Watch (December 24 - January 5)
Traditional Pattern: The Santa Claus Rally period historically produces 1.3-1.6% gains with an 80% success rate over the past 50 years per Naga Academy. However, The Motley Fool reports that both 2023 and 2024 failed to deliver Santa rallies.
Current Status (December 29): SPY reached a 52-week high of $691.66 on December 24, but has since retreated to $686.72. According to Seeking Alpha, a failed Santa rally has historically preceded weak January and full-year performance.
🎯 Price Targets & Probabilities
Analyst Consensus
Wall Street 2026 Targets: TheStreet consensus shows:
- Average Target: 7,969 S&P 500 (SPY ~$797) = +16% upside
- Range: 7,100 (Bank of America) to 8,000 (Deutsche Bank)
- Implied SPY Range: $710 - $800
Key Targets:
- Deutsche Bank: 8,000 (+15.4%)
- Morgan Stanley: 7,800 (+12.5%)
- Wells Fargo: 7,800 (+12.5%)
- JPMorgan: 7,500-8,000 (+8.2% to +15.4%)
- Bank of America: 7,100 (+2.5%)
Technical Price Targets
Bullish Scenario (35% probability):
- Near-Term Target: $695-$700 (breakout above December highs)
- Q1 2026 Target: $710-$720 (post-FOMC/earnings strength)
- Year-End 2026: $740-$760 (Street consensus lower bound)
- Catalyst Path: Earnings exceed expectations, tariff impacts prove manageable, Fed delivers two cuts in H1 2026
Base Case (40% probability):
- Range: $670-$710 (consolidation continues)
- Q2 2026 Target: $690-$705 (modest upside with volatility)
- Catalyst Path: In-line earnings, tariffs compress margins modestly, Fed pauses after one cut
Bearish Scenario (25% probability):
- Downside Target: $640-$660 by Q2 2026 (6-8% decline)
- Support Levels: $676.80 (monthly implied move lower bound), $657.78 (quarterly lower bound)
- Catalyst Path: Valuation unsustainable at forward P/E 22.4; tariffs compress margins; Fed forced to pause cuts due to inflation
Valuation Framework
Current S&P 500 Metrics:
- Forward P/E: 22.4 (vs. 15-16 historical average) = 40% premium per Current Market Valuation
- Trailing P/E: 27.95-29.47 (vs. 17.99 median) = 55% premium according to GuruFocus
- Shiller CAPE: 38.9 (vs. 17.7 historical average) = 120% premium per AInvest
Valuation Justification: At forward P/E of 22.4 × $306 2026 EPS = 6,854 S&P 500 fair value = $685 SPY. Current price $686.72 is essentially at fair value IF earnings estimates prove accurate.
Historical Warning: 24/7 Wall St. reports that all five previous instances where the Shiller P/E exceeded 30 for 2+ months were followed by market declines of 20-89%. Current reading of 38.9 places SPY in the 98th percentile of historical valuations.
💡 Trading Ideas
🛡️ CONSERVATIVE: Protective Put Spread
Strategy: Hedged equity exposure for long SPY holders
- Structure: Buy $670 puts / Sell $650 puts (March 20, 2026)
- Cost: ~$5-7 per spread
- Protection: Limits losses below $670 (-2.4% from current)
- Max Risk: $20 per spread if SPY crashes below $650
- Rationale: Quarterly triple witch implied move of 4.43% suggests $657-$718 range. This structure protects against lower-range scenarios while capping hedge cost.
Why This Works:
- Defined Hedge Cost: Known maximum expense for downside protection
- Critical Support: $670 aligns with recent consolidation lows
- Expiration Timing: March 20 captures FOMC risk, earnings season, and tariff impact
- Asymmetric Risk/Reward: Protects against valuation-driven correction while maintaining upside participation
Ideal For: Long-term SPY holders concerned about Q1 2026 catalysts who want defined-cost protection.
⚖️ BALANCED: Bear Put Spread Targeting January Volatility
Strategy: Directional with defined risk for bearish lean
- Structure: Buy $685 puts / Sell $670 puts (February 20, 2026)
- Max Gain: $15 per spread if SPY < $670
- Breakeven: ~$680 (accounting for net debit)
- Max Loss: Net debit paid (~$5-6)
- Rationale: Captures downside if market corrects 2-4% during Q1 2026 catalyst events
Why This Works:
- Catalyst Alignment: Profits from FOMC or earnings-driven selloff
- Monthly Implied Move: 1.66% suggests $676-$699 range; this spread profits below that
- Defined Risk: Limited loss if wrong, meaningful gain if right
- Valuation Support: Forward P/E 40% above average provides fundamental backing
Ideal For: Traders with bearish conviction into FOMC/earnings who want asymmetric payoff.
🔥 AGGRESSIVE: Volatility Expansion Play
Strategy: Long straddle or strangle into FOMC
- Straddle: Buy $685 call + $685 put (February 20, 2026)
- OR Strangle: Buy $695 call + $675 put (lower cost)
- Breakeven: Requires ~3-4% move in either direction
- Rationale: VIX at 13.60 near 52-week lows despite high-catalyst environment per Yahoo Finance
Why This Works:
- VIX Disconnect: According to FinancialContent, the VIX "volatility paradox" shows markets underpricing realized volatility
- Historical Pattern: VIX expansion around FOMC meetings when policy uncertainty is elevated
- Monthly Implied Move: 1.66% suggests this may be mispriced for actual event risk
- Binary Events: FOMC, earnings, tariffs all converge in January-February window
Ideal For: Traders expecting increased volatility regardless of direction.
🎯 INSTITUTIONAL REPLICATION: Iron Condor for Range-Bound Trading
Strategy: Neutral/sideways positioning (25% probability scenario)
- Structure: Sell $670/$710 wings in February/March expirations
- Price Target: $680-$700 range-bound trading
- Timeframe: 30-60 days
- Rationale: Year-end positioning creates two-way flow; market breadth improving limits crash risk
Why This Works:
- Monthly Implied Range: 1.66% suggests $676-$699 range aligns with this structure
- Market Breadth: Nasdaq Dorsey Wright reports Equal Weight outperforming limits crash risk
- Theta Capture: Benefits from time decay if SPY consolidates
- FOMC Binary Risk: FOMC and earnings provide binary events that could cancel out
Ideal For: Experienced traders comfortable with multi-leg spreads who believe SPY consolidates into earnings.
⚠️ Risk Factors
🌍 Valuation Risk
Extreme Metrics: Current valuations sit at 40-year extremes according to Current Market Valuation:
- Forward P/E 40% above historical average
- Shiller CAPE at 38.9 in 98th percentile
- Trailing P/E 55% above median
Historical Precedent: 24/7 Wall St. notes all prior instances of Shiller P/E above 30 for extended periods preceded 20-89% declines. Limited multiple expansion room means earnings MUST deliver, or valuations compress violently.
Impact on Options: High valuations increase downside gap risk. Put spreads offer better risk/reward than naked longs given asymmetric risk profile.
💼 Tariff and Trade War Risk
Scheduled Implementation: January 1, 2026 tariff increases are confirmed per The Motley Fool:
- 30% duties on furniture
- 50% duties on cabinets/vanities from non-allied nations
- Average tariff rates rising to 15.8% in 2026
Economic Impact:
- GDP Drag: FX Empire projects 0.62% GDP reduction in 2026
- Consumer Impact: 82% of duties paid by U.S. companies/consumers per BlackRock
- Margin Compression: Threatens 12.5% earnings growth assumptions
Historical Context: April 2025 "Liberation Day" caused 30% SPY decline. Current VIX of 13.60 suggests markets underpricing tariff risk.
📊 Concentration Risk
Market Structure: According to ACM Wealth, the top 20 stocks comprise 48% of S&P 500 (up from 37% in 2020). The Magnificent Seven are responsible for 75% of gains since October 2022 per Fidelity.
Rotation Risk: Recent Nasdaq Dorsey Wright analysis shows Equal Weight outperforming since mid-December—first such action since Q1 2025. If rotation accelerates, cap-weighted SPY could underperform.
Magnificent Seven 2025 Performance: According to Yahoo Finance:
- Only 3 of 7 outperformed SPY's 17% gain
- Amazon (+5.5%) and Apple (+10%) underperformed significantly
- Tesla P/E of 195 per The Motley Fool raises valuation concerns
💸 Federal Reserve Policy Uncertainty
December Meeting Division: The unusual 9-3 vote split per Federal Reserve Board signals internal disagreement. Yahoo Finance reports these divisions are expected to carry into 2026.
Market Divergence: Bond futures price two or more cuts in 2026 per TheStreet, while Fed guidance suggests only one. This disconnect must resolve—either through Fed capitulation (bullish) or market repricing (bearish).
Tariff-Inflation Feedback: Charles Schwab's 2026 outlook warns PCE inflation could spike to 3.0%+ in H1 2026 due to tariffs, potentially forcing the Fed to pause rate cuts despite economic weakness.
📉 Consumer Sentiment Warning
Historic Weakness: The Motley Fool reports the Michigan Consumer Sentiment Index averaged 57.6 YTD—the lowest annual average since monthly surveys began in 1978. Given consumer spending accounts for ~67% of GDP, this threatens growth assumptions.
Tariff Impact: Rising import prices from January 1 tariffs could further pressure already-weak consumer sentiment, creating a negative feedback loop into Q1 2026.
🎲 Recession Risk
Professional Forecasts: J.P. Morgan's 2026 Market Outlook sees 35% probability of U.S. recession in 2026. Consensus GDP growth forecasts of 1.9-2.6% from Goldman Sachs, Deloitte, and RSM leave little margin for error.
Valuation Implications: Premium valuations (forward P/E 22.4) typically don't survive earnings declines. Any recession would likely trigger multiple compression from current elevated levels.
🎯 Bottom Line
What This Trade Signals: This $13.6M whale bet isn't panic—it's calculated risk management. The decision to close a 0DTE position 24 hours before expiration, accepting realized losses rather than gambling on overnight recovery, demonstrates sophisticated traders prioritizing certainty over hope. By eliminating $2M+ of gamma/pin risk for a defined cost, this institutional player signals defensive positioning heading into 2026's catalyst-heavy Q1.
The Bull Case: If earnings exceed expectations, tariffs prove manageable, and the Fed delivers two cuts in H1 2026, SPY could reach $720-$740 by Q2 2026 per TheStreet consensus. The 12.5% projected earnings growth for 2026 according to Investing.com supports current valuations IF it materializes.
The Bear Case: With the Shiller CAPE at 38.9—near dot-com bubble levels—and all five prior instances above 30 followed by major declines per 24/7 Wall St., downside risk is material. Tariffs projected to reduce GDP by 0.62% according to FX Empire could trigger the earnings disappointment that high multiples cannot withstand. A move to $640-$660 represents mean reversion toward historical valuation levels.
Retail Takeaway: You don't need $13.6M to express a similar view. The protective put spread ($670/$650 for $5-7) offers defined-cost hedging for long SPY holders. The bear put spread ($685/$670) provides directional exposure with limited risk for bearish traders. For volatility players, the straddle/strangle structure capitalizes on VIX at 13.60 while implied volatility appears to underprice the January-February event cluster.
Final Verdict: This trade signals institutional caution despite record highs. The timing—year-end 2025 as SPY consolidates near $690 following a 17-19% YTD gain according to 24/7 Wall St.—suggests smart money is reducing exposure into 2026's uncertain setup. Whether it's profit-taking after a strong year, concern about extreme valuations, or positioning for Q1 catalysts, the message is clear: someone believes clean books and defined risk matter more than betting on overnight miracles. The convergence of the January 27-28 FOMC meeting, Q4 earnings season, and January 1 tariff implementation creates a high-stakes inflection point for the S&P 500.
Risk Disclosure: Options trading involves substantial risk and is not suitable for all investors. The strategies discussed in this analysis are for educational purposes only and do not constitute investment advice. Spread trades can result in total loss of premium paid. 0DTE/1DTE options experience rapid time decay and high volatility. SPY options settle in shares (American-style exercise), creating assignment risk. Tariff policy uncertainty creates unprecedented fundamental risk in 2026. Valuation extremes increase probability of sharp corrections. Consult a licensed financial advisor before implementing any options strategy.
🔗 Additional Resources
Option Analysis: Chart Analysis - $689 Put, Dec 2025 Expiry
Full ETF Analysis: SPY Deep Dive
Analysis completed: December 29, 2025 | SPY Spot: $686.72 | S&P 500: ~6,930 | VIX: 13.60