📅 January 14, 2026 | 🔥 Unusual Activity Detected
🎯 The Quick Take
Someone just dropped $6.2 MILLION on a Bull Put Spread in SPY, betting the S&P 500 stays above $660 through February! 🐋 With SPY trading just 1% below its all-time high of $695.17, this institutional player is collecting premium while expressing massive confidence in continued market strength.
💰 The Option Flow Breakdown
📊 What Just Happened
| Time | Symbol | Buy/Sell | Call/Put | Expiration | Premium | Strike | Volume | OI | Size | Spot Price | Option Price | Option Symbol |
|---|---|---|---|---|---|---|---|---|---|---|---|---|
| 10:28:10 | SPY | SELL | PUT | 2026-02-20 | $3.2M | $660 | 10,000 | 53,000 | 7,000 | $689.30 | $4.60 | SPY20260220P660 |
| 10:28:10 | SPY | BUY | PUT | 2026-02-20 | $3.0M | $657 | 8,000 | 839 | 7,000 | $689.30 | $4.25 | SPY20260220P657 |
📅 Expiration: 2026-02-20 (37 days out)
💸 Total Premium: $6.2M combined
🔥 Unusual Score: This is EXTREMELY_UNUSUAL activity!
🤓 What This Actually Means
Real talk: This is a classic Bull Put Spread - one of Wall Street's favorite ways to say "I think the market stays up, and I want to get paid while I wait."
Here's the breakdown for us regular folks:
🎯 The Short Leg ($660 Put SELL): The trader collected premium by selling 10,000 puts at the $660 strike. They're betting SPY stays ABOVE $660 by February 20th.
🛡️ The Long Leg ($657 Put BUY): To protect against a market crash, they bought 8,000 puts at $657. This caps their max loss if everything goes sideways.
Translation: This institutional player is saying "I'm so confident SPY doesn't drop 4.3% in the next 5 weeks that I'm willing to risk my capital on it." With SPY at ~$689, the $660 strike is about $29 below current price - a meaningful cushion.
The slight mismatch in contract sizes (10,000 vs 8,000) suggests this might be a partial hedge or the trader has some additional exposure elsewhere. Either way, this is NOT your neighbor Bob's Robinhood account!
📈 Technical Setup / Chart Check-Up
YTD Performance
SPY has been on an absolute tear! The S&P 500 ETF delivered +17.9% returns in 2025 according to Mariner Wealth Advisors, marking the third consecutive year of double-digit gains. The index hit all-time highs 39 times during 2025 per Investing Daily.
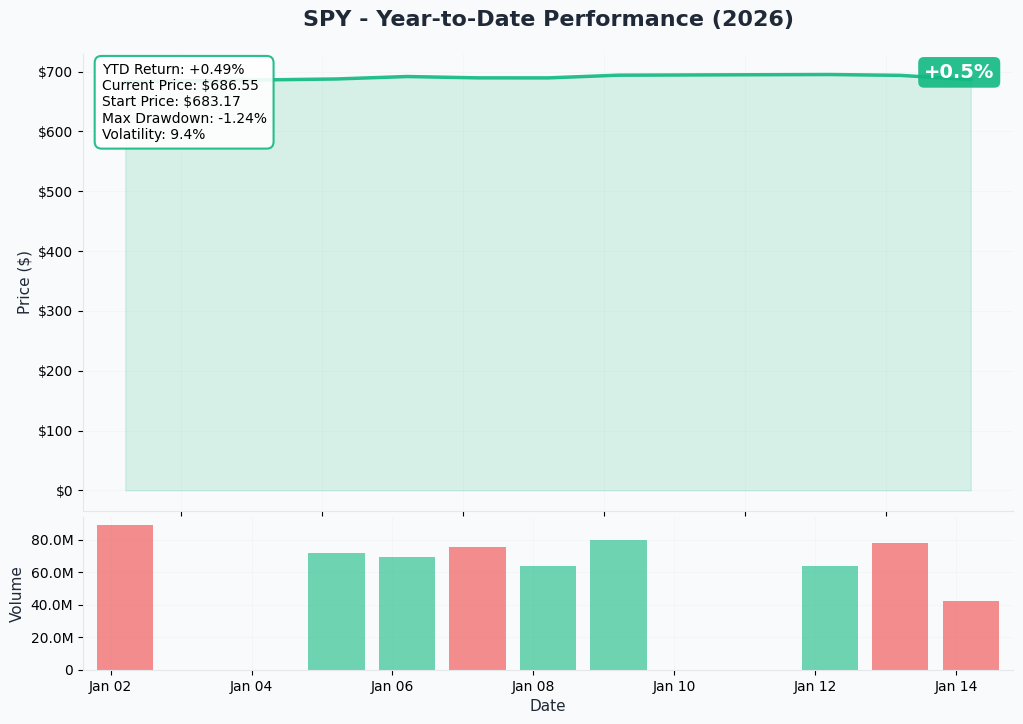
Key Stats:
- 📊 Current Price: ~$689.75
- 🏆 All-Time High: $695.17 (January 12, 2026)
- 📈 52-Week Range: $481.80 - $696.09
- 💼 Market Cap: $718.6B
🎯 Gamma-Based Support & Resistance Analysis
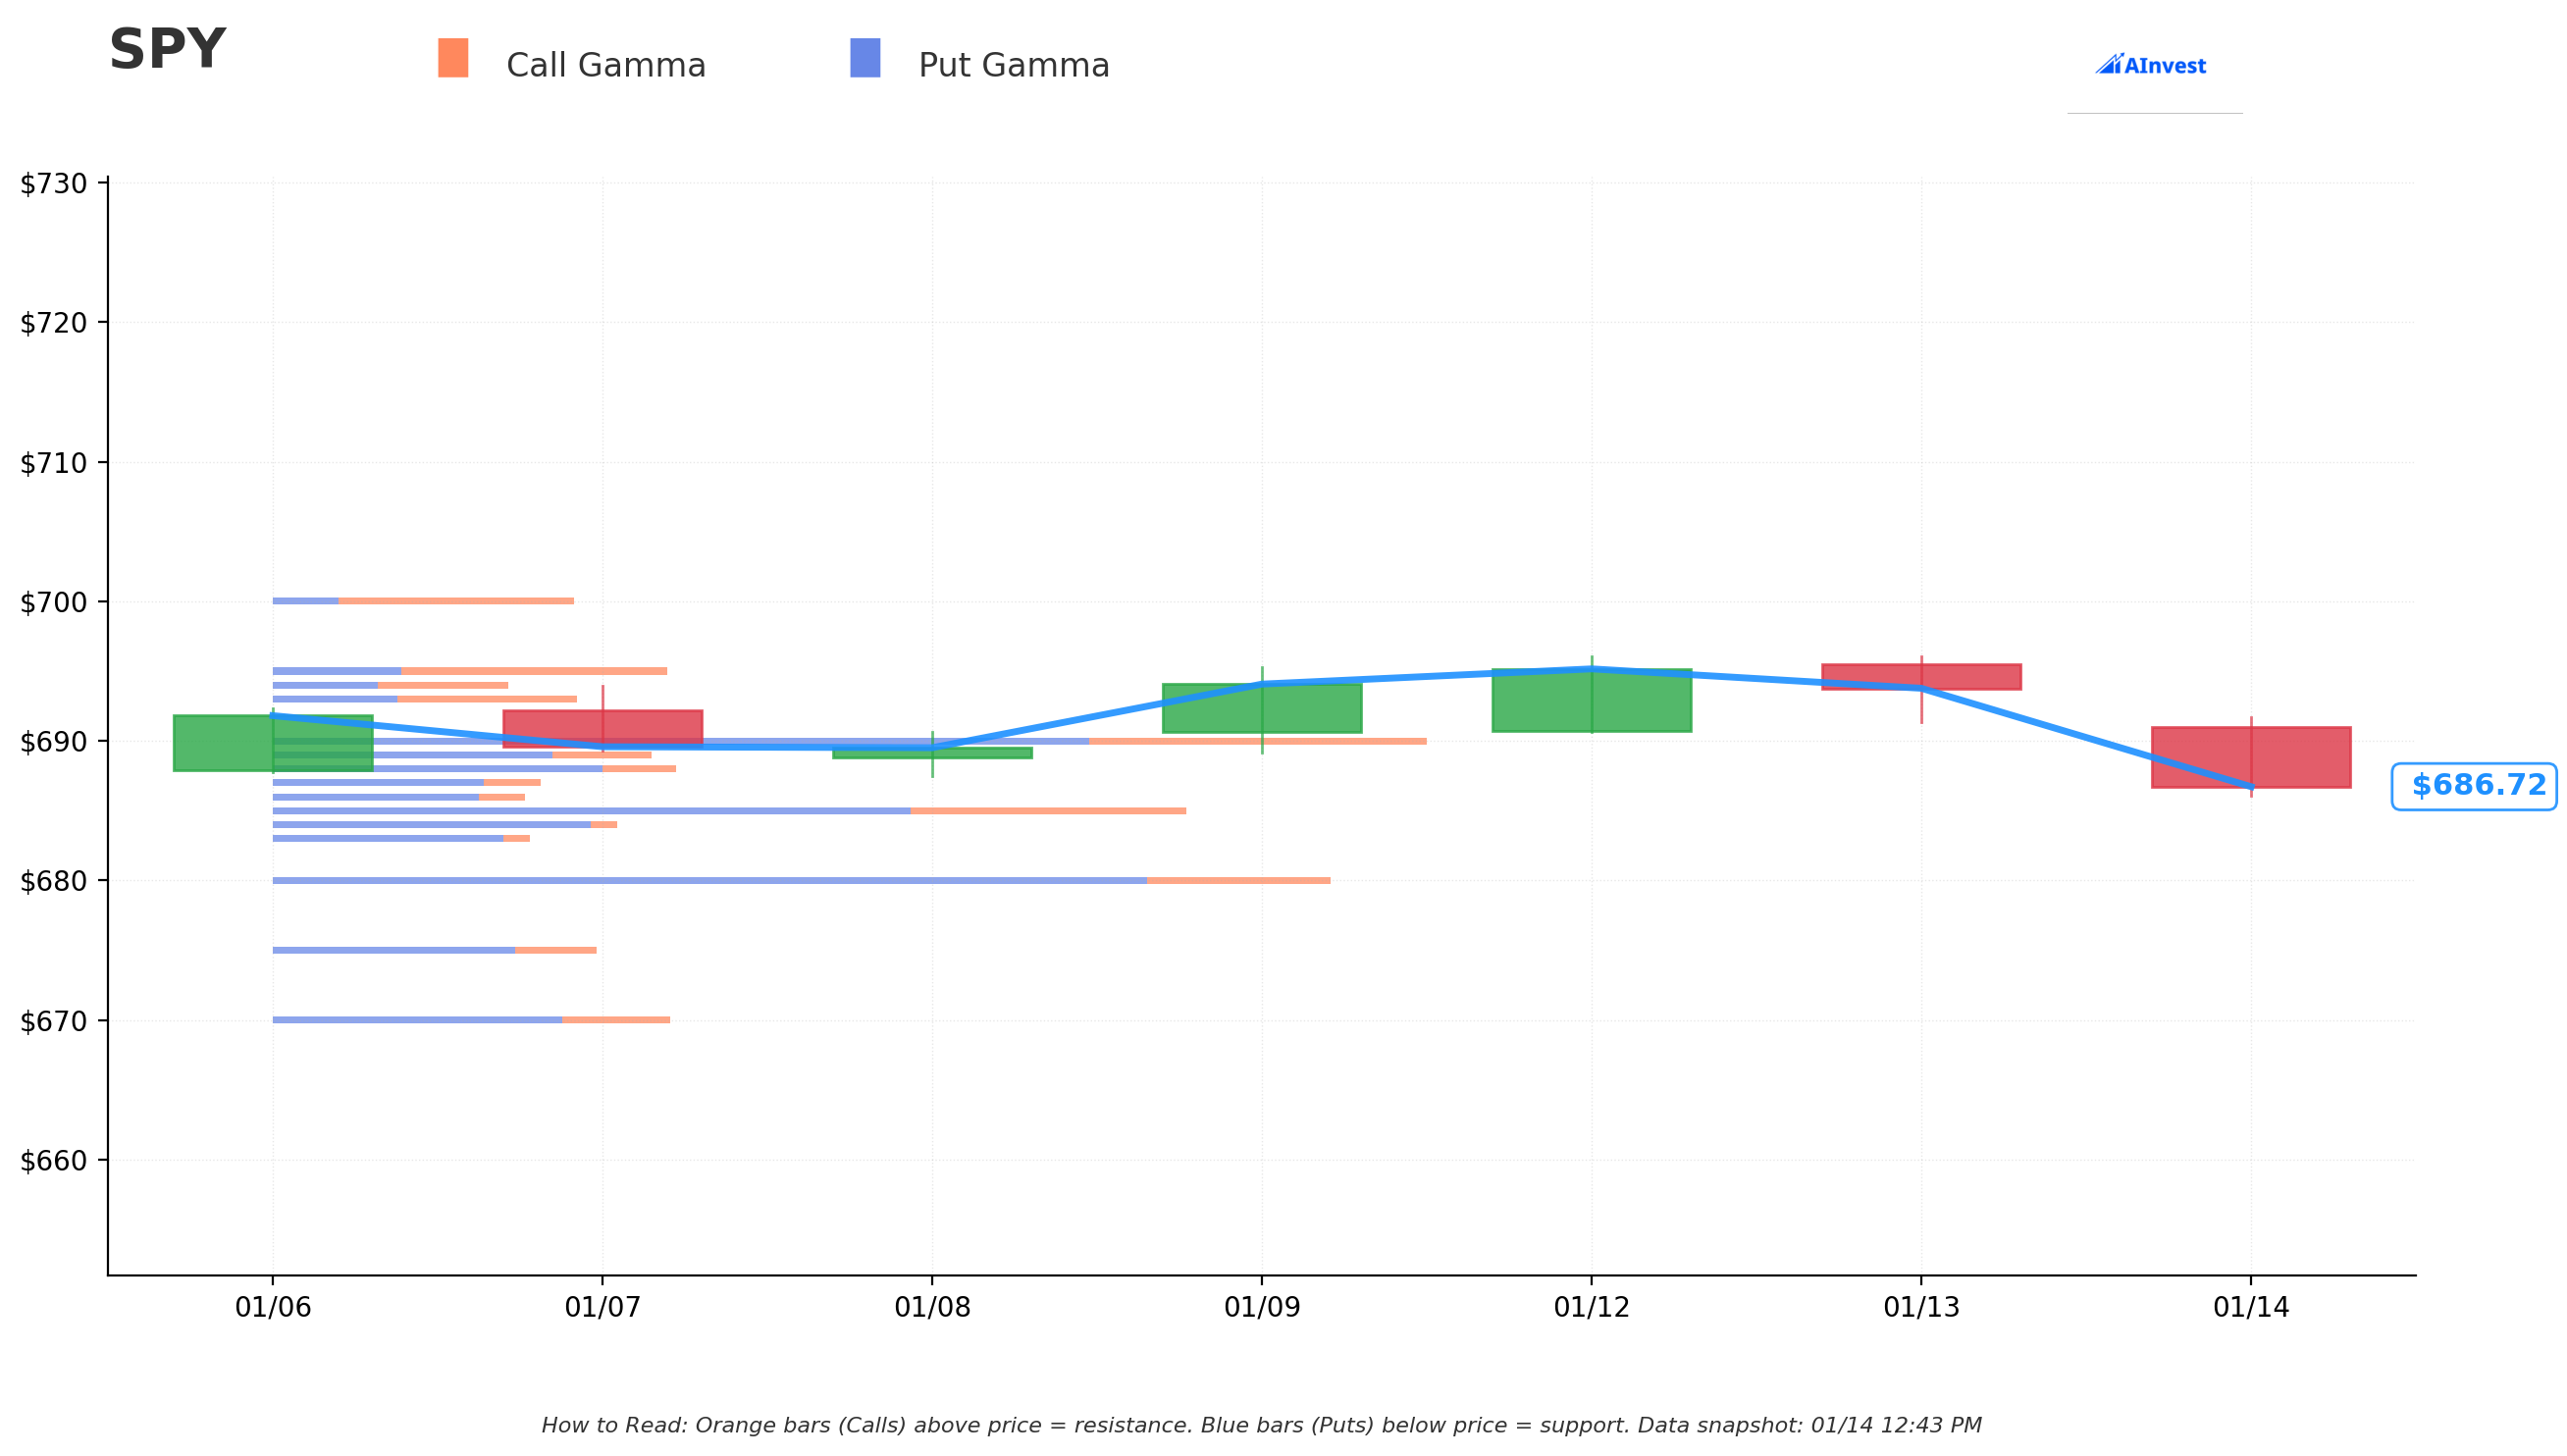
Based on the current gamma exposure from options market makers:
🔵 Support Levels (Put Gamma - Where Buying Pressure Lives):
- $685 - Strongest nearby support (0.25% below current price)
- $680 - Major support zone with heavy put gamma
- $675 - Secondary support
- $670 - Floor zone if selling accelerates
- $660 - Our trade's short strike! Heavy put activity here
🟠 Resistance Levels (Call Gamma - Where Selling Pressure Builds):
- $688 - Immediate resistance (0.19% above)
- $690 - Round number resistance with significant gamma
- $693 - Flip zone where net GEX turns positive
- $695 - All-time high resistance zone!
📉 Net GEX Bias: Currently Bearish with total put GEX ($4,184M) exceeding call GEX ($2,227M). This means market makers are net short gamma - expect amplified moves in either direction!
📊 Implied Move Analysis
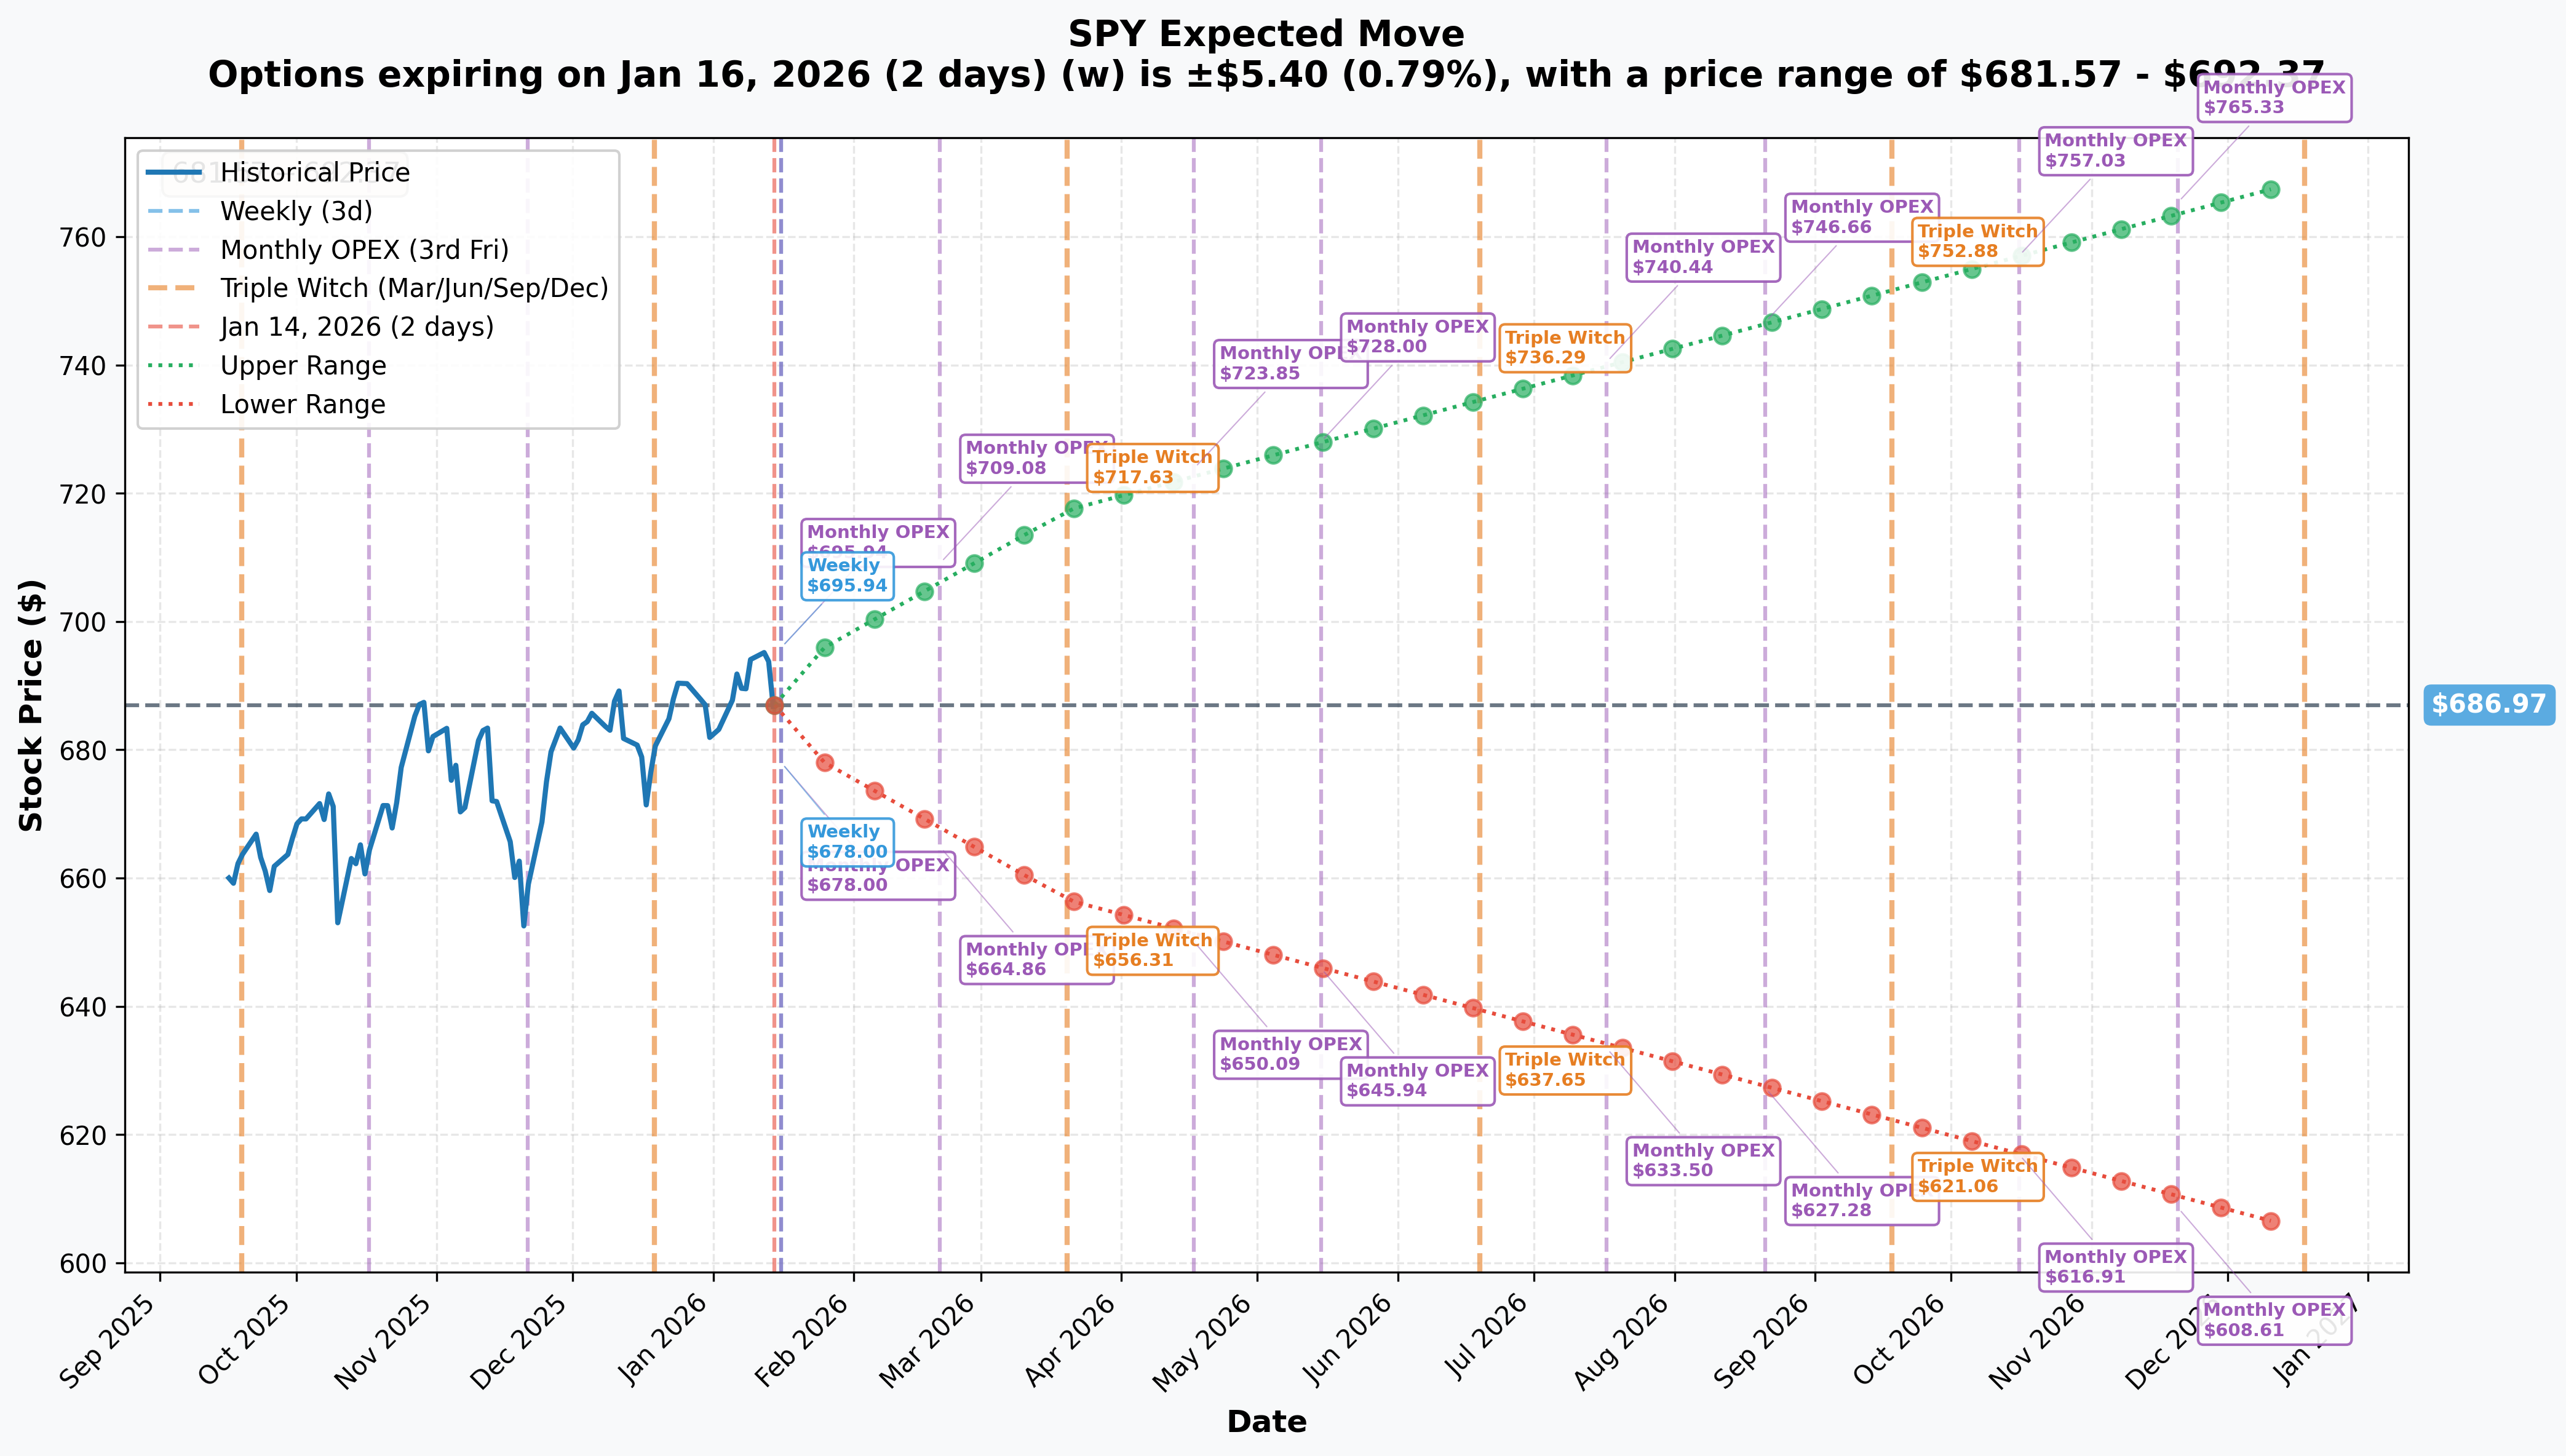
What Options Pricing Tells Us About Expected Ranges:
| ⏰ Timeframe | 📅 Expiry | 📈 Upper Range | 📉 Lower Range | ±% Move |
|---|---|---|---|---|
| Weekly | 2026-01-16 | $692 | $682 | ±0.79% |
| Feb OPEX | 2026-02-20 | $709 | $665 | ±3.2% |
| Triple Witch | 2026-03-20 | $717 | $656 | ±4.4% |
| Yearly LEAPs | 2026-12-18 | $769 | $605 | ±11.9% |
🎯 Key Insight for Our Trade: The February monthly OPEX (our trade's expiration) shows an implied range of $665 to $709. The short leg at $660 sits BELOW this expected range - the options market is pricing in a ~68% probability that SPY stays above $660 by expiration!
🎪 Catalysts
📅 Upcoming Catalysts (Mark Your Calendar!)
| Date | Event | Impact |
|---|---|---|
| Jan 14-15 | Major Bank Earnings (BAC, C, GS) | 🔥 High |
| Jan 22 | Q4 2025 GDP Advance Estimate | 🔥 High |
| Jan 26 - Feb 27 | Peak Q4 Earnings Season | 🔥 High |
| Jan 27-28 | FOMC Meeting | ⚡ Critical |
| Feb 11 | January CPI | 🔥 High |
| Feb 20 | Our Options Expire! | ⏰ D-Day |
✅ Recent Catalysts (Already Happened)
📈 Economic Data:
- ✅ December CPI (Jan 13): 2.7% YoY headline, core at 2.6% - cooler than expected per CNN Business
- ✅ Q4 GDP Nowcast: Tracking 5.1% per Atlanta Fed GDPNow - economy remains hot
- ✅ December Jobs: +50K payrolls, unemployment down to 4.4%
🏦 Bank Earnings:
- ✅ JPMorgan (Jan 13): Beat EPS ($5.23 vs $4.85 consensus) but stock fell 2.5% on $105B expense guidance per Financial Content
🏛️ Fed Policy:
- ✅ Three 25bp cuts in late 2025
- ✅ Current Fed Funds Rate: 3.50%-3.75%
- ✅ December Dot Plot: Median shows one 25bp cut in 2026 per Morningstar
🎲 Price Targets & Probabilities
Based on gamma levels, implied move analysis, and catalyst timing:
🚀 Bull Case: $710-$720 (25% probability by Feb 20)
Why it could happen:
- Q4 GDP comes in above 5% (official release Jan 22)
- FOMC maintains dovish tone, hints at June cut
- Magnificent Seven earnings crush estimates
- Market breaks through $695 ATH resistance
Gamma Support: Strong call gamma builds above $693 creating a "flip zone" - if SPY breaks through, market makers would need to buy to hedge, potentially accelerating the rally.
⚖️ Base Case: $680-$695 (55% probability by Feb 20)
Why this is most likely:
- Economic data supports "soft landing" narrative
- Earnings broadly in-line with 8.3% growth expectations
- Fed holds at January meeting (16% cut probability per CME FedWatch)
- SPY consolidates near ATH before next leg
Gamma Support: Heavy gamma concentration between $680-$690 creates a "magnetic" zone where price tends to gravitate. This range sits comfortably above our $660 short strike.
😰 Bear Case: $660-$680 (20% probability by Feb 20)
What could go wrong:
- Inflation surprises to the upside (Jan CPI Feb 11)
- Earnings disappointments from mega-caps
- Fed turns hawkish, takes rate cuts off table
- Geopolitical shock or tariff escalation
Gamma Support: Put gamma intensifies below $680, but the $660 level has significant put activity - this could act as a "floor" where institutional buyers step in.
💡 Trading Ideas
🛡️ Conservative: "The Sleep Well Strategy"
Follow the Whale - Sell Your Own Bull Put Spread
💰 Estimated Credit: ~$0.50-0.75 per spread
📈 Max Profit: Credit received if SPY stays above $650
📉 Max Loss: $5 width minus credit received
Why this works: Even more cushion than the whale trade! $650 is about 5.8% below current price. You'd need a genuine market crash to hit this level. The February implied move only reaches down to $665 at the lower bound.
Best for: Traders who want income with minimal stress. Set it and forget it!
⚖️ Balanced: "The Smart Money Mimic"
Mirror the Institutional Trade (Smaller Size)
💰 Estimated Credit: ~$0.30-0.50 per spread
📈 Max Profit: Credit received (keeping premium as SPY stays above $660)
📉 Max Loss: $3 width minus credit received
Why this works: If institutions are putting millions on this exact trade, the risk/reward math is probably solid. You're getting the same thesis with retail-sized risk. The $660 strike aligns with major put gamma support.
Best for: Swing traders who trust institutional flow but want defined risk.
🚀 Aggressive: "ATH Breakout Play"
Ride the Bull to New Highs
💰 Estimated Cost: ~$4-6 per contract
📈 Max Profit: Unlimited above $700 + premium paid
📉 Max Loss: Premium paid
Why this works: With SPY just 1% from ATH, a breakout could trigger a wave of momentum buying. Q4 earnings season and a dovish Fed could be the catalyst. Wall Street's 2026 target consensus is $750-800 per TipRanks.
Best for: Traders who believe the bull market has legs and want asymmetric upside exposure.
🎯 Pro Tip: Consider a call spread ($700/$720) to reduce cost and improve breakeven odds!
⚠️ Risk Factors
Let's keep it real - here's what could torpedo this trade:
📉 Valuation Concerns
- S&P 500 forward P/E at 22x - near historical highs per Motley Fool
- Fed Chair Powell has warned about elevated equity prices
- Shiller CAPE remains stretched
🎢 Concentration Risk
- Magnificent Seven represents ~37% of index weight per Yahoo Finance
- If NVDA, AAPL, or GOOGL stumble, SPY gets dragged down
- Tech sector rotation already showing signs per Charles Schwab
📊 Economic Wildcards
- J.P. Morgan assigns 35% probability to US recession
- 2025 job growth was worst since 2009 (outside COVID) per NBC News
- Inflation could surprise higher - shelter costs still elevated at +3.2% YoY
🏛️ Policy Risks
- Supreme Court ruling on tariff authority pending per Capital Spectator
- Fed Chair Powell's term ends May 2026 - uncertainty ahead
- Credit card rate cap proposals spooked bank stocks
🐋 Trade-Specific Risks
- Contract size mismatch (10K vs 8K) suggests this may be part of larger position
- $660 strike has heavy put gamma - could see volatility if tested
- 37 days is enough time for multiple catalysts to impact price
🎯 The Bottom Line
Real talk: This $6.2M Bull Put Spread is institutional money saying "the market isn't crashing anytime soon." This isn't random noise - it's a high-conviction bet.
📋 Your Action Plan:
If you're bullish on SPY:
- Consider the Balanced or Conservative spread strategies above
- The $660 strike offers 4.3% downside cushion with Q4 earnings as a tailwind
- Mark January 27-28 (FOMC) and February 11 (CPI) on your calendar
If you're neutral/watching:
- This trade confirms institutional confidence but doesn't signal imminent breakout
- Wait for ATH breakout above $695 before adding bullish exposure
- Monitor put/call ratios for sentiment shifts
If you're bearish:
- Respect the flow - big money is betting against you
- Wait for clear technical breakdown below $680 before shorting
- February puts are pricing in limited downside expectation
📅 Key Dates to Watch:
| Date | Event | Why It Matters |
|---|---|---|
| Jan 22 | Q4 GDP | Confirms economic strength thesis |
| Jan 27-28 | FOMC | Fed tone sets market direction |
| Feb 11 | January CPI | Inflation trajectory critical |
| Feb 20 | Options Expiration | Our trade's judgment day! |
🎓 The Lesson Here:
When you see institutions putting $6.2M on a position that profits from nothing dramatic happening, pay attention. The smart money isn't always betting on moonshots - sometimes they're just betting that the world keeps spinning. And right now, with SPY near all-time highs and economic data supporting the soft landing narrative, that's not a crazy bet to make.
Stay sharp out there! 💪
📜 Options Trading Resources
📊 View the Full Option Chain:
⚠️ Disclaimer: This analysis is for educational purposes only and does not constitute financial advice. Options trading involves significant risk of loss and is not suitable for all investors. Past performance does not guarantee future results. Always do your own research and consider consulting a financial advisor before making investment decisions.
Analysis generated January 14, 2026 | Data sources: ThetaData, FactSet, Federal Reserve, BLS, Yahoo Finance