SPY Bear Put Spread - $8.2M Institutional Hedge Before FOMC & Mega-Cap Earnings Week!
January 26, 2026 | Unusual Activity Detected
The Quick Take
An institutional player just dropped $8.2 MILLION on a Bear Put Spread in SPY this morning, buying 20,000 contracts of the $659 strike puts while selling the $655 puts - both expiring February 20th. This is a sophisticated directional bet against the S&P 500 heading into the most catalyst-dense week of 2026: FOMC meeting (Jan 27-28), four Magnificent Seven earnings (MSFT, META, TSLA, AAPL), and Q4 GDP print. With SPY trading near all-time highs at $693 and a put/call ratio of 2.31, smart money is positioning for a potential 5-10% pullback over the next 25 days.
ETF Overview
SPDR S&P 500 ETF Trust (SPY) is the world's largest and most liquid exchange-traded fund, tracking the S&P 500 Index:
- AUM: $704.84 Billion (largest ETF globally)
- Current Price: $693.73
- All-Time High: $695.16 (January 12, 2026)
- 52-Week Range: $481.80 - $696.09
- YTD Return: +17.75%
- Expense Ratio: 0.0945%
- Primary Exchange: NYSE Arca
- Index Tracked: S&P 500 (500 largest U.S. companies by market cap)
SPY provides exposure to the entire U.S. large-cap equity market, with top holdings including Apple, Microsoft, Amazon, Nvidia, and Alphabet. It is the benchmark by which institutional portfolio managers measure their performance and the primary vehicle for hedging broad market exposure.
The Option Flow Breakdown
What Just Happened
| Date | Time | Symbol | Buy/Sell | Type | Expiration | Strike | Volume | Premium | Strategy | Z-Score | Classification |
|---|---|---|---|---|---|---|---|---|---|---|---|
| 2026-01-26 | 10:21:11 | SPY | BUY | PUT $659 | 2026-02-20 | $659 | 20,000 | $4,400,000 | Bear Put Spread (Long Leg) | 12.7 | EXTREMELY UNUSUAL |
| 2026-01-26 | 10:21:11 | SPY | SELL | PUT $655 | 2026-02-20 | $655 | 20,000 | $3,800,000 | Bear Put Spread (Short Leg) | 4.23 | EXTREMELY UNUSUAL |
Net Premium Paid: $600,000 ($4.4M - $3.8M = $0.6M net debit, or $0.30 per spread)
What This Actually Means
This is a Bear Put Spread - a defined-risk bearish strategy that profits when the underlying declines. Here's the mechanics:
How a Bear Put Spread Works:
- Buy the higher strike put ($659) - this is your long leg that gains value as SPY drops
- Sell the lower strike put ($655) - this caps your profit but reduces the cost of the trade
- Net Debit: You pay a net premium to enter (in this case, ~$0.30 per share or $600K total)
- Max Profit: Achieved when SPY closes at or below $655 at expiration = $4 per spread - $0.30 cost = $3.70 profit per share ($7.4M total)
- Max Loss: If SPY stays above $659 at expiration = $0.30 per share ($600K total)
- Breakeven: $659 - $0.30 = $658.70
Why this structure matters:
- 5% downside target: Betting SPY drops from $693 to $655-659 (a -5% to -5.5% move)
- Defined risk: Maximum loss is the $600K premium paid - no margin calls, no unlimited downside
- Expiration timing: February 20th OPEX captures FOMC (Jan 27-28), earnings week (Jan 28-29), February CPI (Feb 11), and January jobs report (Feb 6)
- Risk/Reward: ~1:12 ratio ($600K risk for $7.4M max profit) - highly asymmetric payoff
What the trader expects: This institutional player believes SPY could drop 5%+ over the next 25 days. They're paying a relatively small premium ($600K) for the right to profit if the market corrects. The February 20th expiration gives them a full month of catalyst exposure including the two biggest risk events: FOMC and Mag 7 earnings.
Unusualness Assessment: With Z-scores of 12.7 (long leg) and 4.23 (short leg), this is an EXTREMELY UNUSUAL trade. A z-score above 3 is considered rare, and 12.7 means this trade is over 12 standard deviations above normal activity. This happens maybe a few times per year in SPY puts.
Technical Setup / Chart Check-Up
YTD Performance Chart
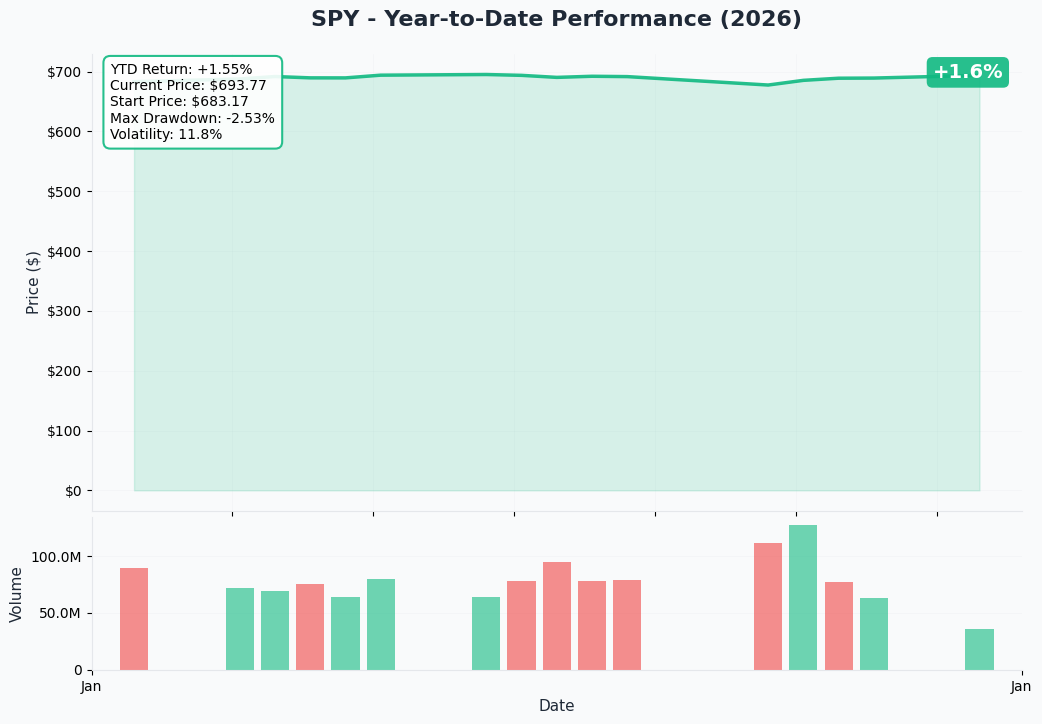
SPY has been on a remarkable run - up +17.75% YTD at $693.73, trading just 1.4% below all-time highs of $695.16 reached on January 12, 2026. The chart shows:
- Strong momentum: Near-vertical rally from December lows
- ATH proximity: Within striking distance of record highs
- Failed Santa Claus Rally: Late December dip was quickly recovered
- Tariff volatility: January 20-21 saw a sharp selloff on Trump Greenland tariff threats, followed by a quick recovery on the "TACO trade" reversal
- Consolidation zone: Trading in a tight range near highs as market awaits FOMC and earnings
Gamma-Based Support & Resistance Analysis
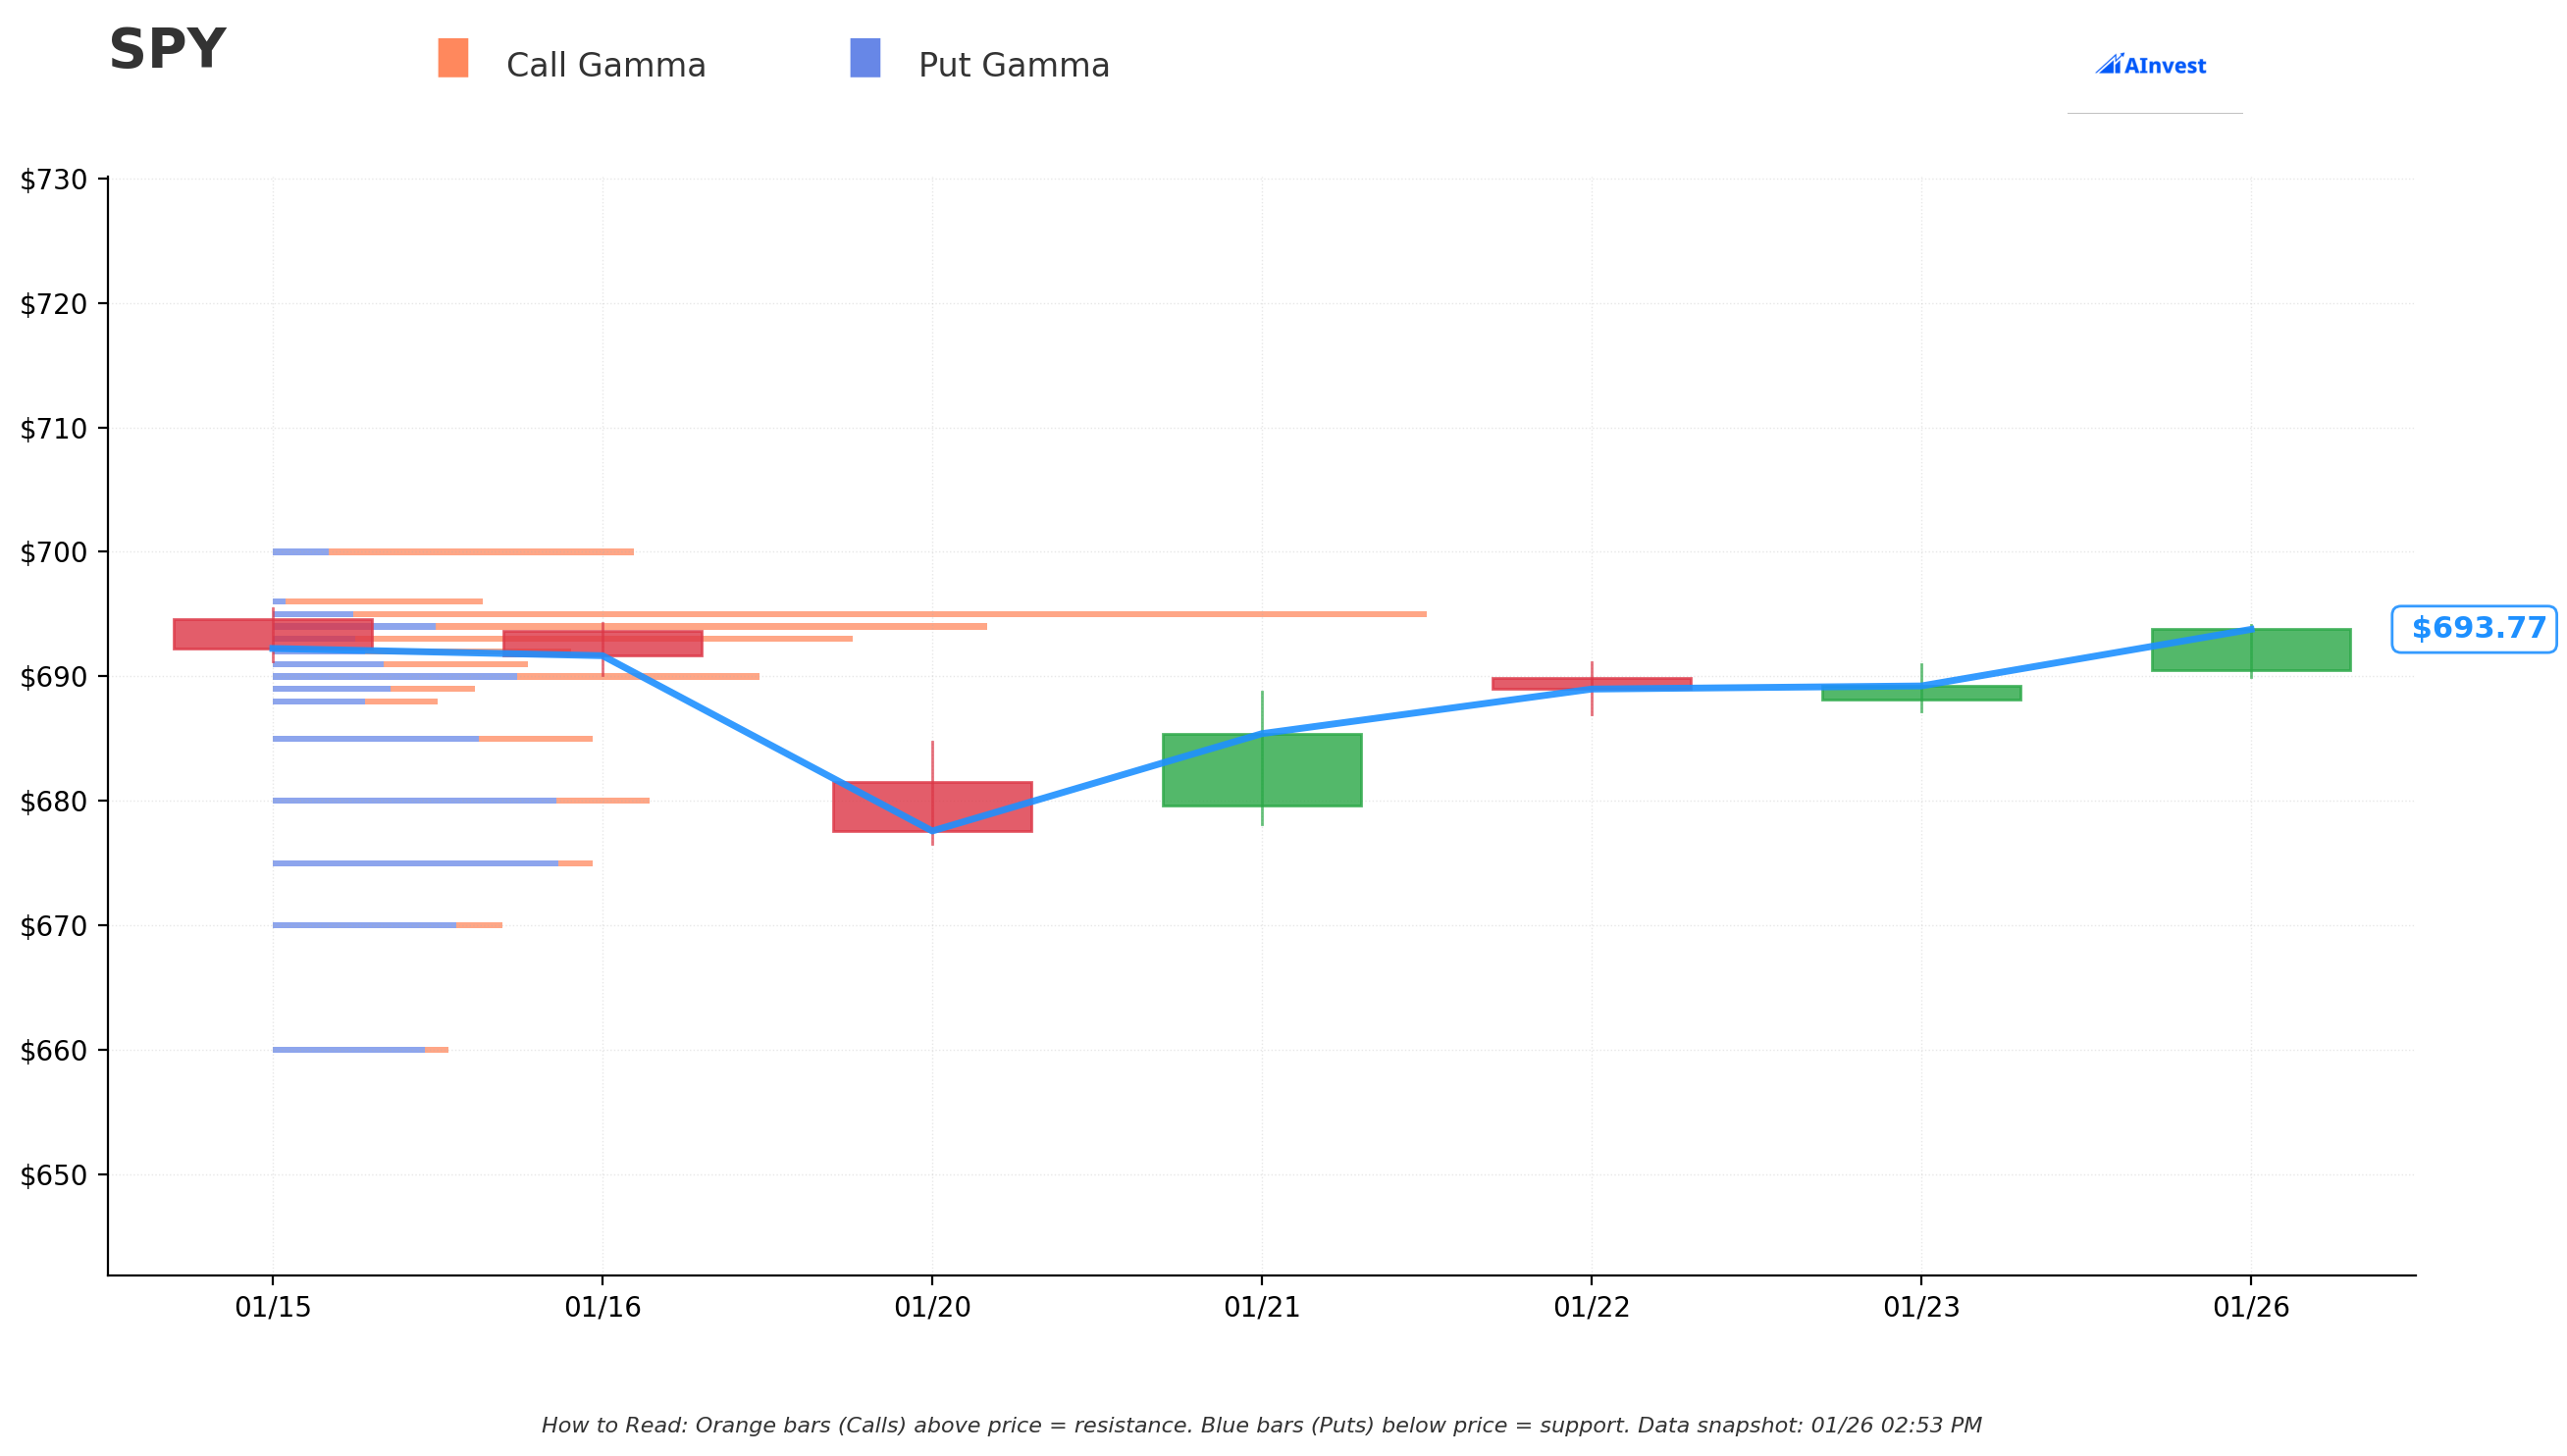
Current Price: $693.64
The gamma exposure map reveals where market makers are heavily positioned and creates natural price magnets:
Resistance Levels (Call Gamma Above Price):
| Strike | Call GEX | Put GEX | Net GEX | Distance % | Significance |
|---|---|---|---|---|---|
| $695 | 592.2 | 45.7 | +546.4 | +0.2% | STRONGEST RESISTANCE - Major gamma wall |
| $694 | 311.0 | 89.7 | +221.3 | +0.05% | Immediate overhead |
| $700 | 174.0 | 32.3 | +141.7 | +0.9% | Psychological ceiling |
Support Levels (Put Gamma Below Price):
| Strike | Call GEX | Put GEX | Net GEX | Distance % | Significance |
|---|---|---|---|---|---|
| $693 | 298.5 | 48.3 | +250.1 | -0.09% | Immediate support |
| $692 | 127.9 | 54.0 | +74.0 | -0.24% | Secondary floor |
| $690 | 140.0 | 142.5 | -2.5 | -0.53% | Neutral zone |
| $685 | 65.0 | 119.1 | -54.1 | -1.25% | Put gamma takes over |
| $680 | 54.1 | 163.8 | -109.7 | -1.97% | Strong put support |
| $675 | 19.9 | 164.4 | -144.5 | -2.69% | Deep support |
What this means for traders:
- SPY is pinned between massive $695 call gamma wall (546 net GEX - dealers will sell into any rally here) and $693 support just below current price
- Above $695, breakout potential exists toward $700, but the gamma wall creates significant resistance
- Below $690, momentum could accelerate as put gamma dominates and dealers add to selling pressure
- The Bear Put Spread targets $655-659, which is approximately 5% below current levels - well below all visible gamma support levels
Net GEX Bias: Bullish overall (3,335 call GEX vs 2,449 put GEX), but this can shift quickly if price breaks below key support levels.
Implied Move Analysis
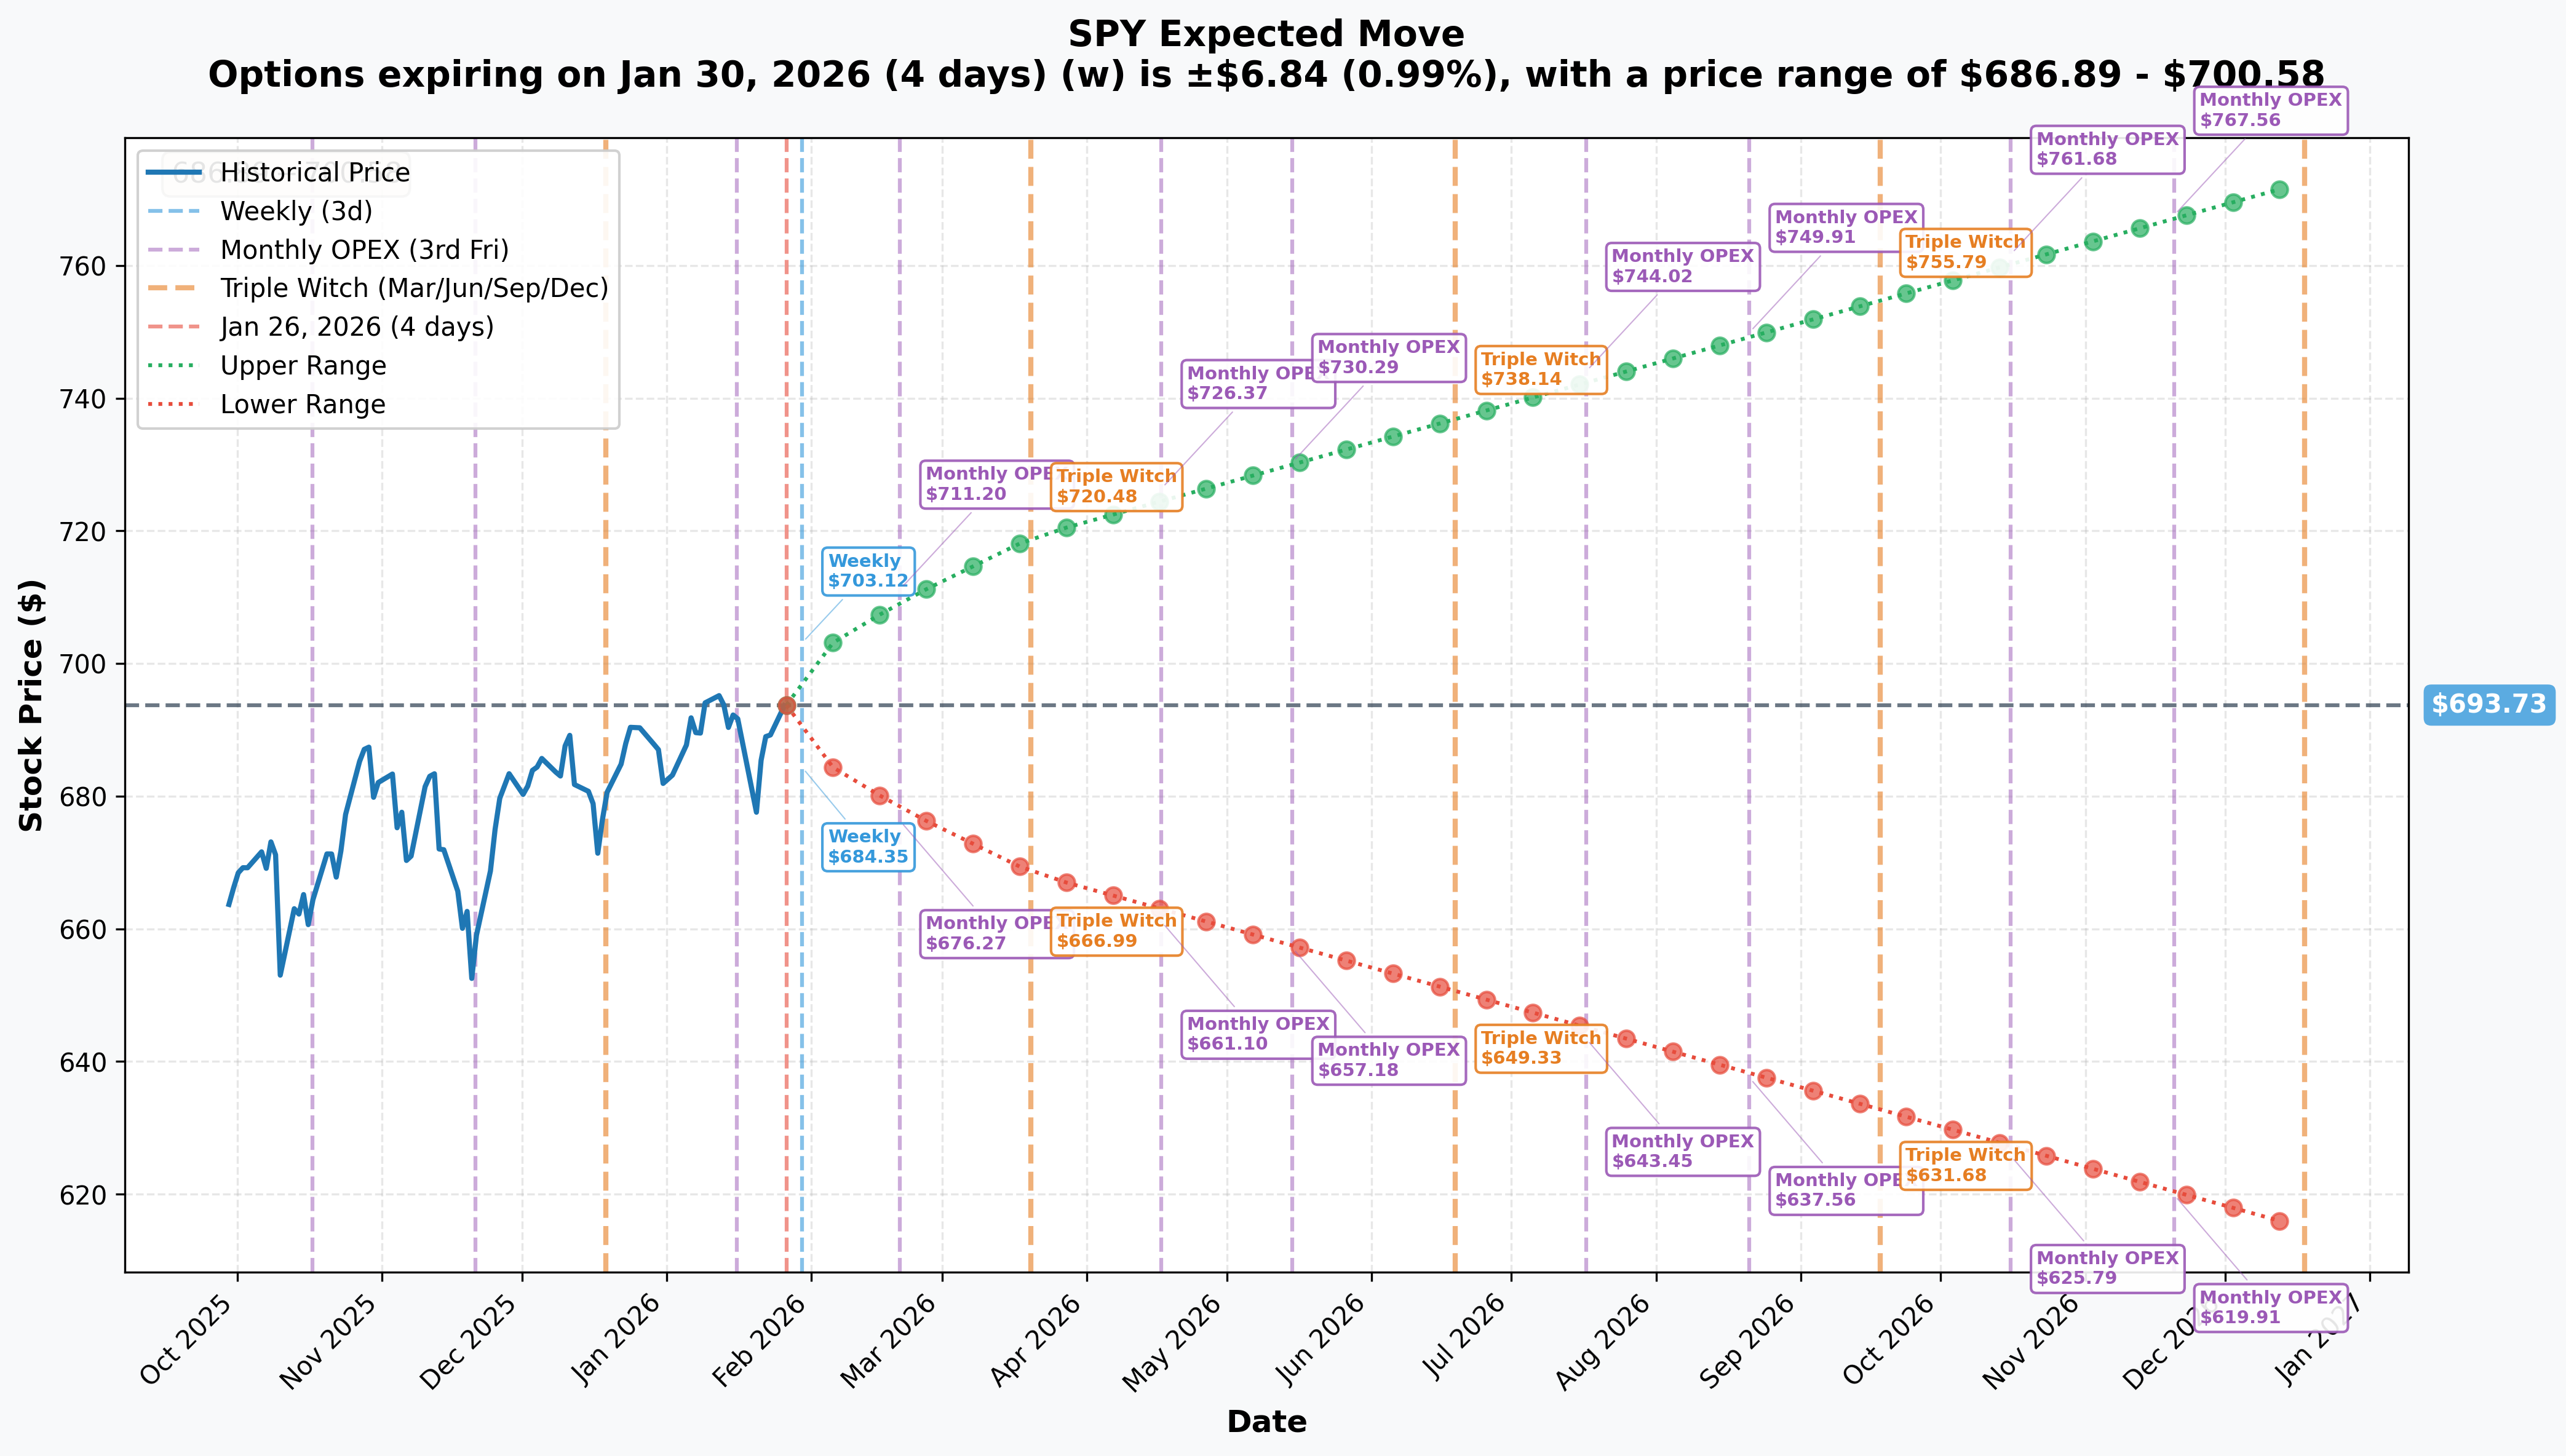
Options market pricing for upcoming expirations:
| Expiration | Type | Days to Expiry | Implied Move % | Implied Move $ | Upper Range | Lower Range |
|---|---|---|---|---|---|---|
| 2026-01-30 | Weekly | 4 | ±0.99% | ±$6.84 | $700.58 | $686.89 |
| 2026-02-20 | Monthly OPEX | 25 | ±2.27% | ±$15.74 | $709.48 | $677.99 |
| 2026-03-20 | Triple Witch | 53 | ±3.66% | ±$25.38 | $719.11 | $668.36 |
| 2026-12-18 | Yearly LEAPS | 326 | ±11.38% | ±$78.92 | $772.66 | $614.81 |
Translation for regular folks:
- This week (through FOMC): Market pricing only ±1% ($7) move - seems low given the catalyst density!
- February OPEX (when this trade expires): Market pricing ±2.27% ($15.74) move, implying a range of $678-$709
- Bear Put Spread target ($655-659): This is BELOW the implied move lower range of $678 - the trader is betting on a move larger than what options are currently pricing
Key insight: The spread's target strike of $655 represents a -5.6% move from current levels, while the options market is only pricing in ±2.27% for the same timeframe. This trader is betting the market is UNDERPRICING downside risk!
Catalysts
Immediate Events (This Week - January 26-31, 2026)
| Date | Event | Details | Impact |
|---|---|---|---|
| Jan 27-28 | FOMC Meeting | Rates expected to hold at 3.5%-3.75%; 16% odds of cut | HIGH |
| Jan 28 | MSFT Earnings | Expected: EPS $3.88, Revenue $80.2B (+20.1%, +15.2% YoY) | HIGH |
| Jan 28 | META Earnings | Expected: EPS $8.15, Revenue $58.4B (+1.6%, +20.7% YoY) | HIGH |
| Jan 28 | TSLA Earnings | After market close | HIGH |
| Jan 29 | AAPL Earnings | Revenue +9% YoY expected; iPhone 17 "Super Cycle" focus | HIGH |
| Jan 29 | Q4 2025 GDP | GDPNow estimate: +5.4% annualized | MEDIUM |
This is an unprecedented concentration of market-moving events in a single week. Four of the seven largest companies in the world reporting earnings, plus a Fed decision - any combination of disappointments could trigger the pullback this trader is betting on.
February 2026 Catalysts
| Date | Event | Details |
|---|---|---|
| Feb 6 | January Jobs Report | Employment Situation release 8:30 AM ET |
| Feb 11 | January CPI | Consumer Price Index release 8:30 AM ET |
| Feb 20 | Monthly OPEX | This trade's expiration date |
| Mid-Feb | 13F Filings Due | Institutional ownership disclosures |
Recent Catalysts (Already Happened)
Q4 2025 Earnings Season In Progress
- 13% of S&P 500 companies reported as of January 16, 2026
- Beat rate: 75% (below 5-year average of 78%)
- Earnings surprise: +5.3% (below 5-year average of +7.7%)
- Blended YoY growth: +8.2% - would mark 10th consecutive quarter of growth if achieved
December 2025 Inflation Data
- Core CPI at 2.6% YoY - slowest pace since March 2021
- Headline CPI at 2.7% YoY - still above Fed's 2% target
- Gas prices fell 5.3% MoM providing consumer relief
December 2025 Employment
- Nonfarm payrolls: +50,000 (well below historical averages)
- Unemployment rate: 4.4% (4-year high, up from 4.0% in January 2025)
- 2025 average monthly job gains: only 49,000 vs 168,000 in 2024
Tariff Volatility
- January 20-21: Markets plunged on Trump Greenland tariff threats; S&P lost >$1.2 trillion in value
- January 22: Markets rallied on tariff U-turn at Davos, "TACO trade" returns
- Tariff policy remains unpredictable binary event risk
Price Targets & Probabilities
Using gamma levels, implied move data, and upcoming catalysts, here are the scenarios through February 20th expiration:
Bull Case (30% probability)
Target: $700-$720
How we get there:
- FOMC holds rates with dovish guidance signaling potential March cut
- MSFT, META, TSLA, AAPL all beat estimates with strong forward guidance
- Q4 GDP print confirms "soft landing" narrative at 5%+ growth
- Put/call ratio of 2.31 creates short squeeze as bears capitulate
- Breakout above $695 gamma wall triggers technical rally to $700+
- February CPI shows continued disinflation toward Fed's 2% target
Key metrics needed:
- Mag 7 earnings beats with raised guidance
- Fed Chair Powell explicitly dovish on future rate path
- No tariff policy surprises
Impact on the Bear Put Spread: Total loss of $600K premium paid (100% of capital at risk)
Base Case (45% probability)
Target: $680-$695 (Choppy Consolidation)
Most likely scenario:
- FOMC holds rates with neutral/balanced commentary (no surprise either way)
- Mixed earnings results: some beats, some misses within Mag 7
- Market digests recent gains, consolidates near all-time highs
- Volatility spikes around individual earnings but no sustained trend
- Trading within implied move range of $678-$709
- Put/call ratio normalizes as hedges roll off post-earnings
Impact on the Bear Put Spread: Partial loss. If SPY at $680, puts have some value but spread likely loses $400-500K.
Bear Case (25% probability)
Target: $655-$675
What could go wrong:
- FOMC delivers hawkish surprise - no more cuts in 2026, inflation concerns cited
- Multiple Mag 7 earnings disappoint (AI monetization questions, China headwinds)
- Q4 GDP misses expectations, recession fears return
- Tariff policy escalation: Trump announces new measures on China/Europe
- January jobs/CPI data show reacceleration of inflation or labor weakness
- Elevated valuations (22.2x forward P/E) compress on reduced earnings outlook
- Break below $680 triggers cascade selling to $660 area
Critical support levels:
- $680: Major gamma floor - must hold or momentum shifts bearish
- $675: Deep put gamma support, potential bounce zone
- $660: Extended floor - Bear Put Spread target zone
- $655: Trade's max profit zone
Impact on the Bear Put Spread:
- SPY at $660: Profit = ~$3.00 per spread = $6M gain (10x return!)
- SPY at $655: Max profit = $3.70 per spread = $7.4M gain (12x return!)
- SPY at $650: Profit still capped at max = $7.4M (spread hits max value at lower strike)
Trading Ideas
Conservative: Wait for Post-Earnings Clarity
Play: Stay on sidelines until after FOMC (Jan 28) and Mag 7 earnings (Jan 28-29) resolve
Why this works:
- Unprecedented catalyst density creates binary event risk - too dangerous for new positions
- VIX at 15-16 is historically low given the event calendar - could spike 25-50% on any surprise
- Options expensive pre-earnings; wait for IV crush to get better entries
- Elevated put/call ratio (2.31) suggests heavy hedging - market could gap either direction
- Better risk/reward setups emerge after major events clear
Action plan:
- Watch FOMC statement and Powell presser closely (Jan 28, 2:00 PM ET)
- Monitor earnings reactions for MSFT, META, TSLA, AAPL
- If market drops 3-5% post-earnings, consider buying SPY $660-680 puts for continuation
- If market rallies through $700, respect the trend and avoid fighting momentum
- Look for SPY entry on pullback to $680-685 area with gamma support
Risk level: Minimal | Skill level: Beginner-friendly
Balanced: Protective Put Collar Post-Earnings
Play: After earnings week, protect long SPY positions with collar strategy
Structure: If long 100 shares SPY:
- Sell 1 February 20 $710 call (~$3.00-4.00 credit)
- Buy 1 February 20 $675 put (~$3.00-4.00 debit)
- Net cost: Approximately zero (collar pays for itself)
Why this works:
- Caps upside at $710 (+2.3%) but provides floor at $675 (-2.7%) for FREE
- Perfect after earnings if you're bullish but concerned about tariff/macro risk
- Lets you stay invested while sleeping at night
- If SPY above $710 at expiration, you're forced to sell at 2.3% profit - not terrible
- If SPY below $675, your put protects you from further losses
Risk level: Low (defined outcomes) | Skill level: Intermediate
Aggressive: Copy the Institutional Bear Put Spread
Play: Replicate the $8.2M trade at smaller scale
Structure:
- Buy February 20 $659 puts
- Sell February 20 $655 puts
- Net debit: ~$0.30-0.40 per spread ($30-40 per spread x 10 contracts = $300-400)
Why this could work:
- Following smart money - institutional player paid $8.2M for this exact structure
- Asymmetric payoff: Risk ~$0.30 to make up to $3.70 (12:1 reward/risk)
- Defined risk - maximum loss is the premium paid
- 25 days gives multiple catalysts time to play out
- Market appears to be underpricing downside risk (spread targets below implied move range)
Why this could fail:
- SPY just needs to stay above $659 for you to lose entire premium
- Market has strong bullish momentum and is near all-time highs
- FOMC/earnings could surprise to upside
- Betting against the trend is historically low probability
Estimated P&L:
- SPY at $693+ (above $659): Lose entire $300-400 premium (100% loss)
- SPY at $659: Breakeven
- SPY at $655: Max profit = $3,700 per 10 contracts (925% ROI!)
- SPY at $650: Still max profit (capped at $655 strike)
Position sizing: Only risk 1-2% of portfolio maximum. This is a speculative bearish play against the trend.
Risk level: HIGH (can lose 100%) | Skill level: Advanced
Risk Factors
Don't get caught by these potential landmines:
-
Catalyst overload in 48 hours: FOMC (Jan 27-28), MSFT/META/TSLA (Jan 28), AAPL/GDP (Jan 29) create extreme binary event risk. Any combination of hawkish Fed + earnings misses could send SPY down 3-5% instantly. Conversely, dovish Fed + earnings beats could send it 3-5% higher. Timing entries around this week is extremely difficult.
-
Valuations stretched at 22.2x forward P/E: Current valuation is 18% above the 10-year average of 18.7x. This leaves minimal margin of safety if earnings growth disappoints. At these multiples, even meeting expectations may not drive upside.
-
Magnificent Seven concentration risk: The top 7 stocks represent ~25% of index earnings but have seen enthusiasm wane - "Long Mag 7" trade popularity has halved from 54% to 27%. Mag 7 earnings growth decelerating to +18% (vs +30%+ in prior years).
-
Labor market deterioration: Unemployment at 4.4% (4-year high), 2025 average job gains of only 49,000/month (vs 168,000 in 2024). Fed torn between inflation and employment mandates creates policy uncertainty.
-
Tariff policy whiplash: 82% of tariff costs borne by U.S. companies/consumers. Trump's tariff threats are unpredictable - January 20-21 selloff erased >$1.2 trillion in market value before quick reversal. Could happen again without warning.
-
Fed Chair transition risk: Powell's term expires May 2026; Trump to nominate replacement. Uncertainty around new Fed leadership could create market volatility in coming months.
-
Put/call ratio at 2.31: Elevated bearish positioning could cut both ways - either vindicates bears if selloff occurs, or creates fuel for short squeeze if market rallies and hedges unwind.
-
0DTE options volatility sink: 59% of SPX trading volume now in 0DTE options, creating unusual intraday volatility dynamics that can amplify moves in unexpected ways.
The Bottom Line
Real talk: Someone just paid $600K net premium (on an $8.2M notional trade) betting SPY drops 5%+ before February 20th. They're not betting the farm - this is a defined-risk position that could return 12:1 if they're right. But they clearly see risks that the broader market may be underpricing.
What this trade tells us:
- Smart money is concerned about the catalyst-dense week ahead
- The trade targets $655-659, which is BELOW the implied move range of $678 - they think options are mispricing downside risk
- February 20th expiration captures FOMC, Mag 7 earnings, jobs report, and CPI - all potential negative catalysts
- Z-score of 12.7 means this type of large bearish positioning happens only a few times per year
This is NOT a "crash incoming" signal - it's a "hedge your bets" signal.
If you own SPY:
- Consider trimming 10-20% at current levels to lock in +17.75% YTD gains
- Set mental stop at $680 gamma support - if we break there, momentum shifts bearish
- Don't add to positions before FOMC/earnings clarity
- Consider protective puts or collars if holding through catalyst week
If you're watching from sidelines:
- Wait until after January 29 (after AAPL earnings and GDP) for cleaner setup
- If SPY drops to $675-680 post-earnings, that's an excellent entry with gamma support
- If SPY breaks above $700, respect the trend and look for pullback entries
- Don't fight the tape either direction - let price confirm before committing capital
If you're bearish:
- The institutional Bear Put Spread at $659/$655 is the roadmap
- Consider smaller-scale versions of this trade after earnings week if bearish thesis confirms
- Watch for break below $680 as trigger for accelerated selling
- February put spreads offer defined risk way to express bearish view
Mark your calendar - Key dates:
- Jan 27-28 (Mon-Tues): FOMC meeting and rate decision
- Jan 28 (Tues) after close: MSFT, META, TSLA earnings
- Jan 29 (Wed) after close: AAPL earnings + Q4 GDP print
- Feb 6: January jobs report
- Feb 11: January CPI
- Feb 20: Monthly OPEX - Bear Put Spread expiration
Final verdict: SPY's long-term trend remains bullish - Wall Street's average 2026 price target of 7,555 on the S&P 500 implies ~10% upside, and not a single major firm forecasts negative returns. BUT, the near-term setup is treacherous with unprecedented catalyst density and stretched valuations. The $8.2M Bear Put Spread signals smart money is buying insurance against a pullback.
Be patient. Let the events clear. The market will still be here in two weeks, and you'll have much better visibility on direction after this week's catalysts resolve.
This is risk management, not panic. Protect your capital.
Disclaimer: Options trading involves substantial risk of loss and is not suitable for all investors. This analysis is for educational purposes only and not financial advice. Past performance doesn't guarantee future results. The Bear Put Spread structure discussed involves defined risk (loss of premium paid) but still represents speculative positioning. Always do your own research and consider consulting a licensed financial advisor before trading. The catalyst-dense week ahead (FOMC, Mag 7 earnings, GDP) creates binary event risk with potential for 3-5% gaps in either direction.
About SPDR S&P 500 ETF Trust: SPY is the world's largest and most liquid exchange-traded fund with $704.84 billion in assets under management. It tracks the S&P 500 Index, providing exposure to the 500 largest U.S. companies by market capitalization. SPY is the benchmark by which institutional portfolio managers measure performance and the primary vehicle for expressing views on broad U.S. equity market direction.